

Key Points
miR-29 down-modulation in an intraclonal CLL subpopulation from immune niches allows for higher TRAF4 and increased CD40 responsiveness.
BCR-signaling represses miR-29 via MYC, allowing for stronger CD40-NFkB signaling, and this regulatory loop is disrupted by BCR inhibitors.

Abstract
B-cell receptor (BCR) signaling and T-cell interactions play a pivotal role in chronic lymphocytic leukemia (CLL) pathogenesis and disease aggressiveness. CLL cells can use microRNAs (miRNAs) and their targets to modulate microenvironmental interactions in the lymph node niches. To identify miRNA expression changes in the CLL microenvironment, we performed complex profiling of short noncoding RNAs in this context by comparing CXCR4/CD5 intraclonal cell subpopulations (CXCR4dimCD5bright vs CXCR4brightCD5dim cells). This identified dozens of differentially expressed miRNAs, including several that have previously been shown to modulate BCR signaling (miR-155, miR-150, and miR-22) but also other candidates for a role in microenvironmental interactions. Notably, all 3 miR-29 family members (miR-29a, miR-29b, miR-29c) were consistently down-modulated in the immune niches, and lower miR-29(a/b/c) levels associated with an increased relative responsiveness of CLL cells to BCR ligation and significantly shorter overall survival of CLL patients. We identified tumor necrosis factor receptor–associated factor 4 (TRAF4) as a novel direct target of miR-29s and revealed that higher TRAF4 levels increase CLL responsiveness to CD40 activation and downstream nuclear factor-κB (NF-κB) signaling. In CLL, BCR represses miR-29 expression via MYC, allowing for concurrent TRAF4 upregulation and stronger CD40–NF-κB signaling. This regulatory loop is disrupted by BCR inhibitors (bruton tyrosine kinase [BTK] inhibitor ibrutinib or phosphatidylinositol 3-kinase [PI3K] inhibitor idelalisib). In summary, we showed for the first time that a miRNA-dependent mechanism acts to activate CD40 signaling/T-cell interactions in a CLL microenvironment and described a novel miR-29–TRAF4–CD40 signaling axis modulated by BCR activity.
Introduction
The (de)regulation of microenvironmental interactions, especially B-cell receptor (BCR) signaling and T-cell interactions plays a pivotal role in chronic lymphocytic leukemia (CLL) pathogenesis.1,2 It has been postulated that CLL cells depend on constant recirculation between peripheral blood and lymph nodes where they obtain prosurvival/proproliferative signals, and inhibition of the recirculation process is an important mechanism of action of BCR inhibitors such as ibrutinib and idelalisib.1-3 Microenvironmental interactions and gene expression changes in immune niches can be studied by directly examining lymph node biopsies or more conveniently by analyzing an intraclonal CLL cell subpopulation that has recently exited the lymph nodes (characterized as CXCR4dimCD5bright cells).3-7 These studies revealed that, in the lymph node niches, both BCR activation and T-cell interactions are concurrently available to CLL cells to induce proliferation,1,7 and their variable intensity contributes to the heterogeneity in disease aggressiveness.8-11 T-cell interactions’ essential role can be illustrated by the possibility of inducing CLL cell proliferation in vitro by providing T-cell factors such as CD40L,12-16 and CLL cotransplantation with activated T cells is required for their significant proliferation in immunodeficient mice.17 We and others have shown that microRNAs (miRNAs) can regulate microenvironmental interactions such as BCR signaling in CLL.18-21 However, it is unknown if miRNAs are involved in modulating T-cell interactions in the context of CLL (or normal) microenvironment.
MicroRNAs are short noncoding RNAs that can each regulate a variety of different mRNAs’ by negatively influencing their stability and/or translation.22-25 In lymphoid cells, such regulation of gene dose by miRNAs is needed for proper maturation and survival of B and T cells, BCR signaling, and T-cell receptor signaling proficiency.24,26-30 It has been described that several miRNAs are associated with CLL prognosis31-36 and pathogenesis (miR-15-16)37,38 ; however, the pathways regulated by most miRNAs remain unknown. We and others have shown that miRNAs contribute to the deregulation of apoptosis,37,39 BCR signaling,18-20,40,41 or metabolism in CLL cells.42 Additionally, treatment of CLL patients with chemotherapy or BCR inhibitors affects the expression of miRNAs that are involved in these processes.40,43,44
In this study, we performed the first miRNA expression profiling in sorted CXCR4/CD5 intraclonal CLL subpopulations to identify miRNAs potentially relevant in microenvironmental interactions. We identified dozens of differentially expressed miRNAs including the downregulation of miR-29 in the proliferative CXCR4dimCD5bright cell subpopulation and in CLL lymph nodes. Low levels of miR-29 were previously consistently reported as associated with unfavorable prognosis in CLL31,32,45-47 and other B-cell malignancies,48-50 which underscores the need to understand miR-29’s functional relevance. Therefore, we performed an unbiased search for miR-29 targets and identified tumor necrosis factor receptor–associated factor 4 (TRAF4) as its novel direct target. We further revealed a novel TRAF4 function in controlling T-cell interactions via CD40 pathway and that miR-29 levels are repressed by BCR-induced MYC. Finally, we observed that therapy with ibrutinib or idelalisib leads to upregulation of miR-29 expression and subsequent TRAF4 repression, which limits the CLL cell ability to respond to T-cell signals. In summary, the down-modulation of miR-29 in the context of microenvironmental interactions and BCR activation provides a novel regulatory loop that increases CD40 signaling propensity.
Methods
CLL cohort and cell lines
Blood samples were collected from patients after obtaining written informed consent and approval of the institutional review board. Peripheral CLL cells were isolated from untreated (at diagnosis or least 6 months untreated; Table 1; supplemental Table 1 available on the Blood Web site) or treated CLL patients (ibrutinib or idelalisib, both as single agent; supplemental Table 2) by density centrifugation (Ficoll-Paque, HealthCare Life Sciences), followed by magnetic anti-CD3 MicroBeads separation (Miltenyi Biotec), or in some cases, negative selection with RosetteSep Human B Cell Enrichment Cocktail (Stemcell Technologies) was used to obtain purity of ≥95% of CD5+19+ cells (evaluated by flow cytometry). Sorting of CXCR4dimCD5bright vs CXCR4brightCD5dim subpopulations (purity > 99%) was performed as previously described by gating each subpopulation as ∼5% of the clone3,5 ; flow cytometric analysis is described in the supplemental Methods. The MEC1 and HEK293FT cell lines were obtained from the German Collection of Microorganisms and Cell Cultures or American Type Culture Collection, respectively.
mRNA/miRNA profiling and quantitative reverse transcriptase-polymerase chain reaction
Total RNA was isolated by TRI-Reagent (Sigma Aldrich) as previously described (RIN > 8).51 The NEB Next Small RNA Library Prep kit for miRNA profiling or TruSeq Stranded mRNA LT Sample Prep Kit for mRNA profiling (NextSeq, Illumina) were used as previously described.5,40 For details on library preparation and data analyses, see supplemental Methods. The expression of individual miRNAs/mRNAs was assayed with TaqMan MicroRNA or Gene Expression Assays (Thermo Fisher Scientific), respectively, and normalized to endogenous controls (RNU38B and RNU48 for miRNAs, TBP and HPRT1 for mRNA) as previously described.35,36
Cell transfection and CD40/BCR activation
The cells were electroporated using the Neon Transfection System (Thermo Fisher Scientific) with an artificial miR-29c (MISSION miRNA Mimic, 1000 nM) or control short RNA (MISSION miRNA Mimic Negative Control, 1000 nM; Sigma Aldrich), siRNA against TRAF4 (Silencer Select Pre-Designed siRNA, 500 nM) or control siRNA (Silencer Select Negative Control No.1, 500 nM; Thermo Fisher Scientific), LNA miR-29 family inhibitor (miRCURY LNA miRNA inhibitor, 500 nM) or control miRNA inhibitor (Negative Control A, 500 nM, Qiagen). The cells were harvested for viability analyses, quantitative reverse transcriptase-polymerase chain reaction (qRT-PCR) and immunoblotting (supplemental Methods). Transfected cells were stimulated with recombinant soluble CD40 ligand (CD40L, 1 µg/mL; Peprotech) in serum-free media (37°C) for the indicated time period and lysed for immunoblotting (see supplemental Methods). For BCR activation by bead-bound anti–immunoglobulin M (IgM), cells were incubated with Dynabeads M-270-Epoxy (Thermo Fisher Scientific) coated with goat F(ab′)2 anti-human IgM or isotype control (see supplemental Methods). BCR crosslinking for the measurement of intracellular calcium flux was performed by soluble goat F(ab′)2 anti-human IgM (Southern Biotechnology; 10 µg/mL), as described elsewhere18,19 (see supplemental Methods).
Luciferase assay
Luciferase reporter assay was carried out using psiCHECK2 reporter plasmid and the Promega Dual-Luciferase Reporter Assay Kit (Promega) as previously described41 (see supplemental Methods).
Statistical analysis
Apart from next-generation sequencing (NGS) data analysis (for further details, see supplemental Methods), all statistical analyses were performed with GraphPad Prism Software v5.0 (GraphPad Software). P < .05 was considered significant.
Results
MicroRNA expression and miR-29 down-modulation in CXCR4dimCD5bright cell subpopulation
It has been postulated that CLL cells that have recently exited the lymph node microenvironment are characterized by low CXCR4 levels and high CD5 levels (CXCR4dimCD5bright), whereas the CLL cells prone to recirculate back to immune niches are characterized as CXCR4brightCD5dim.3-5 This model recapitulates the phenotype of CLL cell recirculation, and CXCR4dimCD5bright cells retain a “fingerprint” of gene expression reflecting their activation in the lymph node niches.3-5 Here, we performed the first complex miRNA expression profiling in sorted CXCR4/CD5 intraclonal subpopulations (n = 14, 7 pairs; Illumina miRNA-seq). This identified 36 differentially expressed miRNAs in CXCR4/CD5 subpopulations (Figure 1A; supplemental Table 3) including lower miR-150 levels and higher miR-155, miR-22 levels in CXCR4dimCD5bright cells, which is in line with their known role in regulating BCR signaling in the CLL microenvironment18-20 (Figure 1A). In this analysis, we noticed that all 3 members of the miR-29 family (miR-29a/b/c) were consistently down-modulated (∼2-fold; P < 10−6) in the CXCR4dimCD5bright cells (Figure 1A); this was validated by qRT-PCR (Figure 1B). We also observed lower miR-29 levels in paired peripheral blood and lymph node CLL samples (supplemental Figure 1A). This is in concordance with a similar transcriptional regulation of all miR-29 family52 and suggests that these miRNAs might have a role in regulating microenvironmental signaling. miR-29 levels assessed from the total RNA isolated from the bulk of CLL cells in peripheral blood were intermediate between its expression in CXCR4dimCD5bright and CXCR4brightCD5dim subpopulations for the individual patient (supplemental Figure 1B; data not shown), which is similar to what we have previously observed for other genes such as miR-155 and CD20.3,5,18 It has previously been shown that the expression of miR-29 family from peripheral blood CLL cells is independently associated with prognosis in CLL.31,32 Indeed, in our CLL cohort, lower levels of all 3 miR-29s were associated with shorter overall survival (Figure 1C; supplemental Figure 2; miR-29a: hazard ratio [HR], 3.1; miR-29b: HR, 3.6; miR-29c: HR, 3.4; all P < .05) and unfavorable clinico-biological characteristics, namely unmutated immunoglobulin heavy chain variable region (IGHV), expression of ZAP-70, or higher Rai stage (Figure 1D-F; RNA isolated from the bulk of purified peripheral blood CLL cells; cohort characteristics in Table 1). The levels of miR-29a/b/c had no discernible relationship with the CD38 expression or with specific chromosomal abnormalities (supplemental Figure 1C-D). Altogether, miR-29 levels are downregulated in the proliferative CXCR4dimCD5bright cell subpopulation, and lower miR-29 levels associate with disease aggressiveness; however, the miR-29 target(s) and its biological relevance in immune niches remain largely unknown.

miR-29 levels are downregulated in CXCR4dimCD5bright intraclonal subpopulation and associate with prognosis in CLL. (Ai) Representative example of sorting CXCR4dimCD5bright and CXCR4brightCD5dim CLL cell intraclonal subpopulations using flow cytometry. (Aii) Heatmap of differentially expressed miRNAs (fold-change > 1.5, adjusted P < .0005) in 7 pairs of CXCR4/CD5 sorted subpopulations (purity > 99%; for sample characteristics, see supplemental Table 1). Heatmap was generated from counts per million reads (rows centered to the median of the row). For details on individual miRNA expression see supplemental Table 3. (B) miR-29a/b/c levels analyzed using qRT-PCR in the CXCR4/CD5 sorted subpopulations from primary CLL samples (miR-29a/c, n = 10; miR-29b, n = 9; statistical differences were compared by Wilcoxon matched pairs test). (C) Overall survival is depicted using Kaplan-Meier curves in the CLL cohort (n = 107) divided by terciles of miR-29a/b/c expression (with log-rank test for comparison of low vs high miR-29s levels; miR-29a: HR, 3.1; 95% CI, 1.3-7.4; miR-29b: HR, 3.6; 95% CI, 1.3-10.20; miR-29c: HR, 3.4; 95% CI, 1.4-8.3). (D-F) Expression of miR-29a/b/c and its relationship with clinico-biological features. miR-29a, b, and c expressions were quantified in a cohort of 107 CLL patients (cohort characteristics in Table 1) and correlated to the clinico-biological characteristics such as (D) IGHV mutation status, (E) ZAP-70 expression, and (F) Rai stage (at sampling). The expression level of miR-29c was not available for 3 samples because of technical issues with its quantification. The statistical differences were tested using unpaired t test.
miR-29 levels are downregulated in CXCR4dimCD5bright intraclonal subpopulation and associate with prognosis in CLL. (Ai) Representative example of sorting CXCR4dimCD5bright and CXCR4brightCD5dim CLL cell intraclonal subpopulations using flow cytometry. (Aii) Heatmap of differentially expressed miRNAs (fold-change > 1.5, adjusted P < .0005) in 7 pairs of CXCR4/CD5 sorted subpopulations (purity > 99%; for sample characteristics, see supplemental Table 1). Heatmap was generated from counts per million reads (rows centered to the median of the row). For details on individual miRNA expression see supplemental Table 3. (B) miR-29a/b/c levels analyzed using qRT-PCR in the CXCR4/CD5 sorted subpopulations from primary CLL samples (miR-29a/c, n = 10; miR-29b, n = 9; statistical differences were compared by Wilcoxon matched pairs test). (C) Overall survival is depicted using Kaplan-Meier curves in the CLL cohort (n = 107) divided by terciles of miR-29a/b/c expression (with log-rank test for comparison of low vs high miR-29s levels; miR-29a: HR, 3.1; 95% CI, 1.3-7.4; miR-29b: HR, 3.6; 95% CI, 1.3-10.20; miR-29c: HR, 3.4; 95% CI, 1.4-8.3). (D-F) Expression of miR-29a/b/c and its relationship with clinico-biological features. miR-29a, b, and c expressions were quantified in a cohort of 107 CLL patients (cohort characteristics in Table 1) and correlated to the clinico-biological characteristics such as (D) IGHV mutation status, (E) ZAP-70 expression, and (F) Rai stage (at sampling). The expression level of miR-29c was not available for 3 samples because of technical issues with its quantification. The statistical differences were tested using unpaired t test.
Cohort characteristics (n = 107)
| N | % | |
|---|---|---|
| Median age at diagnosis (range), y | 56 (34-79) | |
| Median follow-up, y | 9.3 | |
| Median survival, y | 15.7 | |
| Median time from diagnosis to blood collection, y | 2.7 | |
| Treated during follow-up | 76 | 71.0 |
| Male/female | 69/38 | 64/36 |
| Rai stage at sampling | ||
| 0 | 12 | 11.2 |
| I | 1 | 0.9 |
| II | 56 | 52.3 |
| III-IV | 20 | 18.7 |
| Not determined | 18 | |
| IGHV/ZAP-70/CD38 status | ||
| unmut IGHV/mut IGHV | 47/60 | (44/56) |
| ZAP-70+/ZAP-70− | 47/60 | (44/56) |
| CD38+/CD38− | 30/77 | (28/72) |
| Hierarchical cytogenetics (fluorescence in situ hybridization) | ||
| del 17p13 | 8 | 7.5 |
| del 11q23 | 9 | 8.4 |
| del 13q14 | 33 | 30.8 |
| Trisomy 12 | 4 | 3.7 |
| Normal karyotype | 16 | 15.0 |
| Not determined | 37 |
mut, mutated; unmut, unmutated; y, years.
Identification of miR-29 target in CLL cells
Antiapoptotic myeloid cell leukemia 1 (MCL1) and T-cell leukemia/lymphoma (TCL1) have been identified as potentially regulated by miR-29 in CLL46,47 ; however, an unbiased search for miR-29 targets in CLL has not been performed. As such, we performed expression analyses of all predicted evolutionarily conserved mRNA targets of miR-29 in 10 pairs of samples sorted according to CXCR4/CD5 cell-surface levels (Illumina RNA-seq), searching for mRNAs with expression anticorrelated to miR-29. We and others have shown that such a strategy is useful because miRNAs influence their target mRNA(s) stability.19,22 All miR-29 family members have an identical “seed sequence,” determining the binding to the 3′untranslated region (3′UTR) of mRNAs, and thus they share all the predicted targets (TargetScan tool v7.2). This analysis identified 26 genes that differed in their relative expression between intraclonal CXCR4/CD5 subpopulations and have predicted evolutionary conserved binding sites (TargetScan) for miR-29 (Figure 2A; for details, see supplemental Table 4). Fourteen of these genes had an anticorrelated expression to miR-29, with higher levels in CXCR4dimCD5bright cells, and thus represent potential target mRNAs repressed by miR-29. We further focused on TRAF4 (∼2.4-fold upregulated in CXCR4dimCD5bright cells) because it has 2 evolutionary conserved predicted binding sites for miR-29, and miR-29 is predicted as the most likely TRAF4 miR-regulator (TargetScan tool v7.2). Moreover, high TRAF4 levels associated with significantly shorter overall survival in CLL patients (P = .02; HR, 2.4; 95% confidence interval [CI], 1.2-4.9; see supplemental Figure 3 also for other genes), which is in line with low miR-29 levels being associated with a more aggressive disease (see above). Additionally, we also observed a general anticorrelation of TRAF4 mRNA and miR-29 levels in a large CLL cohort (n = 97; supplemental Figure 4A-C). Next, we validated the TRAF4/miR-29 levels in CXCR4/CD5 sorted CLL samples (n = 10) by individual qRT-PCR. This confirmed higher TRAF4 levels in the CXCR4dimCD5bright cells compared with the CXCR4brightCD5dim subpopulation (Figure 2B). Furthermore, intracellular protein staining (independent cohort of 13 CLL samples) and immunoblot analysis of sorted intraclonal CXCR4/CD5 subpopulations confirmed higher TRAF4 levels in CXCR4dimCD5bright cells (Figure 2C-D). The TRAF4 level was also higher in CLL lymph nodes samples compared with paired peripheral blood CLL cells (supplemental Figure 4D-E). Moreover, high TRAF4 levels were detected by immunohistochemistry in the proliferative pseudo-follicles of CLL lymph nodes (supplemental Figure 4F). Altogether, this shows that CLL cells have anticorrelated TRAF4/miR-29 levels, and cells interacting in the microenvironment have lower miR-29 and higher TRAF4 levels.
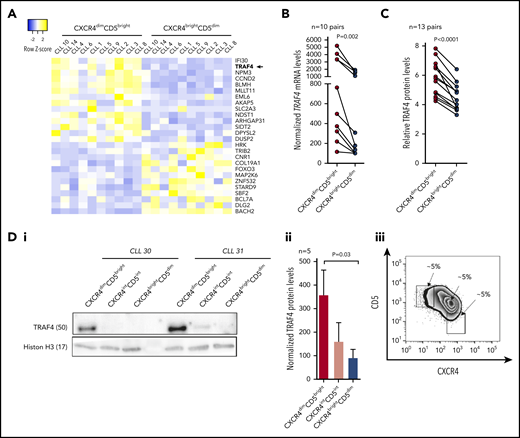
TRAF4 is upregulated in CXCR4dimCD5bright intraclonal subpopulation. (A) Heatmap of differentially expressed mRNAs (fold-change > 2; adjusted P < .0005) in 10 pairs of CXCR4/CD5 sorted subpopulations (purity > 99%; for sample characteristics, see supplemental Table 1). Plotted mRNAs represent an overlap of differentially expressed mRNAs and predicted evolutionary conserved miR-29 targets (TargetScan tool). Samples CLL1, CLL4, CLL6, CLL8, CLL9, and CLL14 are identical to Figure 1A (6 of 7 pairs for miRNA profiling). Heatmap was generated from counts per million reads (rows centered to the median of the row). For details on mRNA expression and miR-29 target prediction see supplemental Table 4. (B) TRAF4 mRNA levels analyzed using qRT-PCR in the CXCR4/CD5 sorted subpopulations from 10 primary CLL samples. Differences were compared by Wilcoxon matched pairs test. (C) Intracellular staining for TRAF4 protein levels in the CXCR4/CD5 subpopulations from 13 CLL samples. Results are presented as the ratio of TRAF4 expression to the isotype control, and the statistical differences were compared by paired t test. (D) The expression of TRAF4 protein in CXCR4dimCD5bright, CXCR4intermediate(int)CD5intermediate(int), and CXCR4brightCD5dim intraclonal cell populations. (i) Representative immunoblot blot analysis of TRAF4 in sorted CXCR4/CD5 subpopulations from 2 patient samples. Histon H3 was used as a loading control. (ii) Statistical analysis of TRAF4 protein levels in the CXCR4/CD5 sorted subpopulations (n = 5). The statistical differences were tested by paired t test, and the error bars indicate the standard error of the mean (SEM). (iii) Representative example of a gating strategy for CXCR4dimCD5bright, CXCR4intermediate(int)CD5intermediate(int), and CXCR4brightCD5dim intraclonal cell populations. The CXCR4intCD5int represents a transitional subpopulation between CXCR4dimCD5bright and CXCR4brightCD5dim cells.
TRAF4 is upregulated in CXCR4dimCD5bright intraclonal subpopulation. (A) Heatmap of differentially expressed mRNAs (fold-change > 2; adjusted P < .0005) in 10 pairs of CXCR4/CD5 sorted subpopulations (purity > 99%; for sample characteristics, see supplemental Table 1). Plotted mRNAs represent an overlap of differentially expressed mRNAs and predicted evolutionary conserved miR-29 targets (TargetScan tool). Samples CLL1, CLL4, CLL6, CLL8, CLL9, and CLL14 are identical to Figure 1A (6 of 7 pairs for miRNA profiling). Heatmap was generated from counts per million reads (rows centered to the median of the row). For details on mRNA expression and miR-29 target prediction see supplemental Table 4. (B) TRAF4 mRNA levels analyzed using qRT-PCR in the CXCR4/CD5 sorted subpopulations from 10 primary CLL samples. Differences were compared by Wilcoxon matched pairs test. (C) Intracellular staining for TRAF4 protein levels in the CXCR4/CD5 subpopulations from 13 CLL samples. Results are presented as the ratio of TRAF4 expression to the isotype control, and the statistical differences were compared by paired t test. (D) The expression of TRAF4 protein in CXCR4dimCD5bright, CXCR4intermediate(int)CD5intermediate(int), and CXCR4brightCD5dim intraclonal cell populations. (i) Representative immunoblot blot analysis of TRAF4 in sorted CXCR4/CD5 subpopulations from 2 patient samples. Histon H3 was used as a loading control. (ii) Statistical analysis of TRAF4 protein levels in the CXCR4/CD5 sorted subpopulations (n = 5). The statistical differences were tested by paired t test, and the error bars indicate the standard error of the mean (SEM). (iii) Representative example of a gating strategy for CXCR4dimCD5bright, CXCR4intermediate(int)CD5intermediate(int), and CXCR4brightCD5dim intraclonal cell populations. The CXCR4intCD5int represents a transitional subpopulation between CXCR4dimCD5bright and CXCR4brightCD5dim cells.
Validation of TRAF4 as a target of miR-29
To validate TRAF4 regulation by miR-29, the MEC1 CLL cell line was transfected with a synthetic miR-29c (shares identical binding site in TRAF4 with miR-29a/b). This revealed a reduction in the TRAF4 protein levels by ∼30% in cells transfected with synthetic miR-29c (Figure 3A) and a similar reduction at the mRNA level (Figure 3B). The TRAF4 protein and mRNA levels were also down-modulated in primary CLL cells transfected with a synthetic miR-29c, and this was comparable to the effect of siRNA against TRAF4 (Figure 3C-D). The increase in the expression of miR-29c achieved by transfecting the synthetic miR-29c was approximately 2-fold for both MEC1 and primary CLL cells (data not shown). All the miR-29 family members have an identical seed sequence, and transfecting B cells with synthetic miR-29c or synthetic miR-29a led to a comparable reduction in TRAF4 protein levels (supplemental Figure 5A). The miR-29 family inhibitor increased TRAF4 protein levels in B cells (supplemental Figure 5B). Our data also confirmed some miR-29’s effect on MCL1 and TCL1 down-modulation described previously46,47 ; however, this seemed less prominent than the effect on TRAF4 levels (supplemental Figure 5C).
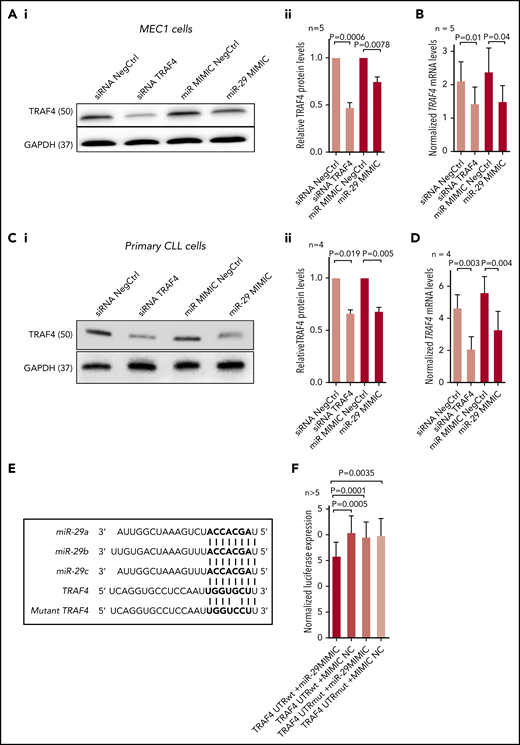
Validation of TRAF4 as a target of miR-29. (Ai) Representative example of immunoblot for TRAF4 levels in MEC1 cells transfected (72 hours) with siRNA against TRAF4 (siRNA TRAF4), control siRNA (siRNA NegCtrl), artificial miR-29c (miR-29 MIMIC), or control miRNA (miR MIMIC NegCtrl). (Aii) Densitometric quantification of TRAF4 levels for independent replicates of the experiment (n = 5) described in panel Ai. (B) Analysis of TRAF4 mRNA levels in MEC1 cells transfected by synthetic miR-29 or siRNA against TRAF4 (n = 5) as described in panel A. (Ci) Representative example of immunoblot analysis for TRAF4 levels in primary CLL cells transfected (72 hours) with siRNA against TRAF4 (siRNA TRAF4), control siRNA (siRNA NegCtrl), artificial miR-29c (miR-29 MIMIC), or control miRNA (miR MIMIC NegCtrl). (Cii) Densitometric quantification of TRAF4 protein levels for independent replicates of the experiment (n = 4) described in panel Ci. (D) Analysis of TRAF4 mRNA expression in primary CLL cells transfected by synthetic miR-29 or siRNA against TRAF4 (n = 4) as described in panel Ci. (E) Alignment of miR-29a/b/c with 3′UTR of TRAF4 mRNA (at position 161-167). (F) Luciferase activity in HEK293FT cells cotransfected with psiCHECK2 vector containing the cloned 3′UTR region of TRAF4 encoding the putative miR-29 binding site at position 161-167 (TRAF4 UTRwt) and either artificial miR-29c (miR-29 MIMIC) or control miRNA (mimic NC), or containing a cloned mutated 3′UTR of TRAF4 (TRAF4 UTRmut; (G>C at position 165) and either artificial miR-29c (miR-29 MIMIC) or control miRNA (mimic NC). Renilla activity was measured 24 hours after transfection, and activity was normalized to the endogenous firefly control of the psiCHECK2 vector (n > 5). In all experiments, the differences were compared by paired t test. The error bars indicate SEM.
Validation of TRAF4 as a target of miR-29. (Ai) Representative example of immunoblot for TRAF4 levels in MEC1 cells transfected (72 hours) with siRNA against TRAF4 (siRNA TRAF4), control siRNA (siRNA NegCtrl), artificial miR-29c (miR-29 MIMIC), or control miRNA (miR MIMIC NegCtrl). (Aii) Densitometric quantification of TRAF4 levels for independent replicates of the experiment (n = 5) described in panel Ai. (B) Analysis of TRAF4 mRNA levels in MEC1 cells transfected by synthetic miR-29 or siRNA against TRAF4 (n = 5) as described in panel A. (Ci) Representative example of immunoblot analysis for TRAF4 levels in primary CLL cells transfected (72 hours) with siRNA against TRAF4 (siRNA TRAF4), control siRNA (siRNA NegCtrl), artificial miR-29c (miR-29 MIMIC), or control miRNA (miR MIMIC NegCtrl). (Cii) Densitometric quantification of TRAF4 protein levels for independent replicates of the experiment (n = 4) described in panel Ci. (D) Analysis of TRAF4 mRNA expression in primary CLL cells transfected by synthetic miR-29 or siRNA against TRAF4 (n = 4) as described in panel Ci. (E) Alignment of miR-29a/b/c with 3′UTR of TRAF4 mRNA (at position 161-167). (F) Luciferase activity in HEK293FT cells cotransfected with psiCHECK2 vector containing the cloned 3′UTR region of TRAF4 encoding the putative miR-29 binding site at position 161-167 (TRAF4 UTRwt) and either artificial miR-29c (miR-29 MIMIC) or control miRNA (mimic NC), or containing a cloned mutated 3′UTR of TRAF4 (TRAF4 UTRmut; (G>C at position 165) and either artificial miR-29c (miR-29 MIMIC) or control miRNA (mimic NC). Renilla activity was measured 24 hours after transfection, and activity was normalized to the endogenous firefly control of the psiCHECK2 vector (n > 5). In all experiments, the differences were compared by paired t test. The error bars indicate SEM.
To test for direct interaction of miR-29 with the 3′UTR of TRAF4, we cotransfected HEK293FT cells with the synthetic miR-29c or a negative control and a luciferase reporter containing the putative miR-29 binding site from 3′UTR of TRAF4 gene or a mutated site (containing a point mutation in the miR binding seed region). To validate miR-29 binding, we selected the predicted binding site at position 161-167 of 3′UTR, which has a higher overall binding score compared with the second miR-29 binding site (for miR-29 alignments with the 3′UTR region, see Figure 3E and supplemental Figure 6). This confirmed miR-29’s direct physical binding at positions 161 to 167 of the TRAF4 3′UTR (Figure 3F); however, it does not exclude the possibility that other regions of TRAF4 3′UTR might bind miR-29. On the other hand, the miR-29 mimic did not affect the luciferase activity in cells cotransfected with a luciferase-reporter construct containing the mutated TRAF4 binding site (Figure 3F). We conclude that the seed sequence of miR-29 family members inhibits TRAF4 expression by directly binding to its 3′UTR region.
miR-29 is repressed by BCR-induced MYC
The transcriptional regulation of all three miR-29 family members is known to be similar,52 and it has previously been demonstrated in aggressive B-cell lymphomas that miR-29 is directly transcriptionally repressed by MYC binding to its promoter.50,53 CXCR4dimCD5bright cells have higher MYC protein levels than CXCR4brightCD5dim cells, suggesting that MYC might regulate miR-29 levels in this context (Figure 4A). Indeed, the activation of BCR signaling by a bead-bound anti-IgM induces MYC levels and leads to miR-29 down-modulation and upregulation of TRAF4 mRNA and protein levels in CLL cells (Figure 4B-D). In line with this, CLL samples that were more responsive to BCR ligation with soluble anti-IgM had significantly higher MYC, lower miR-29a and miR-29c levels, and higher TRAF4 levels than samples that were relatively less responsive to BCR crosslinking (Figure 4E-F). Additionally, samples expressing higher MYC levels had significantly lower miR-29a and miR-29c levels and higher levels of TRAF4 (Figure 4G-H; supplemental Figure 7B). Moreover, B cells from transgenic iMycCα mice (MYC transgene controlled by the Ig heavy-chain enhancer) have lower miR-29a and miR-29c levels than wild-type mice (Figure 4I), and CLL samples with a MYC aberration (n = 23, all with unmutated IGHV) also showed lower miR-29a and miR-29c levels than unmutated IGHV CLL cells that did not have a gain in MYC (supplemental Figure 8). Altogether, these data demonstrate that BCR-induced MYC represses miR-29a and miR-29c, but miR-29b is not directly dependent on MYC activity.
![Negative regulation of miR-29a/b/c by BCR-induced MYC. (A) Intracellular staining for MYC in CXCR4/CD5 sorted subpopulations from 13 CLL samples. Results are represented as the ratio of MYC protein expression to the isotype control. The statistical differences were tested by paired t test. (Bi) Representative immunoblot of TRAF4 and MYC protein levels in primary CLL cells with BCR signaling activated by bead bound anti-IgM for indicated period of time. pAKT (phosphorylated AKT) and pERK (phosphorylated ERK) serve as positive controls for BCR pathway activation. (Bii) Densitometric quantification of TRAF4 levels for replicates of the experiment (n = 6) described in panel Bi. The statistical differences were tested by paired t test. (C-D) Analyses of miR-29a/b/c (C) and TRAF4 mRNA levels (D) in primary CLL cells (n = 6) with BCR signaling activated by bead-bound anti-IgM for 72 hours as described in panel B. For MYC induction by bead-bound anti-IgM, see panel Bi. The bead-bound anti-IgM did not affect CLL cell viability (supplemental Figure 7A). The statistical differences were tested by Wilcoxon matched pairs test. (E-F) Relationship between expression of miR-29a/b/c, MYC, or TRAF4 and the relative sensitivity to BCR ligation. CLL samples (n = 29) were treated with soluble anti-IgM and monitored for BCR-induced calcium flux by flow cytometry, which allowed us to stratify cases as relatively responsive to BCR ligation (n = 15) or unresponsive to treatment with soluble anti-IgM (n = 14; see supplemental Methods). The associations between BCR responsiveness and miR-29a/b/c (E) and TRAF4 or MYC (F) expression were plotted. Below each panel is a − or + in the row labeled BCR sig: on the left to indicate samples that were low responders or high responders, respectively. P value was tested by Mann-Whitney test. (G-H) Expression of miR-29a/b/c (G) or TRAF4 (H) in CLL patients (n = 96) divided according to MYC expression. All samples with available data on MYC mRNA levels were used in the analysis, and samples were stratified according to the terciles of MYC levels (low vs intermediate [interm] vs high; for distribution of MYC expression, see supplemental Figure 7B). The difference was tested by Mann-Whitney test. (I) Differences in miR-29 levels in B cells from transgenic iMyccα mice (MYC transgene controlled by the Ig heavy-chain enhancer, n = 3) compared with wildtype (WT) mice (n = 3). The differences were tested by unpaired t test. The error bars indicate SEM.](https://ash.silverchair-cdn.com/ash/content_public/journal/blood/137/18/10.1182_blood.2020005627/4/m_bloodbld2020005627f4.png?Expires=1765905685&Signature=Ks6jHbYLVAMIeiKBhp239yWGj75IjmulYJ3HusipXggg4PtndsQxUaQfnw7~aY8Uxb2AIgjiwcfQWNVnmhc-zNh5QrREbl6qPLdLvK7Z97R8tSxxXwh-pqZwzTpw15FCGEfYEpr2zVOd7HPu6lJQZSiASlnUEkZZXOqDdj0FErK2sC0K-gCrLftsTmVIOL1O6uKNImqMHVkUYWfcFDBjVNWkX9V2Vs5nlHGjYqduyFDNQhLgBFrqSNGmZ3OK88NVKuMI8-Yw1Y-dIyc2IoFXddUbVdOwwEhqxnu2W0Fy5aSNmCxA26yxQ4QlnGSF1zT6uKaBuft80v6mnVSzcTymdw__&Key-Pair-Id=APKAIE5G5CRDK6RD3PGA)
Negative regulation of miR-29a/b/c by BCR-induced MYC. (A) Intracellular staining for MYC in CXCR4/CD5 sorted subpopulations from 13 CLL samples. Results are represented as the ratio of MYC protein expression to the isotype control. The statistical differences were tested by paired t test. (Bi) Representative immunoblot of TRAF4 and MYC protein levels in primary CLL cells with BCR signaling activated by bead bound anti-IgM for indicated period of time. pAKT (phosphorylated AKT) and pERK (phosphorylated ERK) serve as positive controls for BCR pathway activation. (Bii) Densitometric quantification of TRAF4 levels for replicates of the experiment (n = 6) described in panel Bi. The statistical differences were tested by paired t test. (C-D) Analyses of miR-29a/b/c (C) and TRAF4 mRNA levels (D) in primary CLL cells (n = 6) with BCR signaling activated by bead-bound anti-IgM for 72 hours as described in panel B. For MYC induction by bead-bound anti-IgM, see panel Bi. The bead-bound anti-IgM did not affect CLL cell viability (supplemental Figure 7A). The statistical differences were tested by Wilcoxon matched pairs test. (E-F) Relationship between expression of miR-29a/b/c, MYC, or TRAF4 and the relative sensitivity to BCR ligation. CLL samples (n = 29) were treated with soluble anti-IgM and monitored for BCR-induced calcium flux by flow cytometry, which allowed us to stratify cases as relatively responsive to BCR ligation (n = 15) or unresponsive to treatment with soluble anti-IgM (n = 14; see supplemental Methods). The associations between BCR responsiveness and miR-29a/b/c (E) and TRAF4 or MYC (F) expression were plotted. Below each panel is a − or + in the row labeled BCR sig: on the left to indicate samples that were low responders or high responders, respectively. P value was tested by Mann-Whitney test. (G-H) Expression of miR-29a/b/c (G) or TRAF4 (H) in CLL patients (n = 96) divided according to MYC expression. All samples with available data on MYC mRNA levels were used in the analysis, and samples were stratified according to the terciles of MYC levels (low vs intermediate [interm] vs high; for distribution of MYC expression, see supplemental Figure 7B). The difference was tested by Mann-Whitney test. (I) Differences in miR-29 levels in B cells from transgenic iMyccα mice (MYC transgene controlled by the Ig heavy-chain enhancer, n = 3) compared with wildtype (WT) mice (n = 3). The differences were tested by unpaired t test. The error bars indicate SEM.
Negative regulation of miR-29a/b/c by BCR-induced MYC. (A) Intracellular staining for MYC in CXCR4/CD5 sorted subpopulations from 13 CLL samples. Results are represented as the ratio of MYC protein expression to the isotype control. The statistical differences were tested by paired t test. (Bi) Representative immunoblot of TRAF4 and MYC protein levels in primary CLL cells with BCR signaling activated by bead bound anti-IgM for indicated period of time. pAKT (phosphorylated AKT) and pERK (phosphorylated ERK) serve as positive controls for BCR pathway activation. (Bii) Densitometric quantification of TRAF4 levels for replicates of the experiment (n = 6) described in panel Bi. The statistical differences were tested by paired t test. (C-D) Analyses of miR-29a/b/c (C) and TRAF4 mRNA levels (D) in primary CLL cells (n = 6) with BCR signaling activated by bead-bound anti-IgM for 72 hours as described in panel B. For MYC induction by bead-bound anti-IgM, see panel Bi. The bead-bound anti-IgM did not affect CLL cell viability (supplemental Figure 7A). The statistical differences were tested by Wilcoxon matched pairs test. (E-F) Relationship between expression of miR-29a/b/c, MYC, or TRAF4 and the relative sensitivity to BCR ligation. CLL samples (n = 29) were treated with soluble anti-IgM and monitored for BCR-induced calcium flux by flow cytometry, which allowed us to stratify cases as relatively responsive to BCR ligation (n = 15) or unresponsive to treatment with soluble anti-IgM (n = 14; see supplemental Methods). The associations between BCR responsiveness and miR-29a/b/c (E) and TRAF4 or MYC (F) expression were plotted. Below each panel is a − or + in the row labeled BCR sig: on the left to indicate samples that were low responders or high responders, respectively. P value was tested by Mann-Whitney test. (G-H) Expression of miR-29a/b/c (G) or TRAF4 (H) in CLL patients (n = 96) divided according to MYC expression. All samples with available data on MYC mRNA levels were used in the analysis, and samples were stratified according to the terciles of MYC levels (low vs intermediate [interm] vs high; for distribution of MYC expression, see supplemental Figure 7B). The difference was tested by Mann-Whitney test. (I) Differences in miR-29 levels in B cells from transgenic iMyccα mice (MYC transgene controlled by the Ig heavy-chain enhancer, n = 3) compared with wildtype (WT) mice (n = 3). The differences were tested by unpaired t test. The error bars indicate SEM.
TRAF4 is a novel regulator of CD40 signaling
Members of the TRAF family (TRAF2/3/6) play a role in B-cell–T-cell interactions by regulating CD40 signaling.54,55 We hypothesized that TRAF4 might act as a novel CD40 signaling regulator. Indeed, MEC1 cells transfected with siRNA against TRAF4 had impaired CD40 ligation responsiveness as evidenced by reduced phosphorylation of immediate downstream signaling molecules in the nuclear factor κB (NF-κB) pathway, namely IKKα/β (Figure 5A). Identical data were obtained when primary CLL cells were transfected with siRNA against TRAF4 and treated by CD40L (Figure 5B). Similarly, transfection of MEC1 cells or primary CLL cells with synthetic miR-29c reduced TRAF4 levels and impaired IKKα/β phosphorylation after stimulation with CD40 ligand (Figure 5C-D). TRAF4 silencing or cell transfection by the synthetic miR-29 did not have any significant effect on MEC1 or CLL cell viability (supplemental Figure 9). TRAF4 overexpression led to an increased IKKα/β phosphorylation after CD40L (supplemental Figure 10A), and transfecting MEC1 cells with the TRAF4 construct (not containing the miRNA binding site) rescued the effect of miR-29 on CD40 signaling (supplemental Figure 10B). We also validated the role of the miR-29/TRAF4 axis by coculturing primary CLL cells transfected with synthetic miR-29 (or negative control) with autologous T cells. In concordance with data above, CLL cells transfected by miR-29 had reduced pIKKα/β levels after the CLL–T-cell interaction (supplemental Figure 11A). Similar data were obtained when coculturing MEC1 cells transfected by synthetic miR-29 (vs negative control) with CD40L+CD4+ Jurkat T cells (supplemental Figure 11B). Interestingly, we noticed that TRAF4 silencing also repressed the basal extracellular signal-regulated kinase (ERK) phosphorylation level (supplemental Figure 12), suggesting a CD40-independent function of TRAF4 in CLL cells. Overall, the results demonstrate the existence of a novel miR-29-TRAF4 regulatory axis in CD40 signaling in CLL.

miR-29 targets TRAF4 involved in CD40-mediated NF-κB signaling. (Ai) Representative example of an immunoblot for MEC1 cells transfected with siRNA against TRAF4 (siRNA TRAF4) or negative control (siRNA NegCtrl). Seventy-two hours after transfection, the cells were stimulated with CD40L (1 µg/mL) for indicated period of time and harvested for analysis by immunoblotting. (Aii) Densitometric quantification of pIKKα/β levels for replicates of the experiment (n = 5) described in panel Ai. (Bi) Representative example of immunoblot of primary CLL cells transfected with siRNA against TRAF4 (siRNA TRAF4) or negative control (siRNA NegCtrl). Seventy-two hours after transfection, the cells were stimulated with CD40L (1 µg/mL) for indicated period of time and harvested for analysis by immunoblotting. (Bii) Densitometric quantification of pIKKα/β levels for replicates of the experiment (n = 6) described in panel Bi. (Ci) Representative example of immunoblot for MEC1 cells transfected with artificial miR-29c (miR-29 MIMIC) or negative control (miR MIMIC NegCtrl). Seventy-two hours after transfection, the cells were stimulated with CD40L (1 µg/mL) and harvested for analysis by immunoblotting. (Cii) Densitometric quantification of pIKKα/β levels for independent replicates of the experiment (n = 4) described in panel Ci. The error bars indicate the standard error of the mean. (Di) Representative example of immunoblot for primary CLL cells transfected with artificial miR-29c (miR-29 MIMIC) or negative control (miR MIMIC NegCtrl). Seventy-two hours after transfection, the cells were stimulated with CD40L (1 µg/mL) and harvested for analysis by immunobloting at the indicated time points. (Dii) Densitometric quantification of pIKKα/β levels for replicates of the experiment (n = 5) described in panel Di. (A-D) Each of the immunoblots contains 2 endogenous controls (GAPDH) marked by upper index, because for technical reasons, pIKK, TRAF4, pERK, and total ERK (+ loading control GAPDH1) were analyzed on first gel and tIKKα and tIKKβ (+ loading control GAPDH2) on the second gel (identical protein loading and conditions). In all experiments, the statistical difference was tested using a paired t test, and the error bars indicate SEM.
miR-29 targets TRAF4 involved in CD40-mediated NF-κB signaling. (Ai) Representative example of an immunoblot for MEC1 cells transfected with siRNA against TRAF4 (siRNA TRAF4) or negative control (siRNA NegCtrl). Seventy-two hours after transfection, the cells were stimulated with CD40L (1 µg/mL) for indicated period of time and harvested for analysis by immunoblotting. (Aii) Densitometric quantification of pIKKα/β levels for replicates of the experiment (n = 5) described in panel Ai. (Bi) Representative example of immunoblot of primary CLL cells transfected with siRNA against TRAF4 (siRNA TRAF4) or negative control (siRNA NegCtrl). Seventy-two hours after transfection, the cells were stimulated with CD40L (1 µg/mL) for indicated period of time and harvested for analysis by immunoblotting. (Bii) Densitometric quantification of pIKKα/β levels for replicates of the experiment (n = 6) described in panel Bi. (Ci) Representative example of immunoblot for MEC1 cells transfected with artificial miR-29c (miR-29 MIMIC) or negative control (miR MIMIC NegCtrl). Seventy-two hours after transfection, the cells were stimulated with CD40L (1 µg/mL) and harvested for analysis by immunoblotting. (Cii) Densitometric quantification of pIKKα/β levels for independent replicates of the experiment (n = 4) described in panel Ci. The error bars indicate the standard error of the mean. (Di) Representative example of immunoblot for primary CLL cells transfected with artificial miR-29c (miR-29 MIMIC) or negative control (miR MIMIC NegCtrl). Seventy-two hours after transfection, the cells were stimulated with CD40L (1 µg/mL) and harvested for analysis by immunobloting at the indicated time points. (Dii) Densitometric quantification of pIKKα/β levels for replicates of the experiment (n = 5) described in panel Di. (A-D) Each of the immunoblots contains 2 endogenous controls (GAPDH) marked by upper index, because for technical reasons, pIKK, TRAF4, pERK, and total ERK (+ loading control GAPDH1) were analyzed on first gel and tIKKα and tIKKβ (+ loading control GAPDH2) on the second gel (identical protein loading and conditions). In all experiments, the statistical difference was tested using a paired t test, and the error bars indicate SEM.
miR-29 is induced and TRAF4 repressed by BCR inhibitors
We observed that BCR activity in CLL represses miR-29, and we further examined the in vivo effects of BCR inhibitors on MYC (miR-29 repressor), miR-29s, and TRAF4 (miR-29 target) levels. In line with the data above, MYC expression was repressed, and all members of the miR-29 family were induced in CLL patients after several weeks on single-agent therapy with ibrutinib (Figure 6A-B). All patients in this analysis (supplemental Table 2) were responsive to therapy at the time of sampling and for a period of >1 year (with the exception of 1 patient with a relapse after 7 months). The TRAF4 mRNA and protein levels were clearly down-modulated during ibrutinib therapy (Figure 6C-D). Similar data were also obtained for patients treated with idelalisib as a single agent (Figure 6E-F; for patient’s characteristics, see supplemental Table 2) with the exception of 1 sample with TRAF4 upregulation during therapy. However, we were not able to identify any specific characteristics for this patient that would explain it (CLL 69 in supplemental Table 2; NOTCH1 mutated, TP53 wt, trisomy 12 [69%], ZAP70 [13%], IGHV V3-64); the patient responded well to idelalisib (achieved partial remission), and therapy was discontinued for reasons unrelated to CLL. CLL cells obtained directly from ibrutinib treated patients (n = 5) were clearly less responsive to CD40 ligation (lower IKKα/β phosphorylation) than paired samples obtained before therapy (Figure 6G). This suggests that by inducing miR-29s, BCR inhibitors suppress CD40 signaling/T-cell interactions, and this might at least partially explain the previously noted decreased CD40 signaling during ibrutinib/idelalisib treatment in vitro.56,57

miR-29 is upregulated and TRAF4 repressed during therapy with BCR inhibitors. (A) Normalized MYC expression in 16 CLL patients before (Pre Ibr) and during ibrutinib (Post Ibr) therapy (weeks 2-12 on therapy depending on the sample availability; for patient characteristics, see supplemental Table 2; CLL 44-46, 48-51, 54, 56-63). (B-C) Normalized expression of miR-29a/b/c in 15 CLL patients (B) or TRAF4 mRNA (C) in 16 CLL patients before (Pre Ibr) and during ibrutinib (Post Ibr) therapy (weeks 2-12 on therapy depending on sample availability, for patient characteristics, see supplemental Table 2; CLL 45-51, 54, 55, 57-60, 62-63 for panel B; CLL 44-46, 48-51, 54, 56-63 for panel C). (Di) Representative immunoblot of TRAF4 protein levels in 2 CLL patients before (Pre Ibr) and during ibrutinib therapy (CLL 48 and 50). (Dii) Densitometric quantification of TRAF4 protein levels analyzed by immunoblotting in all available CLL patients before (Pre Ibr) and during ibrutinib (Post Ibr) therapy (n = 13; weeks 2-12, n = 12; week 1, n = 1; for patient characteristics, see supplemental Table 2; CLL 44-53, 61-63). (E-F) Normalized expression of miR-29a/b/c (E) and TRAF4 (F) in 8 CLL patients before (Pre Idela) and during single agent idelalisib (Post Idela) therapy (weeks 5-6 of therapy depending on sample availability; for patient characteristics, see supplemental Table 2; CLL 64-71). The statistical differences for A to F were tested by Wilcoxon matched pairs test. (Gi) Representative immunoblot of pIKKα/β expression after stimulation with CD40L (1 µg/mL; 3 minutes) in 2 CLL patients before (Ibr −) and during ibrutinib (Ibr +) therapy in vivo (CLL 50 and 63). (Gii) Densitometric quantification of pIKKα/β levels for replicates of the experiment described in panel Gi (n = 5; week 4, n = 2; week 6, n = 1; week 12, n = 1; week 15, n = 1). CLL patients before (Pre) and during ibrutinib (Post Ibr) were analyzed (for patient characteristics, see supplemental Table 2; CLL 47, 50, 61-63). P value was tested by paired t test, and the error bars indicate SEM.
miR-29 is upregulated and TRAF4 repressed during therapy with BCR inhibitors. (A) Normalized MYC expression in 16 CLL patients before (Pre Ibr) and during ibrutinib (Post Ibr) therapy (weeks 2-12 on therapy depending on the sample availability; for patient characteristics, see supplemental Table 2; CLL 44-46, 48-51, 54, 56-63). (B-C) Normalized expression of miR-29a/b/c in 15 CLL patients (B) or TRAF4 mRNA (C) in 16 CLL patients before (Pre Ibr) and during ibrutinib (Post Ibr) therapy (weeks 2-12 on therapy depending on sample availability, for patient characteristics, see supplemental Table 2; CLL 45-51, 54, 55, 57-60, 62-63 for panel B; CLL 44-46, 48-51, 54, 56-63 for panel C). (Di) Representative immunoblot of TRAF4 protein levels in 2 CLL patients before (Pre Ibr) and during ibrutinib therapy (CLL 48 and 50). (Dii) Densitometric quantification of TRAF4 protein levels analyzed by immunoblotting in all available CLL patients before (Pre Ibr) and during ibrutinib (Post Ibr) therapy (n = 13; weeks 2-12, n = 12; week 1, n = 1; for patient characteristics, see supplemental Table 2; CLL 44-53, 61-63). (E-F) Normalized expression of miR-29a/b/c (E) and TRAF4 (F) in 8 CLL patients before (Pre Idela) and during single agent idelalisib (Post Idela) therapy (weeks 5-6 of therapy depending on sample availability; for patient characteristics, see supplemental Table 2; CLL 64-71). The statistical differences for A to F were tested by Wilcoxon matched pairs test. (Gi) Representative immunoblot of pIKKα/β expression after stimulation with CD40L (1 µg/mL; 3 minutes) in 2 CLL patients before (Ibr −) and during ibrutinib (Ibr +) therapy in vivo (CLL 50 and 63). (Gii) Densitometric quantification of pIKKα/β levels for replicates of the experiment described in panel Gi (n = 5; week 4, n = 2; week 6, n = 1; week 12, n = 1; week 15, n = 1). CLL patients before (Pre) and during ibrutinib (Post Ibr) were analyzed (for patient characteristics, see supplemental Table 2; CLL 47, 50, 61-63). P value was tested by paired t test, and the error bars indicate SEM.
Discussion
In this study, we identified miR-29 as being consistently down-modulated in the proliferative CXCR4dimCD5bright CLL cell subpopulation by BCR-induced MYC and identified miR-29’s novel target, TRAF4, as being upregulated in this context. We revealed that the higher TRAF4 levels determine an increased responsiveness to CD40 ligand. This demonstrates for the first time that miRNAs can act to coordinate malignant B-cell responsiveness to T-cell signals and facilitate the co-occurrence of BCR and CD40 signaling activation. Moreover, we showed that during therapy with BCR inhibitors, the miR-29 levels are upregulated, and this at least partially explains the impaired CD40 signaling in CLL cells during such therapy.
We performed the first miRNA expression profiling in the CXCR4/CD5 intraclonal CLL cell subpopulation to identify changes in miRNA expression in the immune microenvironment. We and others have previously suggested that the CXCR4dimCD5bright CLL cells correspond to the cells that have recently exited the lymph node niches,3-6 which can be used to study gene expression’s “fingerprint” in the microenvironment.3-5 In this analysis, we identified 36 differentially expressed miRNAs, including several that have previously been shown by us and others to modulate BCR signaling (such as miR-155, miR-150, and miR-22),18-20,58 but also other miRNAs with a potentially interesting role in microenvironmental interactions. We noticed that all 3 members of the miR-29 family (miR-29a/b/c) are consistently down-modulated (∼2-fold) in the CXCR4dimCD5bright CLL cells and in CLL lymph node samples. Additionally, the lower miR-29a/b/c levels associated with significantly shorter overall survival in CLL and unfavorable prognostic markers linked to BCR responsiveness such as unmutated IGHV and ZAP-70 expression. The expression of miR-29s was shown not to be related to p53 activity.40,59 This is in line with observations of others in CLL, mantle cell lymphoma, follicular lymphoma, and diffuse large B-cell lymphoma, where low levels associate with a more aggressive disease,31,32,48-50 and underscores the need to identify miR-29 targets. Moreover, miR-29a/b/c are the most frequently mutated miRNA genes in CLL, and such mutations lead to inefficient miR-29 biogenesis and its low levels.31,59
It has been shown that all miR-29 family members have an identical seed sequence determining binding to their target mRNAs. It has been suggested that low-level miR-29 expression supports CLL cell aggressiveness by upregulating the antiapoptotic proteins MCL1 and TCL1.32,46,47 However, as with many other miRNAs, these targets were identified based on a relatively biased preselection of potential miR-29 targets, which most likely leads to omission of some crucial miR targets in a given (patho)physiologic context.21,60 To address this, we performed whole transcriptome profiling in CXCR4/CD5 subpopulations searching for mRNAs that have anticorrelated expression levels to miR-29. This is a useful strategy for miRNA target identification because miRNAs typically destabilize their target mRNAs.19,21,22 Additionally, this approach obviated experiments using forced overexpression of the studied miRNA that can lead to shifts in target mRNAs and off-target effects.21,60,61 This approach allowed us to identify a novel miR-29 target in CLL, namely TRAF4, which was further validated by transfecting malignant B cells with synthetic miR-29, miR-29 inhibitor, and a luciferase assay proving a direct miR-29 binding to 3′UTR TRAF4 mRNA (at positions 161-167). Altogether, the low miR-29 levels in CLL immune niches allow for higher TRAF4 protein levels. TRAF4 regulation by miR-29 has also recently been reported in gliomas.62 We also confirmed that miR-29 affects MCL1 and TCL1 levels in CLL46,47 but to a lesser extent than it effects on TRAF4 levels.
We further studied TRAF4’s molecular function in CLL because this is unknown, and TRAF4 represents a relatively understudied member of the TRAF protein family. Several studies have suggested that other TRAF proteins (TRAF 1, 2, and 3) can contribute to CLL aggressiveness, including the development of a CLL-like disease in double TRAF1/BCL2 transgenic mice.63-65 In germinal center B cells, TRAF family members (TRAF1/2/3/5/6) act as major signal transducers for lymphocyte activation by Toll-like receptor, B-cell activating factor, and especially CD40.54,55,66 Notably, the Epstein-Barr virus recruits TRAFs to the cell membrane via Epstein-Barr virus–encoded LMP1 protein, and this provides a key proproliferative signal mimicking CD40 ligation in B cells.67-69 However, TRAF4’s function in CD40 signaling is debated because TRAF4 does not directly interact with CD40 but binds other TRAFs interacting with CD40 (such as TRAF2 and 6)70 and also binds directly to the cell membrane via phosphoinositide phosphates.71 Here, we showed for the first time that higher TRAF4 levels determine a higher sensitivity to CD40 ligation in CLL cells and subsequent phosphorylation of immediate downstream effectors in the NF-κB pathway, namely IKKα/β. Notably, TRAF4 overexpression enhanced B-cell responsiveness to CD40 ligation and rescued their transfection by synthetic miR-29. We also verified the role of the miR-29–TRAF4 axis on CD40 signaling during CLL–T-cell interactions by coculturing purified CLL cells transfected by synthetic miR-29 (vs negative control) with autologous activated T cells. We did not observe a role for TRAF4 levels in CLL cell responsiveness to Toll-like receptor activation by cytosine guanine dinucleotides (data not shown). However, we noticed that modulating TRAF4 levels affects basal ERK phosphorylation levels independently of receptor-ligand binding (the basal level of IKKα/β phosphorylation was not affected). This is in line with studies in nonlymphoid cells, suggesting that TRAF4 forms homodimers and contributes to AKT (also known as protein kinase B) and ERK activity by a yet unclear mechanism.71-74 Notably, higher TRAF4 levels associate with a shorter survival in CLL, and this was independent of 7 other routinely used prognostic markers in a multivariate analysis (P = .001; HR, 6.0; 95% CI, 2-17.9; supplemental Table 5). Altogether, these data indicate that the regulatory connection between miR-29 and TRAF4 is an important one for CLL–T-cell interactions and malignant B-cell behavior. The importance of T-cell interactions in CLL biology can be illustrated by the possibility of inducing CLL cell proliferation in vitro by providing T-cell factors such as CD40L,12-16,75 and T-cell interaction intensity contributes to the heterogeneity in disease aggressiveness.8-10 However, miRNA targets are known to be context dependent, and it is likely that miR-29 regulates other gene(s) that also contribute to B-cell biology and/or might be involved in the CD40 pathway. For example, it has been shown that in malignancies, such as mantle cell lymphoma or AML, the miR-29 targets CDK649 and DNA methyl-transferases,76 respectively.
We further showed that BCR activation leads to repression of miR-29s and a subsequent increase in TRAF4 levels. This is directly dependent on BCR-induced MYC activation in case of miR-29a and miR-29c, but not miR-29b, suggesting that other factors affect the processing and/or stability of miR-29b. The data suggest that BCR signaling acts to coordinate CLL cell responsiveness to the CD40 ligand provided by T cells by modulating miR-29-TRAF4 levels. This is in line with a recent observation in normal germinal center B cells, where concurrent synchronous activation of both BCR and CD40 is required to properly induce NF-κB activity, MYC levels, and entry of B cells into the cell cycle.77 This is also partially analogous to a reversed situation with miR-155, miR-150, and miR-22, which are regulated by CD40 or stromal interactions, and this subsequently increases BCR signaling propensity of CLL cells in immune niches.18-20,26,58
We also showed that the BCR inhibitors ibrutinib or idelalisib (as single agents) lead in vivo to miR-29 upregulation, whereas the target, TRAF4, is repressed. We also observed that CLL cells obtained from patients on ibrutinib therapy were clearly less responsive to CD40 ligation than paired samples obtained from the same patient before therapy. The impaired CD40 signaling has been previously noted in vitro ibrutinib treated cells,56,57 and CD40-regulated genes are known to be repressed during ibrutinib therapy in vivo.78 The effect of miR-29 on limiting CD40 signaling might have some interesting therapeutic implications. Recently, it has been proposed that synthetic miR-29 might be used as a therapeutic agent in CLL,79 and our data provide clues toward the effects of such a therapy. For example, an miR-29 mimic might potentially be efficiently combined with venetoclax, because CD40 signaling represents a major mechanism for resistance to BCL2 inhibitors,80 and miR-29 also targets the key antiapoptotic proteins MCL1 and TCL1.
In summary, we used integrated miRNA and mRNA profiling analysis in intraclonal CLL subpopulations to identify a novel target of miR-29 involved in T-cell interactions. Regulation of TRAF4 by miR-29 contributes to CD40 ligation sensitivity in CLL cells after BCR activation and associates with differences in disease prognosis. This represents an example of how miRNAs can modulate the competency of CLL–T-cell interactions (summarized in Figure 7).

Schematic overview of the role of miR-29–TRAF4 axis in regulation of CD40-induced NF-κB signaling. MYC upregulation by BCR signaling activation downregulates miR-29 expression in the immune niches. This allows for higher levels of its direct target TRAF4, which acts as a positive regulator of CD40 signaling. BCR signaling inhibitors (ibrutinib/idelalisib) inhibit the BCR-induced MYC levels leading to higher miR-29 levels and repression of TRAF4. miR-29 also targets antiapoptotic proteins MCL1 and TCL1.
Schematic overview of the role of miR-29–TRAF4 axis in regulation of CD40-induced NF-κB signaling. MYC upregulation by BCR signaling activation downregulates miR-29 expression in the immune niches. This allows for higher levels of its direct target TRAF4, which acts as a positive regulator of CD40 signaling. BCR signaling inhibitors (ibrutinib/idelalisib) inhibit the BCR-induced MYC levels leading to higher miR-29 levels and repression of TRAF4. miR-29 also targets antiapoptotic proteins MCL1 and TCL1.
The results of the miRNA/RNAseq analysis can be found in the data supplement. For the original data and detailed protocols, please contact the corresponding author at marek.mraz@email.cz.
The online version of this article contains a data supplement.
The publication costs of this article were defrayed in part by page charge payment. Therefore, and solely to indicate this fact, this article is hereby marked “advertisement” in accordance with 18 USC section 1734.
Acknowledgments
The authors acknowledge the Core Facility Genomics of Central European Institute of Technology, Masaryk University (CEITEC, MU) supported by the NCMG research infrastructure (LM2018132 funded by MEYS CR) for their help with NGS data.
This work was supported by Ministry of Health of the Czech Republic grant NV18-03-00054. All rights reserved. This project has received funding from the European Research Council (ERC) under the European Union’s Horizon 2020 research and innovation programme (grant agreement 802644). This work was also supported by the Czech Science Foundation (20-02566S) and Ministry of Education, Youth and Sports of the Czech Republic under project CEITEC 2020 (LQ1601) and MUNI/A/1395/2019.
Authorship
Contribution: S.S. performed experiments, analyzed data, and wrote the paper; G.M.P. and K.A.C. performed NGS experiments; V. Seda, E.V., L.O., V. Sandova, P.F.Z., M.B., D.F., and L. Kostalova performed experiments; K.L. and L. Kren performed IHC; J.O. analyzed NGS data; M.M. designed the study, interpreted data, and wrote the paper; and all authors provided samples and clinical data, interpreted data, and edited and approved the paper for submission.
Conflict-of-interest disclosure: The authors declare no competing financial interests.
Correspondence: Marek Mraz, Central European Institute of Technology, Masaryk University, Kamenice 5, 625 00 Brno, Czech Republic; e-mail: marek.mraz@email.cz.

This feature is available to Subscribers Only
Sign In or Create an Account Close Modal