

Key Points
Four ABO SNPs (rs2519093, rs1053878, rs8176743, rs41302905) must be studied in any work assessing the risk of ABO locus on VT.
Molecularly defined ABO blood groups are more accurate than serologically determined (A/B/O) groups for estimating risk of VT.

Abstract
Genetic risk score (GRS) analysis is a popular approach to derive individual risk prediction models for complex diseases. In venous thrombosis (VT), such type of analysis shall integrate information at the ABO blood group locus, which is one of the major susceptibility loci. However, there is no consensus about which single nucleotide polymorphisms (SNPs) must be investigated when properly assessing association between ABO locus and VT risk. Using comprehensive haplotype analyses of ABO blood group tagging SNPs in 5425 cases and 8445 controls from 6 studies, we demonstrate that using only rs8176719 (tagging O1) to correctly assess the impact of ABO locus on VT risk is suboptimal, because 5% of rs8176719-delG carriers do not have an increased risk of developing VT. Instead, we recommend the use of 4 SNPs, rs2519093 (tagging A1), rs1053878 (A2), rs8176743 (B), and rs41302905 (O2), when assessing the impact of ABO locus on VT risk to avoid any risk misestimation. Compared with the O1 haplotype, the A2 haplotype is associated with a modest increase in VT risk (odds ratio, ∼1.2), the A1 and B haplotypes are associated with an ∼1.8-fold increased risk, whereas the O2 haplotype tends to be slightly protective (odds ratio, ∼0.80). In addition, although the A1 and B blood groups are associated with increased von Willebrand factor and factor VIII plasma levels, only the A1 blood group is associated with ICAM levels, but in an opposite direction, leaving additional avenues to be explored to fully understand the spectrum of biological effects mediated by ABO locus on cardiovascular traits.
Introduction
The ABO blood groups are determined by the ABO locus located on chromosome 9 (9q34.1-q34.2) that codes for 2 glycosyltransferases (GTs), A and B; their roles are to transfer a saccharide unit to polypeptides and membrane glycolipids [ABO(H) carbohydrate structures]. ABO blood group was one of the first identified risk factor for venous thrombosis (VT),1 and its thrombotic effect is considered to be mediated by the ABO(H) structures, which are expressed on the glycans of factor VIII (FVIII) and von Willebrand factor (VWF),2 as well as by modulation of soluble ICAM-1, soluble P-selectin, and soluble E-selectin levels.3
Despite the robust association between the ABO locus and VT risk, there is a lack of consensus about the proper way to accurately estimate its impact on disease risk at the population or individual level. Although some investigators believe that individuals with A1 or B ABO blood groups are at an ∼1.5-fold increased risk for VT compared with individuals with O or A2 blood groups who have little or no A glycosyltransferase (AGT) activity,4-6 others investigators7-12 propose to contrast O and non-O blood groups without further granularity. Some have even proposed that, compared with O, the A2 blood group is associated with increased VT risk but to a lesser extent than A1 and B.13 Clarifying this association is required to provide more accurate risk predictions. Several explanations could be proposed to explain the aforementioned inconsistency, including standard epidemiological issues, such as population heterogeneity and limited sample size. However, another important aspect is that the ABO blood group can be phenotypically assessed using serological tests or genetically defined using single nucleotide polymorphisms (SNPs) at the ABO locus. From an evolutionary perspective, the ancestral ABO blood group is A1.14 The A2 blood group resulted from a proline to leucine substitution at amino acid 156 and is defined by the rs1053878-A allele. The O1 group that accounts for 95% of O group is the consequence of a frameshift deletion (c.del261G, p.88fs118Stop) and is defined by the rs8176719-delG allele, whereas the rs41302905-T allele (p.Arg268) corresponds to the O2 group.15 Finally, the B blood type resulted from a glycine to serine substitution at amino acid 235 and is defined by the rs8176743-T allele. These 4 SNPs define 5 main common haplotypes in European ancestry populations (Figure 1); as the ancestry allele, the A1 group is generally called when none of the above alleles is present. However, it has been proposed to be tagged by the rs579459-G allele (or any SNP in perfect linkage disequilibrium [LD] with it).6 The choice of studied SNPs and their groupings strongly influences the downstream association results. Indeed, because of complete negative LD between these SNPs (D′ = −1), the analysis of only a subset of these SNPs may introduce biases in the estimation of genetic association parameters. These biases can be even amplified when these ABO blood group SNPs are substituted by other SNPs expected to serve as good, but imperfect, proxies (0.8 < r2 < 1). For example, rs5146598 and rs6876219 have been used as proxies for rs8176719 (r2 ∼ 0.84 for both).
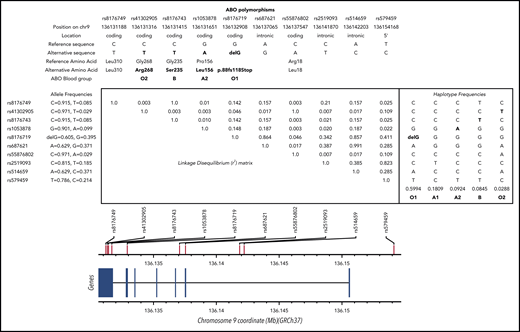
LD matrix and haplotype frequencies at the ABO locus. SNPs shown are discussed in the article (and in supplemental Data). Numerical values in the upper right triangle of the matrix are pairwise LD r2 values. Values for r2 and allele/haplotype frequencies were estimated from European populations available at https://ldlink.nci.nih.gov/?tab=ldmatrix.
LD matrix and haplotype frequencies at the ABO locus. SNPs shown are discussed in the article (and in supplemental Data). Numerical values in the upper right triangle of the matrix are pairwise LD r2 values. Values for r2 and allele/haplotype frequencies were estimated from European populations available at https://ldlink.nci.nih.gov/?tab=ldmatrix.
This study was initially designed to fine map the association between ABO haplotypes and VT risk, to identify the optimal set of SNPs needed to tag the VT-associated ABO haplotypes, and to address the clinical usefulness of using such optimal set in the context of genetic risk estimation. To achieve these aims, a series of haplotype association analyses, taking into account the LD between ABO SNPs, was undertaken in relation to AGT activity, VT risk, and quantitative cardiovascular traits whose interindividual variability was demonstrated to be strongly influenced by the ABO locus.
Methods
Selection of ABO SNPs
Six polymorphisms located at the ABO locus were selected for our series of haplotype association analyses: the 4 SNPs that characterize main ABO blood groups, as discussed in the Introduction (rs1053878, rs8176719, rs41302905, rs8176743); rs579459, which has been proposed to tag the ABO A1 blood group; and rs2519093, which has been proposed to be a genetic risk factor for VT independently of the ABO blood groups.16
Studies contributing to the association with VT risk
The association between ABO haplotypes and VT risk was investigated in 6 case-control/prospective studies of VT risk which have been previously typed for genome-wide genotyped data: the Cardiovascular Health Study (CHS), the Early Onset Venous Thrombosis study (EOVT), the Heart and Vascular Health (HVH), the Marseille Thrombosis Association study (MARTHA), the Multiple Environmental and Genetic Assessment of risk factors for venous thrombosis (MEGA) study, studies that were described by Germain et al,17 and the RETROVE study.18 Briefly, CHS is a United States population–based cohort of adults aged older than 65 years that recruited patients in 4 centers. HVH is a population-based case-control study of cardiovascular events that was conducted in Washington state. EOVT and MARTHA are 2 French case-control studies for VT, and MEGA and RETROVE are case-control studies from The Netherlands and Spain, respectively. A detailed description of each study is provided in supplemental Data (available on the Blood Web site). In total, 5425 VT cases and 8445 controls were assembled through these 6 studies.
Studies contributing to analyses of cardiovascular quantitative traits
ABO haplotypes were tested for their association with 4 quantitative traits that are well known to be modulated by ABO blood groups: (1) AGT activity was available for 213 VT patients from the MARTHA study19 ; (2) plasma levels of VWF were assessed in 13 527 individuals from 4 studies, including the Atherosclerosis Risk in Communities (ARIC) study,20 the Framingham Heart study,21 MARTHA, and RETROVE; (3) plasma levels of FVIII were assessed in 19 085 individuals from 5 studies, including ARIC, CHS, MARTHA, The Netherlands Epidemiology of Obesity study,22,23 and RETROVE; and (4) plasma levels of ICAM-1 were available for 22 639 participants in the Women's Genome Health Study.24
For these analyses on quantitative traits, only control data from RETROVE participants were used. By contrast, only data from VT patients were available in MARTHA. A detailed description of the study samples and the biological measurements are provided in supplemental Data.
Haplotype/diplotype association analyses
In all of these studies, haplotype association analyses were conducted using the haplo.stats R package25 or THESIAS software.26 From best-guessed genotypes obtained from imputed data, these 2 programs implement linear (for quantitative trait) and logistic (for disease status) regression models to estimate haplotype effects by comparison with a reference haplotype (taken here as the O1 haplotype) under the assumption of additive effects. Analyses were adjusted for cohort-specific covariates (supplemental Data).
Because of the very strong negative LD between studied ABO SNPs (D′ ∼ 1) and the resulting haplotype structure, it is possible to determine the pair of haplotypes (called diplotypes) carried by each individual with little ambiguity. The percentages of individuals without any ambiguous haplotypes/diplotypes were 0.995, 0.997, 0.989, 0.992, 0.999. and 0.996 in CHS, EOVT, HVH, MARTHA, MEGA, and RETROVE, respectively. Therefore, to remove the assumption of additivity in haplotype effects, we tested the association between ABO diplotypes and VT risk using a logistic regression model adjusted for the same covariates as for the haplotype analyses.
Haplotype/diplotype association results were meta-analyzed using a fixed-effects model based on the inverse-variance weighting, and the heterogeneity of associations across studies was assessed with the Cochran-Mantel-Haenszel test statistic.27
Genetic risk score and risk prediction analyses
Based on the haplotypic and diplotypic odds ratios (ORs) for VT derived from the meta-analyses of the 6 studies, 2 genetic risk scores (GRSs) were computed. A first GRS assuming additive effects of haplotypes (GRSh) is defined, for each individual i, as GRShi = log(ORhi1) + log(ORhi2), where (hi1,hi2) is the pair of haplotypes carried by individual i, and ORk is the haplotypic OR associated with haplotype k. A second GRS (GRSd), which does not assume additivity of haplotype effects, is defined from derived diplotypic ORs as GRSdi = log(ORhi1,hi2), where ORk,l is the OR for VT associated with the diplotype (k,l). We then assessed the discriminative properties of these GRSs by comparison with a simple GRS defined by the number of O1 alleles carried by an individual. GRSs were calculated in an independent sample of 18 595 VT cases and 92 983 randomly selected controls, frequently matched to cases by age at the baseline examination, from the UK Biobank (UKBB) cohort (supplemental Data). We used this independent sample to minimize the risk of overfitting when GRSs are evaluated in the cohorts from which they were derived. The association between GRS and VT risk was assessed using a logistic regression analysis, adjusting for sex, age at the time of VT event, grouped year at the time of VT event, and the 10 first principal components derived from genome-wide genotype data. Of note, the percentage of UKBB participants with unambiguous haplotypes/diplotypes was 0.992. GRSs were compared in terms of area under the curve (AUC), continuous net Reclassification Index, and integrated discrimination improvement (IDI). These metrics were calculated using the PredictABEL R program (https://cran.r-project.org/web/packages/PredictABEL/PredictABEL.pdf).
Results
As a first step, we assessed the association between ABO haplotypes and AGT activity, the main GT encoded by the A1 or A2 allele, keeping in mind that, by definition, AGT shall be quantified only in A1 or A2 carriers. As shown in Table 1, the 6 studied ABO SNPs generated 5 common haplotypes. The rs2519093-T, rs8176719-delG, rs1053878-A, rs8176743-T, and rs41302905-T alleles were each carried by a unique haplotype, whereas the rare C allele at rs579459 was carried by 2 distinct haplotypes. Two haplotypes demonstrated significantly increased AGT activity compared with the O1 tagging haplotype: the haplotype carrying the rs1053878-A allele (ie, A2) with a modest AGT increase (β = 1655.6 ± 708.36; P = .019) and the haplotype carrying the rs2519093-T allele associated with strong AGT modulation (β = 7983.2 ± 304.9; P = 4.5 × 10−150). By contrast, the haplotype carrying the rs579459-C allele and the rs41302905-T allele was not associated with AGT (P = .864). These observations demonstrate that (1) the rs579459-C allele generally used to tag the A1 blood type is an imperfect genetic marker for the ABO A1 blood group because it also captures O2 carriers and, in that case, is not associated with AGT and (2) the rs2519093 variant is a better marker of the A1 blood group.
Haplotype association analysis of ABO SNPs with A GT activity in 213 VT patients from the MARTHA cohort
| ABO blood group | rs2519093 | rs8176719 | rs579459 | rs1053878 | rs8176743 | rs41302905 | Haplotype frequencies | Haplotype additive effects (95% CI) |
|---|---|---|---|---|---|---|---|---|
| O1 | C | delG | T | G | C | C | 0.528 | Reference |
| O2 | C | G | C | G | C | T | 0.014 | β = −249.54 (−3115.8 to 2616.8); P = .864 |
| A1 | T | G | C | G | C | C | 0.357 | β = 7983.2 (7385.6-8580.8); P = 4.5 × 10−150 |
| A2 | C | G | T | A | C | C | 0.046 | β = 1655.6 (267.2-3044.0); P = .019 |
| B | C | G | T | G | T | C | 0.033 | β = −239.2 (−1475.0 to 996.6); P = .704 |
The analysis was conducted using THESIAS and adjusted for age, sex, and the first 4 principal components. Minor alleles are shown in bold.
We then assessed the association between ABO haplotypes and VT risk. Detailed haplotype association results for VT obtained in each participating study are provided in supplemental Tables 1-6. A Forest plot reporting the haplotypic ORs in each individual study is shown in Figure 2. Results indicate that, compared with the O1 haplotype, the rs2519093-T and rs8176743-T alleles were associated with an increased risk for VT (OR, 1.78; 95% confidence interval [CI], 1.67-1.92; P = 3.15 × 10−60 and OR, 1.76; 95% CI, 1.58-1.96; P = 1.88 × 10⁻²⁴, respectively), with little heterogeneity across studies (P = .136 and P = .018, respectively). The rs1053878-A allele (A2 allele) also showed a trend toward a moderate increased risk for VT (OR, 1.16; 95% CI, 1.03-1.31; P = .013 (P = 0.738 for heterogeneity) (Figure 2; Table 2). Interestingly, the A2-associated OR for VT was significantly (P = 3.25 × 10⁻¹⁰) lower than the common OR (OR, 1.78; 95% CI, 1.68-1.88) associated with the rs2519093-T and rs8176743-T alleles. Of note, of the 2 haplotypes carrying the rs579459-C allele, the 1 that also carries the rs2519093-T (A1) allele is associated with increased VT risk. By contrast, the second haplotype, which is also the sole haplotype carrying the rs41302905-T allele coding for O2, was associated with a decreased risk for VT (OR, 0.70; 95% CI, 0.57-0.86; P = 7.75 × 10⁻⁴) but with some evidence of statistical (P = .001) heterogeneity across studies.
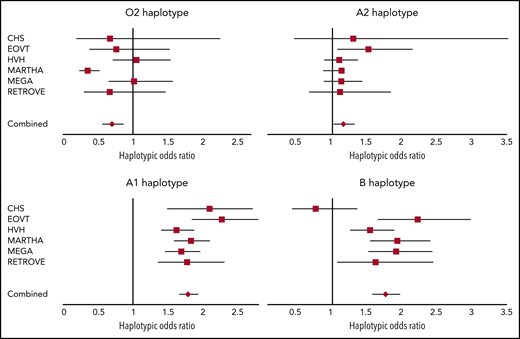
Forest plots showing the association between ABO haplotypes and VT risk. The figure shows the haplotypic OR for VT associated with the O2, A1, A2, and B haplotypes compared with the O1 haplotype taken as reference. ORs were computed under the assumption of haplotype effect additivity.
Forest plots showing the association between ABO haplotypes and VT risk. The figure shows the haplotypic OR for VT associated with the O2, A1, A2, and B haplotypes compared with the O1 haplotype taken as reference. ORs were computed under the assumption of haplotype effect additivity.
Summary data for the association between ABO haplotypes and studied traits
| ABO blood group | rs2519093 | rs8176719 | rs579459 | rs1053878 | rs8176743 | rs41302905 | Frequency* | OR for VT† | Impact on VWF/FVIII levels‡ | Impact on ICAM1 levels‡ |
|---|---|---|---|---|---|---|---|---|---|---|
| O1 | C | delG | T | G | C | C | 0.63 | Reference | Reference | Reference |
| O2 | C | G | C | G | C | T | 0.02 | 0.70§ (0.57-0.86) | — | — |
| A1 | T | G | C | G | C | C | 0.20 | 1.78 (1.67-1.92) | ↑↑↑ | ↓↓↓ |
| A2 | C | G | T | A | C | C | 0.07 | 1.16 (1.03-1.31) | ↑ | ↓ |
| B | C | G | T | G | T | C | 0.08 | 1.76 (1.58-1.96) | ↑↑↑ | — |
Minor alleles are shown in bold.
no effect of a given haplotype on the studied trait.
Haplotype frequencies in European ancestry populations.
Haplotypic risk estimate (95% CI) for VT obtained from the meta-analysis of results listed in supplemental Tables 1-6.
Direction (↑= increase; ↓= decrease) of haplotype effects on plasma levels. Strong vs modest effects are illustrated by 3 arrows vs 1 arrow.
This risk estimate exhibited statistical heterogeneity (P = 1.2 × 10⁻³) across the 6 investigated studies.
The association between ABO diplotypes and VT is illustrated in Figure 3, where meta-analyses from the 6 contributing studies are shown. Diplotype association results per study are given in supplemental Table 7. Compared with the O1O1 diplotype, diplotype ORs ranged from 0.81 (95% CI, 0.60-1.09; P = .166) for the O1O2 diplotype to 3.45 (95% CI, 1.88-6.32; P = 5.91 × 10⁻⁵) for the BO2 diplotype. This analysis illustrates the variability of risk estimates within a given serological group. For example, diplotype risk estimates were significantly different (P = .002) across individuals from the same A serological group (A1A1: OR, 2.98; 95% CI, 2.50-3.57; A1A2: OR, 2.65; 95% CI, 2.10-3.33; A1O1: OR, 2.12; 95% CI, 1.92- 2.35; and A1O2: OR, 1.68; 95% CI, 1.17-2.41).
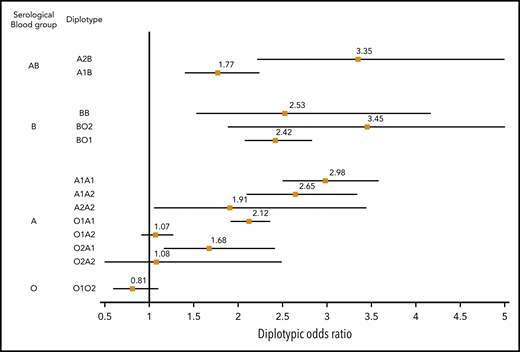
Forest plot showing the association between ABO diplotypes and VT risk. The O1O1 diplotype was used as reference. Diplotypic ORs were obtained from the meta-analysis of results observed in each of the 6 contributing studies (supplemental Table 7).
Forest plot showing the association between ABO diplotypes and VT risk. The O1O1 diplotype was used as reference. Diplotypic ORs were obtained from the meta-analysis of results observed in each of the 6 contributing studies (supplemental Table 7).
From Table 2, it can be deduced that ∼19% (0.07/0.37) of non-O1 individuals are A2 individuals at moderate risk for VT (OR, ∼1.2), ∼76% are individuals with A1 or B blood type at significantly greater risk for VT (OR, ∼1.8), and the remaining 5% with O2 blood type are not exposed to a greater risk for disease. These observations suggest that the sole use of O1-tagging rs8176719 to estimate the individual risk of VT associated with ABO blood groups may lead to risk misclassification. To further assess whether integrating haplotype/diplotype ABO information could be more clinically relevant than using the sole information on O1 polymorphism, we used the independent sample from UKBB to evaluate the AUC of 3 GRSs: GRSh defined from haplotype effect estimates reported in Table 2, GRSd defined from diplotype effect estimates reported in Figure 3, and GRSO1 defined by the number of O1 alleles carried by individuals. Corresponding AUCs were 0.561 (95% CI, 0.557-0.566), 0.559 (95% CI, 0.555-0.564), and 0.553 (95% CI, 0.548-0.558), respectively. GRSh- and GRSd-associated AUCs were significantly higher (P = 1.01 × 10⁻⁹ and P = 1.31 × 10⁻⁵, respectively) than the AUC obtained using only the O1 polymorphism, but the improvement remains modest. Similarly, the IDIs associated with GRSh and GRSd compared with GRSO1 were significantly different from 0 (P < 10−10) but weak (IDI = 0.2% for both). The net Reclassification Index associated with GRSh was also modest (0.023; 95% CI, 0.011- 0.035; P = 1.7 × 10⁻⁴).
As a final step, we investigated how these observations extend to plasma levels of VWF (supplemental Tables 8-11), FVIII (supplemental Tables 12-16), and ICAM (supplemental Table 17). First, in all studied samples, the same 5 common haplotypes were derived from the 6 studied SNPs. In all investigated studies, the effect of the O2 allele on the studied phenotypes was not significantly different from that of the most frequent haplotype tagging the O1 blood group. Furthermore, both haplotypes carrying the rs2519093-T (A1) or rs8176743-T (B) allele were homogeneously associated with substantially increased VWF and FVIII levels; the rs1053878-A (A2) allele was also associated with increased VWF and FVIII levels but to a more modest degree. These results are completely in line with those observed for VT risk. Interestingly, the haplotypes tagging for the A1 or A2 blood group, but not the B group, were associated with ICAM-1 levels but in an opposite direction from that observed for their associations with VWF and FVIII levels (Table 2; supplemental Table 17).
Discussion
This work begins with the first haplotype analysis of ABO SNPs in relation to AGT activity. The modest sample size of this analysis was counterbalanced by the nature of the studied trait, AGT activity being the most proximal biological trait influenced by the ABO locus, and by the strength of the association between ABO haplotypes and AGT activity. ABO haplotypes explained ∼80% of the variability in AGT activity, which was primarily due to the A1 haplotype being associated with extremely increased AGT and, to a lesser extent, the A2 haplotype being associated with a modest increase in AGT activity. Very interestingly, this haplotype analysis demonstrates that the rs579459 allele, which is often used to tag the A1 blood group, is an imperfect marker of the phenotypic A1 blood group. Indeed, ∼10% (∼0.02/0.22) of rs579459-C allele carriers are, in fact, O2 carriers and have AGT activity similar to the O1 blood group. By contrast, our analyses demonstrated that rs2519093, which was initially believed to be an independent ABO blood group polymorphism contributing to VT risk,16 appears to be an optimal tag for the A1 group because it uniquely defines the haplotype associated with the highest AGT levels.
Capitalizing on 6 independent studies for VT risk including 5425 VT cases and 8445 controls, we then performed the first haplotype and diplotype analyses of ABO SNPs with VT. The haplotype analysis demonstrated that A1- and B-tagging haplotypes are at a similar risk for VT (OR ∼ 1.8) and that the A2 haplotype is also associated, but more modestly (OR ∼ 1.2), with increased VT risk; the latter observation corroborated recent findings by Vasan et al.13 The diplotype analysis suggested that there is substantial variability in disease risk among individuals who would have been assigned the same serological ABO phenotype (O/A/B/AB), providing support for defining the ABO blood group using genetic markers. This work also demonstrates that using only the ABO O1-tagging rs8176719 allele to address the contribution of the ABO locus to VT risk, as it has been proposed, is suboptimal. Indeed, ∼76% of non-O1 carriers are at higher risk (OR ∼ 1.8) for VT, ∼19% are at moderate risk (OR ∼ 1.2), and ∼5% have no risk. However, we showed in an independent sample of 18 595 cases and 92 983 noncases that a GRS based on ABO haplotypes adds marginal information compared with a GRS defined from the sole rs8176719 allele. This work is not aimed at encouraging the use of ABO information in clinical practice, especially because the use of other VT-associated SNPs with stronger effects (such as FV Leiden) is still debated28,29 ; rather, it emphasizes the need to study haplotypes instead of only 1 SNP when assessing the impact of ABO locus on VT risk.
Finally, beyond these results pertaining to VT risk, we performed additional haplotype analyses on endothelial biomarkers that revealed some intriguing findings. The most likely hypothesis that is generally put forward to explain the relationship between VT and ABO is that, by modifying GT expression, ABO participates in controlling the degree of VWF glycosylation and, consequently, its clearance and/or cleavage by ADAMTS13.30,31 This would explain the robust association found between the ABO blood group and circulating concentrations of VWF32 and FVIII, of which VWF is the transport protein. However, the effect of the ABO locus on VT risk cannot be explained solely by a VWF-dependent mechanism. Indeed, it has been shown that the association between the ABO blood group and VT persists after adjusting for FVIII or VWF levels.12 Although the pattern of the association between ABO haplotypes and VWF/FVIII parallels that observed with VT risk, our work provides strong evidence that A1- and A2-tagging haplotypes, but not the B-tagging haplotype, are associated with plasma levels of ICAM-1. Additionally, the directions of haplotype effects are opposite from those observed for VWF and FVIII, because A carriers displayed lower ICAM-1 levels. Unfortunately, VWF and FVIII levels were not available in participants measured for ICAM-1, which prevented us from conducting in-depth joint analyses of these biomarkers. Further work is needed to clarify this point, as well as to assess whether this phenomenon also holds for other endothelial biomarkers (eg, P-selectin, E-selectin) and cardiovascular diseases (eg, coronary artery disease, stroke) with an ABO-dependent component.
Additional limitations must be discussed. Our association analyses were conducted using imputed genotypes. Even if all studied SNPs were imputed with high accuracy (imputation r2 > 0.93 in all studies for all SNPs), we cannot exclude that this introduced some extra variability in the estimated haplotype frequencies and the corresponding haplotype/diplotype effects. In addition, built upon data from genome-wide association studies, this work focused on common ABO SNPs and common ABO blood groups. As a consequence, very rare ABO blood groups, such as A3 and O3, were not addressed here. These rare groups are molecularly defined by extremely rare coding variations (https://www.presentica.com/doc/10230663/names-for-abo-isbt-001-blood-group-alleles-pdf-document) that would be investigated more efficiently using sequencing strategies. All of the analyses reported in this work were performed in individuals of European ancestry, in whom ABO blood group–tagging SNPs are in complete negative LD and the rs8176719-delG allele tagging O1 is only carried by 1 haplotype. It would be very interesting to perform similar investigations in other populations in which LD may not be so complete. For instance, the rs8176719-delG allele is found on 4 haplotypes in African populations (https://ldlink.nci.nih.gov/?tab=ldhap). In such a case, the impact of using haplotypes, rather than rs8176719 alone, in estimating disease risk may be even greater than that observed in this study in Europeans. The GRS proposed in this work was evaluated in an independent sample of the UKBB population whose specific design (including inclusion/exclusion criteria) differs from that of the derivation cohorts and may have had an impact on GRS properties. In addition, assessment of the proposed haplotype/diplotype GRS in high-risk populations (including cancer patients or women taking oral contraceptives) warrants further investigation.
In summary, common ABO haplotypes and diplotypes are associated with different VT risks. Four common SNPs, rs2519093, rs1053878, rs8176743, and rs41302905, should be analyzed in any study aimed at accurately estimating the risk of VT attributable to the ABO locus.
Data sharing requests should be sent to David-Alexandre Trégouët (david-alexandre.tregouet@u-bordeaux.fr) or Pierre-Emmanuel Morange (pierre.morange@ap-hm.fr).
The online version of this article contains a data supplement.
The publication costs of this article were defrayed in part by page charge payment. Therefore, and solely to indicate this fact, this article is hereby marked “advertisement” in accordance with 18 USC section 1734.
Acknowledgments
The authors thank the staff and participants of the Atherosclerosis Risk in Communities (ARIC) study for their important contributions.
M.S.-L. is supported by a Miguel Servet contract from the National Institute of Health Carlos III (ISCIII) Spanish Health Institute (CP17/00142) and cofinanced by the European Social Fund. D.-A.T. is supported, in part, by the EPIDEMIOM-VT Senior Chair from the University of Bordeaux initiative of excellence Initiative d'Excellence. F.T. was supported in part by the Génomique Médicale (GENMED) Laboratory of Excellence on Medical Genomics, Agence Nationale de la Recherche (ANR-10-LABX-0013). P.S.d.V. was supported by American Heart Association grant 18CDA34110116. F.T. and A.J. were supported by National Institutes of Health (NIH)/National Heart, Lung, and Blood Institute (NHLBI) Intramural funds. The International Network Against Venous Thrombosis (INVENT) Consortium and the Cohorts for Heart and Aging Research in Genomic Epidemiology (CHARGE) Working Group were funded, in part, by NIH/NHLBI grant HL134894. The MARTHA genetic study was supported by the GENMED Laboratory of Excellence on Medical Genomics, Agence Nationale de la Recherche (ANR-10-LABX-0013). Measurement of Glycosyltransferase A activity was supported by Etablissement Français du Sang, France (APR-2014-17). The ARIC study was funded in whole, or in part, with federal funds from the US Department of Health and Human Services, NIH/NHLBI (grants HHSN268201700001I, HHSN268201700002I, HHSN268201700003I, HHSN268201700004I, and HHSN268201700005I); NIH/NHLBI grants R01HL087641, R01HL059367, and R01HL086694; NIH/National Human Genome Research Institute grant U01HG004402; and NIH contract HHSN268200625226C. The Cardiovascular Health Study (CHS) was supported by NIH/NHLBI grants HHSN268201200036C, HHSN268200800007C, HHSN268201800001C, N01HC55222, N01HC85079, N01HC85080, N01HC85081, N01HC85082, N01HC85083, N01HC85086, U01HL080295, R01HL087652, R01HL105756, R01HL103612, R01HL120393, and U01HL130114, with additional contribution from the NIH/National Institute of Neurological Disorders and Stroke. Additional support was provided through grant R01AG023629 from the NIH/National Institute on Aging. A full list of principal CHS investigators and institutions can be found at CHS-NHLBI.org. The provision of genotyping data was supported, in part, by the National Center for Advancing Translational Sciences, Clinical and Translational Science Institute (CTSI) grant UL1TR001881, and NIH/National Institute of Diabetes and Digestive and Kidney Diseases Diabetes Research Center grant DK063491 to the Southern California Diabetes Endocrinology Research Center. The Framingham Heart Study was supported by NIH/NHLBI contracts NO1-HL 25195 and HHSN268201500001I. Infrastructure was supported in part by grant UL1RR025005, a component of the NIH and NIH Roadmap for Medical Research. The Heart and Vascular Health (HVH) study was funded in part by NIH/NHLBI grants HL40628, HL43201, HL53375, HL60739, HL68639, HL68986, HL73410, HL74745, HL85251, HL95080, and HL134894. The RETROVE study was supported by grants PI 12/612, PI 15/269, and PI 18/434 from the ISCIII Spanish Health Institute. The UK Biobank (UKBB) has received funding from the UK Medical Research Council, Wellcome Trust, UK Department of Health, British Heart Foundation, Cancer Research UK, Diabetes UK, Northwest Regional Development Agency, Scottish Government, and Welsh Assembly Government. This research was conducted using the UKBB resource under application 40713.
The content is solely the responsibility of the authors and the views expressed in this manuscript are those of the authors and do not necessarily represent the views of the NHLBI, the NIH, or the US Department of Health and Human Services.
Authorship
Contribution: Genotype and phenotype data were collected/produced by M.R.B., A.v.H.V., J.-C.S., J.-M.S., M.I.-K., N.S., D.D., R.O., P.A., S.D., A.B., P.B., A.C.M., D.O.M.-K., J.-F.D., A.J., P.S.d.V., J.C., N.L.S., F.R.R., D.I.C., P.-E.M.; L.G., F.T., K.L.W., R.L.-G., P.S.d.V., M.S.-L., D.I.C., and D.-A.T. performed statistical analyses; the general scientific project was designed by D.-A.T. and P.-E.M.; and the manuscript was drafted by L.G., D.-A.T., and P.-E.M. and further completed by P.S.d.V., M.S.-L., D.I.C., N.L.S., A.J., J.C., and P.B.
Conflict-of-interest disclosure: D.O.M.-K. is a part-time clinical research consultant for Metabolon, Inc. The remaining authors declare no competing financial interests.
Correspondence: David-Alexandre Trégouët, INSERM U1219, VINTAGE, Case 11, Bordeaux Population Health Research Center, 146 Rue Léo Saignat, 33076 Bordeaux, France; e-mail: david-alexandre.tregouet@u-bordeaux.fr; and Pierre-Emmanuel Morange: Service d'Hématologie Biologique, Hôpital de la Timone, 264 Rue Saint Pierre, 13005 Marseille, France; e-mail: pierre.morange@ap-hm.fr.

This feature is available to Subscribers Only
Sign In or Create an Account Close Modal