

Key Points
Obinutuzumab does not provide significant additional tumor control in newly diagnosed transplant-eligible DLBCL compared with rituximab.
Interim PET staging enables accurate monitoring and could be considered for use in routine practice of patients with advanced DLBCL.

Abstract
Rituximab plus polychemotherapy is the standard of care in diffuse large B-cell lymphoma (DLBCL). GAINED, a randomized phase 3 trial, compared obinutuzumab to rituximab. Transplant-eligible patients (18-60 years) with an untreated age-adjusted International Prognostic Index (aaIPI) score ≥1 DLBCL were randomized (1:1) between obinutuzumab or rituximab and stratified by aaIPI (1; 2-3) and chemotherapy regimen (doxorubicin, cyclophosphamide, prednisone plus vindesine, bleomycin [ACVBP] or vincristine [CHOP]). Consolidation treatment was determined according to response to interim positron emission tomography (PET). Responders after cycle 2 and 4 (PET2−/PET4−) received immunochemotherapy. Responders after only cycle 4 (PET2+/4−) received transplantation. The primary objective was an 8% improvement (hazard ratio [HR] = 0.73; 80% power; α risk, 2.5%; 1-sided) in 2-year event-free survival (EFS) in the obinutuzumab arm. From September 2012, 670 patients were enrolled (obinutuzumab, n = 336; rituximab, n = 334). A total of 383 (57.2%) were aaIPI 2-3, 339 (50.6%) received CHOP. Median follow-up was 38.7 months. The 2-year EFS was similar in both groups (59.8% vs 56.6%; P = .123; HR = 0.88). The 2-year PFS in the whole cohort was 83.1% (95% confidence interval, 80% to 85.8%). PET2−/4− and PET2+/4− had similar 2-year progression-free survival (PFS) and overall survival (OS): 89.9% vs 83.9% and 94.8% vs 92.8%. The 2-year PFS and OS for PET4+ patients were 62% and 83.1%. Grade 3-5 infections were more frequent in the obinutuzumab arm (21% vs 12%). Obinutuzumab is not superior to rituximab in aaIPI ≥1 DLBCL transplant-eligible patients. This trial was registered at www.clinicaltrials.gov as #NCT01659099.
Introduction
A polychemotherapy regimen (such as cyclophosphamide, doxorubicin, vincristine, and prednisone [CHOP] or doxorubicin, cyclophosphamide, vindesine, bleomycin, and prednisone [ACVBP]) plus rituximab is a standard of care in diffuse large B-cell lymphoma (DLBCL).1-5 Obinutuzumab is a glycoengineered type II anti-CD20 monoclonal antibody designed to enhance antibody-dependent cell-mediated cytotoxicity as compared with rituximab. Indeed, the addition of obinutuzumab to induction chemotherapy may provide a better disease control compared with rituximab plus chemotherapy in previously untreated DLBCL patients presenting with risk factors at diagnosis (age-adjusted International Prognostic Index [aaIPI] ≥1).
Selected young patients with adverse prognostic factors plus insufficient response after induction treatment might benefit from a consolidation treatment6-8 such as autologous stem cell transplantation (ASCT). Interim positron emission tomography (PET) analysis using a semiquantitative approach (so-called percentage change in maximum standardized uptake value [ΔSUVmax]) might help to earlier identify patients for whom ASCT could improve disease control.9-12
The aim of the GAINED trial is to compare obinutuzumab to rituximab when combined with an intensified chemotherapy regimen delivered every 14 days (ACVBP-14 or CHOP-14) followed by a PET-driven consolidation in untreated patients <60 years with advanced DLBCL.
Methods
Study design and participants
This open-label, multicenter randomized phase 3 study was designed by the Lymphoma Study Association (LYSA) and conducted in 99 centers in Belgium and France. Eligible patients were 18 to 60 years old with newly diagnosed untreated histologically proven CD20+ DLBCL (2008 World Health Organization [WHO] classification), aaIPI ≥1, at least 1 hypermetabolic lesion at baseline PET, eligibility for ASCT, and those who had a life expectancy of ≥3 months. Patients not previously diagnosed with indolent lymphoma and presenting a DLBCL with small cell infiltration in bone marrow (BM) or lymph node at diagnosis were also eligible. Patients were required to have normal liver, renal, and hematological functions unless abnormalities were related to DLBCL. Patients with altered cardiac function or uncontrolled diabetes mellitus interfering with normal application of protocol treatment were not eligible for inclusion. Patients presenting a central nervous system involvement at diagnosis were excluded. The study was approved by the French and Belgian Health authorities, the Ouest VI (Brest, France) Ethics Committee, and the institutional review boards in Belgium, and was performed in accordance with the Declaration of Helsinki and Guidelines for Good Clinical Practice. Patients provided written informed consent.
Procedures
Patients were enrolled by center with the Lymphoma Academic Research Organisation (LYSARC) e-Rando system and randomly assigned 1:1 to receive either rituximab or obinutuzumab. Randomization was done centrally with the permuted block method and stratified according to chemotherapy (CHOP vs ACVBP) and aaIPI (1 vs 2-3). The randomization list was generated by LYSARC. Patients and investigators were not masked as to treatment allocation.
Study design is shown in Figure 1. Treatment was divided in 2 phases: induction and consolidation. Induction consisted of 4 courses of CHOP or ACVBP delivered every 14 days. At its opening, each center was asked to choose either CHOP or ACVBP, and all patients included in the center were treated with the same chemotherapy regimen. All chemotherapy regimens are detailed in the full version of the protocol (see “Rationale” in the supplemental Appendix, available on the Blood Web site). In addition to CHOP or ACVBP, patients received obinutuzumab (O-CHOP or O-ACVBP) or rituximab (R-CHOP or R-ACVBP) according to randomization. Rituximab (375 mg/m2) and obinutuzumab (1 g flat dose) were infused at day 1 of each cycle, except for cycle 1 where 1 infusion of obinutuzumab (1 g flat dose) was given at day 8. Prophylaxis for central nervous system involvement included 15 mg of methotrexate intrathecally at day 1 of the first 4 cycles.
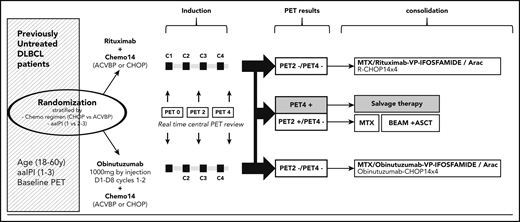
Study design. ACVBP, doxorubicin (75 mg/m2 at day 1), prednisone (60 mg/m2 day 1 to day 5), cyclophosphamide (1200 mg/m2 at day 1), vindesine (2 mg/m2 at days 1 and 5) and bleomycin (10 mg at days 1 and 5); BEAM, carmustine 300 mg/m2 at day −6; etoposide 200 mg/m2 from days −6 to −3; cytarabine 200 mg/m2 every 12 hours from days −6 to −3; melphalan 140 mg/m2 at day −2; C, cycle; CHOP, cyclophosphamide (750 mg/m2 at day 1), doxorubicin (50 mg/m2 at day 1), vincristine (1.4 mg/m2, maximum 2 mg, at day 1), and prednisone (40 mg/m2 day 1 to day 5); MTX, methotrexate.
Study design. ACVBP, doxorubicin (75 mg/m2 at day 1), prednisone (60 mg/m2 day 1 to day 5), cyclophosphamide (1200 mg/m2 at day 1), vindesine (2 mg/m2 at days 1 and 5) and bleomycin (10 mg at days 1 and 5); BEAM, carmustine 300 mg/m2 at day −6; etoposide 200 mg/m2 from days −6 to −3; cytarabine 200 mg/m2 every 12 hours from days −6 to −3; melphalan 140 mg/m2 at day −2; C, cycle; CHOP, cyclophosphamide (750 mg/m2 at day 1), doxorubicin (50 mg/m2 at day 1), vincristine (1.4 mg/m2, maximum 2 mg, at day 1), and prednisone (40 mg/m2 day 1 to day 5); MTX, methotrexate.
Responses during induction were assessed by PET. All eligible patients had a baseline PET scan (PET0). PET2 was scheduled 2 weeks after the second cycle and PET4 was scheduled 2 weeks after completion of induction chemotherapy (4 cycles). Patients were scanned on the same camera for all PET scans. Whole-body acquisition from groin to head was started within 60 ± 10 minutes of injection of 5 MBq/kg 18F-fluorodeoxyglucose. Interpretations of PET2 and PET4 were based on the ΔSUVmax method. PET images were sent through a Web platform and masked for independent central review by 4 expert reviewers (E.I., A.B.-R., F.K.-B., C.B.-M.). ΔSUVmax was calculated as: ΔSUVmax = 100 × [(SUVmaxPET0 − SUVmaxPETX)/SUVmaxPET0] as previously described.9-11 For PET2, the ΔSUVmax cutoff was 66% (PET2 is considered as negative if ΔSUVmax >66% and positive if ≤66%).9 For PET4, the ΔSUVmax cutoff was 70% (PET4 is considered as negative if ΔSUVmax >70% and positive if ≤70%). The Deauville 5-point scale, with grades 1, 2, 3 classified as negative and grades 4, 5 classified as positive, was used for patients whose PET0 SUVmax was <10, or interim with SUVmax >5 and ΔSUVmax >66% for PET2 or ΔSUVmax >70% for PET4. This was recommended by the 2011 Menton workshop.13 The centrally reviewed PET results were then sent back to the investigators, together with the per-protocol recommended consolidation treatment allocation for all patients.
The consolidation phase was adapted to PET2 and 4 results. Patients in response after cycle 2 (ΔSUVmax <66%) and 4 (ΔSUVmax <70%) (PET2−/4−) received consolidation therapy. For patients treated with CHOP, this consisted of 4 courses of O- or R-CHOP. For patients treated by O- or R-ACVBP, this consisted of 2 cycles of high-dose methotrexate (3 g/m2) every 14 days followed by 4 cycles of ifosfamide (1.5 g/m2 at day 1) plus etoposide (300 mg/m2 at day 1) every 14 days, and 2 cycles of subcutaneous cytarabine (100 mg/m2 for 4 days) delivered every 14 days. Patients received obinutuzumab or rituximab according to initial randomization. Patients in response after cycle 4 but not after cycle 2 (PET2+/4) received 2 courses of high-dose methotrexate (3 g/m2) every 14 days followed by ASCT. The conditioning regimen for ASCT was carmustine plus etoposide plus cytarabine plus melphalan (BEAM; see “Treatment schedule and design of the protocol” in the supplemental Appendix). The collection of peripheral blood stem cell progenitors was organized after induction cycle 3 or 4 for PET2+ patients. The target dose of collected CD34+ cells was 3 × 10⁶ cells per kilogram. Patients who did not reach response after cycle 4 and, regardless of response after cycle 2 (PET4+), were classified as nonresponders and salvage therapy was considered at the discretion of the local investigator.
In addition to PET, the following assessments were also mandatory: computed tomography scan at diagnosis and after 4 cycles of chemotherapy, at the end of treatment, and every 6 months until the end of follow-up; BM biopsy at baseline to confirm complete remission in patients with positive BM at baseline; and hematological laboratory assessments at inclusion and before each cycle of chemotherapy. All diagnoses were performed by local pathologists and centrally reviewed by 2 LYSA-pathology experts. The cell of origin (COO) of DLBCL was analyzed by Nanostring technology and according to the Hans algorithm.
Trial treatments were stopped in the following cases: lymphoma progression, toxic effects from study treatment, concomitant illness or protocol violations that precluded continuation, start of a new treatment of lymphoma, consent withdrawal, or refusal to continue treatment
Adverse events (AEs) were assessed after each cycle of chemotherapy and graded according to the National Cancer Institute Common Terminology Criteria for Adverse Events, version 4.0, and treatment-related toxicities were reported by study group.
Outcomes
The primary end point was the 2-year event-free survival (EFS). EFS was defined as the time from randomization to PET positivity (according to ΔSUVmax criteria after cycle 2 or 4 based on central PET review), progression or relapse (according to Cheson 2007 criteria), modification of planned treatment nonrelated to progression (including radiotherapy), or death of any cause. For patients who were not PET+ after cycle 2 or 4, or who had not progressed, relapsed, or received a new antilymphoma treatment nonrelated to progression and were alive at the time of analysis, EFS was censored at the date of last disease assessment. The key secondary end points were safety, early metabolic response according to PET after cycles 2 and 4, overall response rate, and best overall response rate after 4 cycles and end of treatment according to Cheson 2007 and 1999 criteria, duration of response (DOR), progression-free survival (PFS), and overall survival (OS).
Statistical analysis
We assessed the efficacy of obinutuzumab compared with rituximab in terms of EFS. We hypothesized superiority of the obinutuzumab arm as an 8% or higher improvement of 2-year EFS compared with the rituximab arm. This would correspond to a 2-year EFS >73% in the obinutuzumab arm. Superiority would be established if the upper limit of the hazard ratio (HR) was lower than 0.73 with an α of 2.5% (1-sided test) and a power of 80%. We used an exponential model to calculate sample size. Hypothesis calculation was based on an estimate of 65% 2-year EFS in the rituximab treatment group. We planned to enroll 670 patients, including an estimated 10% dropout, to observe a total of 345 EFS events. Two interim analyses of the primary end point were planned (according to the Lan-DeMets sequential designed to test futility and superiority) after 33% and 66% of the scheduled events needed for the final analysis had been recorded. The first interim analysis was performed in 2015 (data cutoff date, 14 April 2014): the unilateral log-rank P value (P = .0573) for stratified EFS was inferior to the preplanned futility bound (P = .5856) and superior to the preplanned superiority bound (P = .0001). This led the data and safety monitoring committee to recommend continuation of the study. The second interim analysis was performed in 2017 (data cutoff date, 1 August 2016): the unilateral log-rank P value (P = .1321) for stratified EFS was superior to the preplanned futility bound (P = .069), leading the data and safety monitoring committee to recommend stopping the study for futility. As all patients were enrolled at the time of the second interim analysis with only 25.2 months of median follow-up, the data and safety monitoring committee recommended monitoring patients for at least 1 additional year before presenting the final results of the trial.
The data cutoff for the present analyses was 1 December 2017. The EFS, PFS, OS, and DOR analyses were done with an intention-to-treat (ITT) method, thus including all patients randomly assigned to a treatment group. Prespecified sensitivity analyses such as unstratified analyses, analysis based on an efficacy set (ES) and analysis based on a per-protocol (PP) set, were performed for the primary end point. The ES included all patients randomized who received at least 1 dose of monoclonal antibody and had PET2 and PET4 (unless there was previous disease progression). The PP set excluded patients with major protocol deviations. Safety was assessed in patients who received at least 1 dose of study treatment (obinutuzumab or rituximab).
Survival estimates with 95% confidence intervals (CIs) were calculated with the Kaplan-Meier method. The survival distributions were compared with the log-rank test, and Cox proportional hazard regression models were used to estimate HRs and associated 95% CIs.
To compare the relative effect of the full PET-driven strategy on PFS and OS according to baseline characteristics found to influence outcomes in univariate analysis, a Cox proportional hazard regression model was fitted, including PET profile and aaIPI as explanatory variables.
Response and PET2 and PET4 results were expressed with 95% exact Clopper Pearson CI limits and compared with the χ2 test. Differences between groups were significant if P values were <.025 (1-sided) for EFS and <.05 (2-sided) for PFS and OS.
Results
From 20 September 2012 to 30 July 2015, 670 patients (ITT set) were enrolled and randomly assigned to receive either standard treatment with rituximab (n = 334) or obinutuzumab (n = 336). Patients’ characteristics at baseline (Table 1) were well balanced across the 2 treatment groups (and according to chemotherapy, see supplemental Appendix), except for sex (P = .016). The median age at baseline was 48 years (18-61 years). Median time from diagnosis to treatment was 20 days (2-149 days). Six hundred forty-six of 670 patients (96.4%) underwent a centrally assessed pathology biopsy; 580 (86.6%) had a confirmed CD20+ DLBCL.
Patients’ characteristics at baseline
| Characteristics | ITT, n = 670 | Efficacy set, n = 617 | Per protocol set, n = 594 | |||
|---|---|---|---|---|---|---|
| Obinutuzumab, n = 336 | Rituximab, n = 334 | Obinutuzumab, n = 311 | Rituximab, n = 306 | Obinutuzumab, n = 296 | Rituximab, n = 298 | |
| Median age (range), y | 49 (19-60) | 48 (18-61) | 49 (19-60) | 47 (18-60) | 49 (19-60) | 47 (18-60) |
| Sex, male, n (%) | 203 (60.4) | 170 (50.9) | 189 (60.8) | 153 (50.0) | 180 (60.8) | 152 (51.0) |
| ECOG | ||||||
| 0-1 | 286 (85.1) | 289 (86.8) | 266 (85.5) | 264 (86.3) | 252 (85.1) | 255 (85.6) |
| >1 | 50 (14.9) | 44 (13.2) | 45 (14.5) | 41 (13.4) | 44 (14.9) | 42 (14.1) |
| Missing | 0 | 1 | 1 | 1 | 0 | 1 |
| Ann Arbor stage, n (%) | ||||||
| I-II | 55 (16.4) | 63 (18.9) | 52 (16.7) | 62 (20.3) | 51 (17.2) | 60 (20.1) |
| III-IV | 281 (83.6) | 271 (81.1) | 259 (83.3) | 244 (79.7) | 245 (82.8) | 238 (79.9) |
| LDH elevated, yes, n (%) | 239 (71.1) | 248 (74.3) | 218 (70.1) | 230 (75.2) | 212 (71.6) | 225 (75.5) |
| aaIPI, n (%) | ||||||
| 0 | 1 (0.3) | 1 (0.3) | 1 (0.3) | 1 (0.3) | 0 (0) | 0 (0) |
| 1 | 142 (42.5) | 138 (41.7) | 135 (43.4) | 126 (41.2) | 128 (43.2) | 123 (41.3) |
| 2 | 149 (44.6) | 156 (47.1) | 136 (43.7) | 143 (46.7) | 129 (43.6) | 138 (46.3) |
| 3 | 42 (12.6) | 36 (10.9) | 37 (11.9) | 33 (10.8) | 37 (12.5) | 34 (11.4) |
| Extranodal involvement, yes, n (%) | 273 (81.3) | 271 (81.1) | 255 (82.0) | 238 (77.8) | 243 (82.1) | 233 (78.2) |
| Bulky disease, >10 cm, n (%) | 104 (31.0) | 109 (32.6) | 95 (30.5) | 101 (33.0) | 87 (29.4) | 99 (33.2) |
| Pathology review, n = 646, n (%) | ||||||
| DLBCL* | 288 (85.7) | 292 (87.4) | 269 (86.5) | 269 (87.9) | 269 (90.9) | 269 (90.3) |
| Misdiagnosis† | 21 (6.3) | 19 (5.7) | 19 (6.1) | 15 (4.9) | 5 (1.7) | 7 (2.3) |
| No or insufficient material | 27 (8.0) | 23 (6.9) | 23 (7.4) | 22 (7.2) | 22 (7.4) | 22 (7.4) |
| COO according to | ||||||
| Hans, n = 411 | ||||||
| GC, n (%) | 114 (55.6) | 125 (60.7) | 107 (55.2) | 119 (64.3) | 107 (55.2) | 118 (63.8) |
| Non-GCB, n (%) | 91 (44.4) | 81 (39.3) | 87 (44.8) | 66 (35.7) | 87 (44.8) | 67 (36.2) |
| No or insufficient material | 47 | 33 | 37 | 31 | 37 | 31 |
| Nanostring, n = 375 | ||||||
| GCB, n (%) | 126 (66.3) | 122 (65.9) | 116 (65.9) | 115 (68.0) | 116 (65.9) | 114 (67.5) |
| ABC, n (%) | 43 (22.6) | 40 (21.6) | 41 (23.3) | 34 (20.1) | 41 (23.3) | 35 (20.7) |
| Unclassified, n (%) | 21 (11.1) | 23 (12.4) | 19 (10.8) | 20 (11.8) | 19 (10.8) | 20 (11.8) |
| No or insufficient material | 62 | 54 | 55 | 47 | 55 | 47 |
| BCL2 expression, n = 544 | ||||||
| ≥70%, n (%) | 186 (69.4) | 208 (75.4) | 174 (68.8) | 188 (74.3) | 167 (68.4) | 186 (74.7) |
| <70%, n (%) | 82 (30.6) | 68 (24.6) | 79 (31.2) | 65 (25.7) | 77 (31.6) | 63 (25.3) |
| No or insufficient material | 70 | 62 | 60 | 55 | 54 | 51 |
| MYC expression, n = 466 | ||||||
| ≥40%, n (%) | 120 (51.7) | 123 (52.6) | 115 (51.6) | 109 (51.2) | 114 (52.8) | 106 (51.0) |
| <40%, n (%) | 112 (48.3) | 111 (47.4) | 108 (48.4) | 104 (48.8) | 102 (47.2) | 102 (49.0) |
| No or insufficient material | 106 | 104 | 90 | 95 | 82 | 92 |
| DE MYC/BCL2, n = 454 | ||||||
| Yes, n (%) | 93 (40.6) | 92 (40.9) | 88 (40.0) | 80 (39.0) | 87 (40.8) | 80 (39.8) |
| No, n (%) | 136 (59.4) | 133 (59.1) | 132 (60.0) | 125 (61.0) | 126 (59.2) | 121 (60.2) |
| No or insufficient material | 109 | 113 | 93 | 103 | 85 | 99 |
| Chemotherapy | ||||||
| CHOP, n (%) | 169 (50.9) | 170 (51.4) | 159 (51.1) | 160 (52.3) | 150 (50.7) | 157 (52.7) |
| ACVBP, n (%) | 163 (49.1) | 161 (48.6) | 152 (48.9) | 146 (47.7) | 146 (49.3) | 141 (47.3) |
| Not treated | 4 | 3 | 0 | 0 | 0 | 0 |
ABC, activated B cell; ACVBP, doxorubicin (75 mg/m2 at day 1), prednisone (60 mg/m2 day 1 to day 5), cyclophosphamide (1200 mg/m2 at day 1), vindesine (2 mg/m2 at day 1 and day 5), and bleomycin (10 mg at day 1 and day 5); aIPI, age-adjusted International Prognostic Index; CHOP, cyclophosphamide (750 mg/m2 at day 1), doxorubicin (50 mg/m2 at day 1), vincristine (1.4 mg/m2, maximum 2 mg, at day 1), and prednisone (40 mg/m2 day 1 to day 5); COO, cell of origin; DE, double expressor; ECOG, Eastern Cooperative Oncology Group scale; GCB, germinal center B cell; ITT, intention to treat; LDH, lactate dehydrogenase.
DLBCL includes DLBCL NOS, PMBL, EBV DLBCL, high-grade B-cell lymphoma, double-hit or high-grade B-cell lymphoma NOS, T-cell–rich B-cell lymphoma.
Follicular lymphoma (FL) grade 3B (n = 7), FL grade 3A (n = 6), FL grade 1-2 (n = 7), follicular lymphoma of undetermined grade (n = 2), nodular lymphocyte predominant Hodgkin lymphoma (n = 4), mantle cell lymphoma–pleomorphic variant (n = 2), B-NHL unclassifiable for technical reason (n = 7), angioimmunoblastic T-cell lymphoma (n = 1), atypical Burkitt lymphoma (n = 1), Burkitt lymphoma/ leukemia (n = 1), precursor B lymphoblastic leukemia/lymphoma (n = 1), anaplastic large cell lymphoma (ALK) + (n = 1).
Among the 670 enrolled patients, 339 patients received at least 1 cycle of CHOP (with obinutuzumab in 169 cases and rituximab in 170 cases) and 324 received at least 1 cycle of ACVBP (with obinutuzumab in 163 cases and rituximab in 161 cases) (Table 1). Three hundred twelve of 336 patients (93%) and of 334 patients (93%) completed induction treatment in the obinutuzumab and rituximab arms, respectively (Figure 2). Reasons for treatment discontinuation during induction were mainly treatment-related toxicity (n = 16; 2.4%). After completion of induction, the main reasons for treatment discontinuation in PET4− patients were treatment-related toxicity in 31 (6.4%), major protocol violation in 10 (2.0%), and patient decision in 14 cases (2.9%).
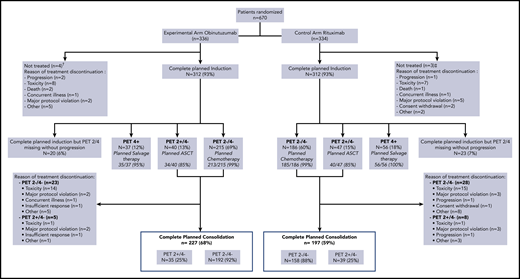
Flowchart. †Major protocol violation (cerebral lymphoma) (n = 1), concurrent illness (septic thrombophlebitis due to Staphylococcus aureus) (n = 1), evolution of lymphoma before treatment (n = 1), misdiagnosis (acute leukemia) (n = 1). ‡Major protocol violation (CNS involved) (n = 1), death (n = 1), evolution of lymphoma before treatment (n = 1).
Flowchart. †Major protocol violation (cerebral lymphoma) (n = 1), concurrent illness (septic thrombophlebitis due to Staphylococcus aureus) (n = 1), evolution of lymphoma before treatment (n = 1), misdiagnosis (acute leukemia) (n = 1). ‡Major protocol violation (CNS involved) (n = 1), death (n = 1), evolution of lymphoma before treatment (n = 1).
PET2 and 4 were performed in 302 patients (90%) and 297 patients (88%) in the obinutuzumab arm and 302 patients (90%) and 289 patients (86.5%) in the rituximab arm. PET2 and PET4 positivity rates were slightly higher in the rituximab arm compared with the obinutuzumab arm but did not reach statistical significance (Table 2). As shown in Figure 2, 401 patients (69%) were PET2−/4−, of whom 398 (99.3%) received the planned immunochemotherapy. Eighty-seven patients (15%) were PET2+/PET4−, of whom 74 (85%) received the planned consolidation therapy followed by ASCT. Ninety-three patients (16%) had positive PET4, of whom 91 (97.8%) received salvage therapy. In all, 227 patients (68%) completed the planned treatment in the obinutuzumab arm (including 124 patients [73%] with CHOP and 103 [63%] with ACVBP) and 197 (59%) in the rituximab arm (including 109 patients [64%] with CHOP and 88 [55%] with ACVBP) (Figure 2).
Interim PET results according to the central review in the ITT population
| Obinutuzumab | Rituximab | |||||
|---|---|---|---|---|---|---|
| CHOP, n = 171 | ACVBP, n = 165 | All, n = 336 | CHOP, n = 172 | ACVBP, n = 162 | All, n = 334 | |
| PET2 | ||||||
| Negative, n (%) | 111 (64.9) | 111 (67.3) | 222 (66.1) | 103 (59.9) | 103 (63.6) | 206 (61.7) |
| Positive, n (%) | 43 (25.1) | 37 (22.4) | 80 (23.8) | 55 (32.0) | 41 (25.3) | 96 (28.7) |
| Not reviewed | 17 | 17 | 34 | 14 | 18 | 32 |
| PET4 | ||||||
| Negative, n (%) | 133 (77.8) | 127 (77.0) | 260 (77.4) | 123 (71.5) | 110 (67.9) | 233 (69.8) |
| Positive, n (%) | 18 (10.5) | 19 (11.5) | 37 (11.0) | 32 (18.6) | 24 (14.8) | 56 (16.8) |
| Not reviewed | 20 | 19 | 39 | 17 | 28 | 45 |
See Table 1 for expansion of other abbreviations.
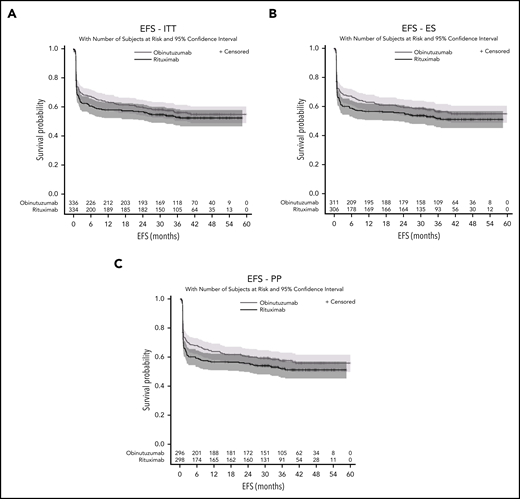
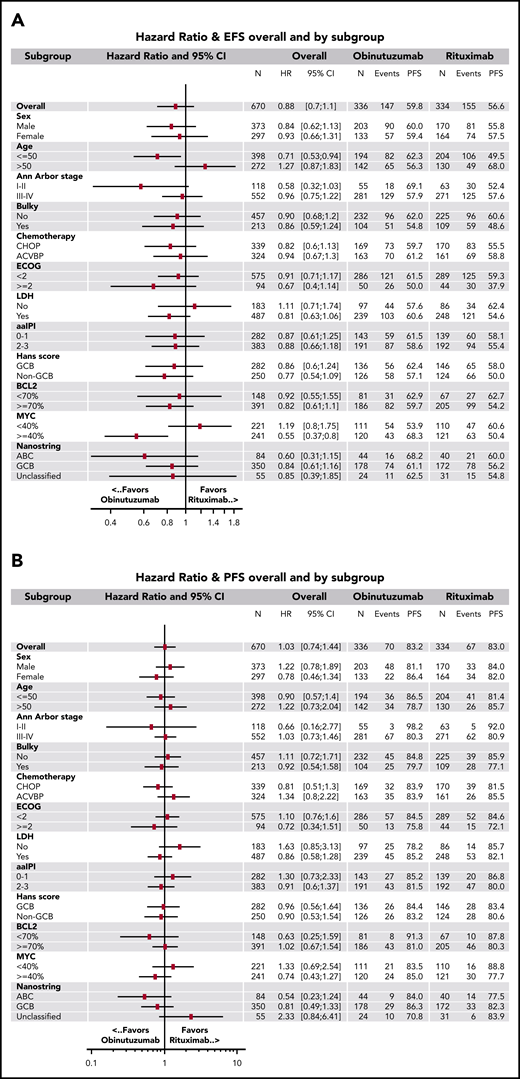
The median follow-up after randomization was 38.7 months (95% CI, 36.9-40.0). For the primary efficacy analysis (ITT set), 147 (43.8%) in the obinutuzumab arm and 155 (46.4%) in the rituximab arm had an event. Most frequent events were PET 2 or 4 positivity (85 patients [25%] in the obinutuzumab arm and 107 patients [32%] in the rituximab arm) (supplemental Appendix). The 2-year EFS estimates were 59.8% (95% CI, 54.3-64.8) in the obinutuzumab arm and 56.6% (95% CI, 51.1-61.8) in the rituximab arm (stratified log rank, P = .123; unstratified log rank, P = .127; HR = 0.88; 95% CI, 0.7-1.1) (Figure 3A) and did not differ according to both chemotherapy and aaIPI in both arms (Table 3). The efficacy of obinutuzumab and rituximab in terms of EFS was consistent across prespecified subgroups except for patients 50 years old or younger (HR = 0.71; 95% CI, 0.5-0.9), and for those with at least 40% of tumor cells expressing MYC (HR = 0.55; 95% CI, 0.4-0.8) (Figure 4A). EFS in the ES (n = 617) did not differ significantly between the 2 arms (stratified log rank, P = .077; unstratified log rank, P = .074; HR = 0.84; 95% CI, 0.7-1.1) (Figure 3B). In the PP set, results were similar (stratified log rank, P = .055; unstratified log rank, P = .056; HR = 0.83; 95% CI, 0.6-1.0) (Figure 3C).
Two-year EFS according to treatment arm in the ITT population
| Obinutuzumab | Rituximab | |||||
|---|---|---|---|---|---|---|
| N | 2-y EFS, % | 95% CI | N | 2-y EFS, % | 95% CI | |
| Unstratified EFS | 336 | 59.8 | 54.3-64.8 | 334 | 56.6 | 51.1-61.8 |
| Stratified EFS | ||||||
| aaIPI1 | ||||||
| CHOP | 74 | 62.2 | 50.1-72.1 | 73 | 58.8 | 46.7-69.1 |
| ACVBP | 76 | 60.3 | 48.4-70.3 | 74 | 61.9 | 49.8-71.9 |
| aaIPI2-3 | ||||||
| CHOP | 97 | 56.7 | 46.2-65.8 | 99 | 51.9 | 41.6-61.3 |
| ACVBP | 89 | 60.6 | 49.6-69.9 | 88 | 55.7 | 44.7-65.3 |
CI, confidence interval. See Table 1 for expansion of other abbreviations.
Unstratified hazard ratios. For (A) EFS and (B) PFS in predefined subsets of patients. ABC, activated B cell; ACVBP, doxorubicin (75 mg/m2 at day 1), prednisone (60 mg/m2 day 1 to day 5), cyclophosphamide (1200 mg/m2 at day 1), vindesine (2 mg/m2 at days 1 and 5) and bleomycin (10 mg at days 1 and 5); CHOP, cyclophosphamide (750 mg/m2 at day 1), doxorubicin (50 mg/m2 at day 1), vincristine (1.4 mg/m2, maximum 2 mg, at day 1), and prednisone (40 mg/m2 day 1 to day 5); DE, double expressor; ECOG, Eastern Cooperative Oncology Group scale; GCB, germinal center B cell; LDH, lactate dehydrogenase.
Unstratified hazard ratios. For (A) EFS and (B) PFS in predefined subsets of patients. ABC, activated B cell; ACVBP, doxorubicin (75 mg/m2 at day 1), prednisone (60 mg/m2 day 1 to day 5), cyclophosphamide (1200 mg/m2 at day 1), vindesine (2 mg/m2 at days 1 and 5) and bleomycin (10 mg at days 1 and 5); CHOP, cyclophosphamide (750 mg/m2 at day 1), doxorubicin (50 mg/m2 at day 1), vincristine (1.4 mg/m2, maximum 2 mg, at day 1), and prednisone (40 mg/m2 day 1 to day 5); DE, double expressor; ECOG, Eastern Cooperative Oncology Group scale; GCB, germinal center B cell; LDH, lactate dehydrogenase.
Response rates after 4 cycles of induction and at the end of treatment (according to Cheson 1999 and 2007 [supplemental Appendix]) were similar in both arms. Duration of response (Cheson 2007 criteria) did not differ significantly between the 2 arms (2- and 4-year DOR: 87.4% [95% CI, 83.1% to 90.7%] and 82.8% (95% CI, 77.4% to 87.0%) vs 86.8% (95% CI, 82.3% to 90.2%) and 83.4% (95% CI, 78.2% to 87.4%) (HR = 0.98 [95% CI, 0.7-1.5]; P = .94) (see supplemental Appendix). PFS also did not differ significantly between the 2 arms (P = .87; HR = 1.03; 95% CI, 0.7-1.4). The 2- and 4-year PFS estimates in the ITT population were, respectively, 83.2% (95% CI, 78.7% to 86.8%) and 77.5% (95% CI, 72.2% to 81.9%) in the obinutuzumab arm and 83% (95% CI, 78.5% to 86.7%) and 78.8% (95% CI, 73.8% to 83%) in the rituximab arm (Figure 5). Results were similar in the ES (P = .92) and PP sets (P = .96). The efficacy of obinutuzumab and rituximab in terms of PFS was similar across prespecified subgroups (Figure 4B). OS was similar between both arms (P = .85; HR = 0.96; 95% CI, 0.6-1.5). The 2- and 4-year OS were, respectively, 90.7% (95% CI, 87.0% to 93.4%) and 88.2% (95% CI, 83.9% to 91.4%) in the obinutuzumab arm vs 91.8% (95% CI, 88.1% to 94.3%) and 86% (95% CI, 80.8% to 89.8%) in the rituximab arm (Figure 5). Seventy of 663 patients (safety set; 10.6%) died, of whom 34 (10.2%) were in the obinutuzumab arm and 36 (10.9%) were in the rituximab arm. Main causes of death were lymphoma in 45 patients (6.8%; 19 in the obinutuzumab and 26 in the rituximab arms) and toxicity of the study treatment in 9 patients.
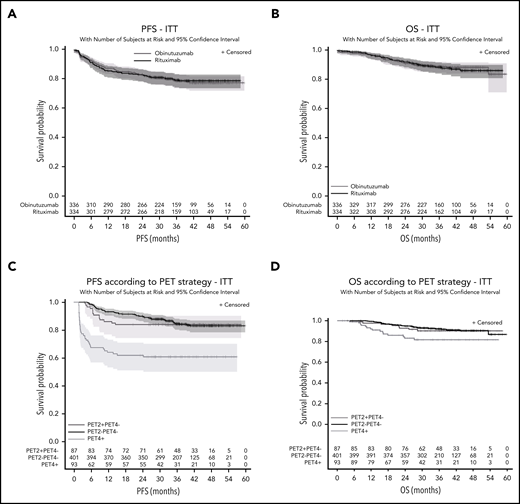
Unstratified survival. Unstratified PFS (A) and OS (B) according to randomization arms and PFS according to PET2 PET4 responses in the whole cohort (C) and OS according to iPET response (D).
Unstratified survival. Unstratified PFS (A) and OS (B) according to randomization arms and PFS according to PET2 PET4 responses in the whole cohort (C) and OS according to iPET response (D).
A univariate analysis showed that Ann Arbor stage III-IV, Eastern Cooperative Oncology Group (ECOG) status >1, aaIPI >1, tumor bulk ≥10 cm, Bcl2 expression in ≥70% of tumor cells were associated with lower PFS (Table 4). On the other hand, lactate dehydrogenase (LDH) level, COO according to the Hans algorithm, or gene-expression profile, MYC expression, and double expression of BCL2 and MYC had no effect on PFS. Ann Arbor stage III-IV, ECOG status >1, and aaIPI >1 were also associated with a worse OS. By contrast, LDH level, tumor bulk, and COO had no significant effect. A positive PET2 was not associated with an inferior outcome when PET4 was negative. PET2−/PET4− patients assigned to immunochemotherapy and PET2+/PET4− patients allocated to ASCT had similar PFS (2- and 4-year PFS, 89.9% [95% CI, 86.5% to 92.5%] and 83% [95% CI, 78.5% to 86.7%] vs 83.9% [95% CI, 74.3% to 90.1%] and 83.9% [95% CI, 74.3% to 90.1%]) and OS (2- and 4-year OS, 94.8% [95% CI, 92.1% to 96.6%] and 90.3% [95% CI, 86.2% to 93.2%] vs 92.8% [95% CI, 84.7% to 96.7%] and 90.2% [95% CI, 81.4% to 95%]). Conversely, PET4 positivity was associated with an increased risk of relapse, progression or death, regardless of the treatment group (2- and 4-year PFS, 62% [95% CI, 51.3% to 71%] and 60.9% [95% CI, 50.1% to 70%], HR = 3.44 [95% CI, 2.3-5.1], P < .001; 2- and 4-year OS, 83.1% [95% CI, 73% to 89.7%] and 81.5% [95% CI, 71.1% to 88.5%], HR = 2.49 [95% CI, 1.4-4.5]; P = .005) (Figure 5). In a multivariable analysis, PET4 positivity was the only parameter that remained statistically significant for both PFS and OS (P < .001) whereas patients with IPI 2-3 (P = .001) and percentage of Bcl-2+ cells ≥70% (P = .047) presented a worse OS but not PFS. Ann Arbor stage III-IV (P < .001) and bulky disease (P = .039) were statistically significant for PFS but not for OS (Table 4).
Factors influencing patient’s outcome
| Risk factors | n (%) | 2-y PFS, % (95% CI) | PFS | 2-y OS, % (95% CI) | OS | ||||||
|---|---|---|---|---|---|---|---|---|---|---|---|
| Univariate analysis | Multivariable analysis | Univariate analysis | Multivariable analysis | ||||||||
| HR (95% CI) | P | HR (95% CI) | P | HR (95% CI) | P | HR (95% CI) | P | ||||
| Age, y | |||||||||||
| >50 | 272 (41) | 82 (76.8-86.1) | 1.17 (0.8-1.6) | .36 | 89.9 (85.5-93.0) | 1.42 (0.9-2.2) | .13 | ||||
| ≤50 | 398 (59) | 83.9 (79.9-87.1) | 92.1 (89.0-94.4) | ||||||||
| Sex | |||||||||||
| Male | 373 (56) | 82.4 (78.1-85.9) | 1.17 (0.8-1.6) | .36 | 91.9 (88.5-94.3) | 0.96 (0.6-1.5) | .88 | ||||
| Female | 297 (44) | 84 (79.3-87.7) | 90.5 (86.4-93.4 | ||||||||
| ECOG | |||||||||||
| ≥2 | 94 (14) | 74.1 (63.9-81.8) | 1.68 (1.1-2.5) | .021 | 84.1 (74.6-90.3) | 2.22 (1.3-3.7) | .005 | ||||
| 0-1 | 575 (86) | 84.5 (81.3-87.3) | 92.4 (89.8-94.3) | ||||||||
| Ann Arbor stage | |||||||||||
| III-IV | 552 (82) | 80.6 (77.0-83.7) | 3.78 (1.8-7.7) | <.001 | 3.71 (1.7-8.0) | <.001 | 89.5 (86.6-91.9) | 8.62 (2.1-35.3) | <.001 | ||
| I-II | 118 (18) | 94.9 (89.0-97.7) | 99.1 (94.0-99.9) | ||||||||
| LDH | |||||||||||
| Elevated | 487 (73) | 83.6 (80-86.6) | 0.94 (0.6-1.4) | .73 | 91.0 (88.0-93.2) | 1.16 (0.7-2.0) | 0.57 | ||||
| Normal | 183 (27) | 81.7 (75.3-86.6) | 92.1 (86.9-95.2) | ||||||||
| aa-IPI | |||||||||||
| 2-3 | 383 (58) | 80.8 (76.4-84.4) | 1.46 (1.0-2.1) | .034 | 88.8 (85.0-91.6) | 2.07 (1.2-3.5) | .003 | 3.91 (1.7-8.8) | .001 | ||
| 0-1 | 282 (42) | 86 (81.3-89.6) | 94.5 (91.0-96.6) | ||||||||
| Bulk, cm | |||||||||||
| ≥10 | 213 (32) | 78.3 (72.1-83.3) | 1.42 (1.0-2.0) | .05 | 1.49 (1.0-2.2) | .039 | 89.2 (84.0-92.7) | 1.45 (0.9-2.3) | .12 | ||
| <10 | 457 (68) | 85.4 (81.7-88.3) | 92.2 (89.3-94.4) | ||||||||
| Hans score | |||||||||||
| Non-GC | 250 (47) | 81.9 (76.6-86.2) | 1.15 (0.8-1.7) | .46 | 89.6 (85.0-92.9) | 1.39 (0.8-2.3) | .20 | ||||
| GC | 282 (53) | 83.9 (79-87.7) | 93.0 (89.3-95.5) | ||||||||
| BCL2 | |||||||||||
| ≥70% | 391 (73) | 80.6 (76.3-84.2) | 1.99 (1.2-3.3) | .004 | 90.6 (87.2-93.2) | 1.84 (0.9-3.6) | .064 | 2.41 (1.0-5.7) | .047 | ||
| <70% | 148 (27) | 89.7 (83.5-93.7) | 94.3 (89.0-97.1) | ||||||||
| MYC | |||||||||||
| ≥40% | 241 (52) | 81.3 (75.8-85.7) | 1.39 (0.9-2.1) | .12 | 89.8 (85.1-93.0) | 1.31 (0.7-2.3) | .34 | ||||
| <40% | 221 (48) | 86.2 (80.8-90.1) | 92.9 (88.5-95.7) | ||||||||
| DE Myc/Bcl2 | |||||||||||
| Yes | 183 (41) | 79.8 (73.2-84.9) | 1.46 (0.96-2.2) | .075 | 88.7 (83.1-92.6) | 1.41 (0.8-2.5) | .23 | ||||
| No | 267 (59) | 85.9 (81.1-89.6) | 92.6 (88.6-95.2) | ||||||||
| Treatment arm | |||||||||||
| Obinutuzumab | 336 (50) | 83.2 (78.7-86.8) | 1.03 (0.7-1.4) | .87 | 0.95 (0.7-1.4) | .77 | 90.7 (87.0-93.4) | 0.96 (0.6-1.5) | .86 | 0.89 (0.5-1.6) | .69 |
| Rituximab | 334 (50) | 83 (78.5-86.7) | 91.8 (88.1-94.3) | ||||||||
| Chemotherapy | |||||||||||
| CHOP | 339 (51) | 82.7 (78.2-86.4) | 1.14 (0.8-1.6) | .46 | 1.06 (0.7-1.5) | .76 | 92.0 (88.4-94.5) | 1.10 (0.7-1.8) | .70 | 0.85 (0.5-1.5) | .59 |
| ACVBP | 324 (49) | 84.7 (80.3-88.2) | 91.6 (87.9-94.2) | ||||||||
| PET2/PET4 | |||||||||||
| PET4+ | 93 (16) | 62 (51.3-71.0) | 3.44 (2.3-5.1) | <.001 | 3.17 (2.1-4.7) | <.001 | 83.1 (73.0-89.7) | 2.49 (1.4-4.5) | .005 | 3.61 (1.9-6.8) | <.001 |
| PET2− or PET+/PET4− | 493 (84) | 89 (85.8-91.4) | 94.5 (92.1-96.3) | ||||||||
HR, hazard ratio. See Table 1 for expansion of other abbreviations.
During induction phase, the most common grade 3-4 AEs in the safety set were hematological as nearly one-half of the patients experienced neutropenia in both arms. Grade 3-5 infections were more frequent in the obinutuzumab arm (21%) compared with the Rituximab arm (12%). Other AEs were standard for intensive chemotherapy (supplemental Table 7 of the supplemental Appendix). The cumulative incidence of second primary malignancies was 4.1% in 27 patients and similar between the 2 groups (15 in 332 patients of the obinutuzumab arm [4.5%] and 12 in 331 patients of the rituximab arm [3.6%]) whereas more acute leukemia or myelodysplasia syndrome were observed in the obinutuzumab arm (6 vs 2 cases) (see supplemental Table 5 of the supplemental Appendix).
Discussion
The GAINED trial demonstrates that obinutuzumab does not provide better EFS than rituximab in combination with chemotherapy delivered every 14 days for treatment-naive young patients with IPI ≥1 DLBCL. PFS and OS are similar in both arms. Analysis of subgroups does not show a subset of patients who may benefit from obinutuzumab rather than rituximab.
The GALLIUM14 study demonstrated that, in newly diagnosed follicular lymphoma patients, obinutuzumab plus chemotherapy followed by obinutuzumab maintenance significantly improves PFS compared with the same treatment with rituximab. In contrast, the GOYA trial15 fails to show superiority of obinutuzumab over rituximab in treatment-naive DLBCL patients >18 years. The 2 antibodies, in combination with CHOP, show similar 3-year PFS (median follow-up of 29 months): 70% in the obinutuzumab arm vs 67% in the rituximab arm. The present trial addresses the same question as the GOYA trial but it looks at a different population and uses a different consolidation treatment strategy based on interim PET results. Indeed, patients enrolled in GAINED are all <60 years and transplant-eligible at diagnosis, whereas in GOYA, the median age was 62 years with more than half of the patients IPI low/intermediate. The GOYA trial compared 8 rituximab vs 10 obinutuzumab infusions associated to CHOP delivered every 21 days whereas GAINED compares rituximab vs obinutuzumab associated to chemotherapy delivered every 14 days in young patients with advanced disease who had double-negative interim PET (69%). These last patients are those who received complete planned antibodies infusions. The GAINED and GOYA trials use different end points: EFS and PFS, respectively. The PET-driven design of the GAINED trial led to the choice of EFS, with PET positivity results after 2 and 4 courses considered as events. Despite all of these discrepancies, both trials reach the same conclusion that obinutuzumab and rituximab are equivalent in the treatment of DLBCL regardless of age, IPI score, COO, treatment intensity, and use of PET-driven strategy.
The GAINED study provides interesting additional findings. The 2- and 4-year PFS in the whole cohorts were 83.1% (95% CI, 80% to 85.8%) and 78.1% (95% CI, 74.6% to 81.2%), respectively. These results are the best published so far in young patients with aaIPI ≥1.6,8,16,17 The PET-driven strategy could help explain these good outcomes. Indeed, interim PET identifies the DLBCL patients less sensitive to chemotherapy, those at high risk of early relapse or progression.6,12 A post hoc analysis of the LNH07-3B study shows that ΔSUVmax improves the prognosis value of interim PET after cycles 2 and 4 compared with visual analysis.6,11 In the present study, ΔSUVmax is used prospectively in order to interpret interim PET and to discriminate patients with different outcomes. The PETAL study, which uses the ΔSUVmax method with the same 66% cutoff after 2 cycles of immunochemotherapy,9,11,18 demonstrates that DLBCL patients have significantly better outcomes when ΔSUVMax is >66%.17 It is interesting to compare the efficacy of the consolidation strategy applied to PET2+ patients in the PETAL and GAINED trials. In the present trial, PET2+/PET4− patients (15%) were allocated to ASCT, whereas in PETAL, PET2+ patients were randomized between continuing treatment with R-CHOP and a Burkitt-like regimen. PETAL demonstrates that the Burkitt-like experimental chemotherapy is not superior to R-CHOP and confirms that PET2 positivity is an independent prognostic marker. In view of this, PET2+/PET4− patients underwent ASCT and their outcomes are identical to PET2−/PET4− patients, suggesting that ASCT may overcome the bad prognostic value of PET2 positivity in the subset of patients achieving a good response after 4 cycles of induction, but the lack of randomization regarding treatment consolidation for PET2+/PET4− patients does not allow formal conclusion in favor of ASCT consolidation vs a nontransplant therapy. Our results also suggest that interim PET assessment (PET2 plus PET4) accurately stratifies patients into 3 risk groups with PET4+ patients being those with the poorer outcome, despite salvage treatment. These last patients require new therapy options and should be candidates for innovative strategies. Chimeric antigen receptor T cells have been recently approved for relapse refractory DLBCL and could be an interesting option for PET4+ patients who can be identified earlier, thanks to PET2 response assessment using ΔSUVmax. In contrast, PET2−/PET4− high aaIPI score patients (nearly 70% of patients) experience prolonged response duration (4-year PFS = 83.1% and OS = 90.2%). This raises the question of therapeutic reduction. Indeed, low-risk IPI PET2− young DLBCL patients could be cured with only 4 cycles of chemotherapy instead of 6 cycles of R-CHOP.19
CHOP remains the most widely used regimen in DLBCL and the reference polychemotherapy in clinical trials. Other more intensive polychemotherapy regimen are used in daily practice, such as dose-adjusted etoposide plus prednisone plus vincristine plus cyclophosphamide plus doxorubicin (DA-EPOCH) or ACVBP. ACVBP demonstrated superiority over CHOP in aaIPI = 1 patients.5 In the GAINED study, patients treated with ACVBP have a lower rate of PET2 positivity, which, thanks to the PET-driven strategy, diminishes the number of patients referred to autograft and/or salvage therapy. The toxicity of the ACVBP regimen is superior to CHOP, and the present study shows that ACVBP enhances neither PFS nor OS compared with R-CHOP (including for patients with aaIPI = 1). Recent phase 3 studies added new molecules (bortezomib/ibrutinib/lenalidomide) in combination with R-CHOP, but none demonstrated superiority over R-CHOP.20-22 This highlights the need to better decipher the DLBCL molecular heterogeneity background in order to set up new personalized biology-driven therapies. A PET-driven strategy is among those new tools that could help tailor personalized approaches in future trials. Indeed, baseline total metabolic volume23-25 and interim PET results added to longitudinal analysis of circulating tumor DNA26,27 could provide an interesting multiparameter approach capable of refining the prediction of early response to treatment.
In conclusion, obinutuzumab does not provide outcome benefits compared with rituximab in the first-line treatment of young DLBCL patients with advanced disease. A PET-driven approach based on ΔSUVmax criteria enables early identification of patients with high risk of relapse for whom innovative therapeutic solutions are needed.
Presented in part at the 59th annual meeting of the American Society of Hematology, Atlanta, GA, 9-12 December 2017.
Access to the study data can be requested by e-mailing the corresponding authors. This includes deidentified individual participant data, the informed consent form, and the data dictionary defining each field in the set. These data will be available after final publication of all end points, including secondary end points, as listed in the protocol. All requests need to be approved by the corresponding authors; the aim of the demand should be described and needs to be related to a scientific work. Please note that the following data are already available in the supplemental Appendix: study protocol and statistical analysis plan.
The online version of this article contains a data supplement.
The publication costs of this article were defrayed in part by page charge payment. Therefore, and solely to indicate this fact, this article is hereby marked “advertisement” in accordance with 18 USC section 1734.
Acknowledgments
The authors thank the patients who participated in this study and their families, as well as investigators and staff at GAINED clinical sites. They also acknowledge LYSARC and every research team and nurse in the participating centers. S.L.G. and R.-O.C. thank Gilles Salles for support and contribution to the conduct of the study.
This work as well as the GAINED trial were supported by Roche SAS.
Roche Pharma provided obinutuzumab and funded the trial. The funder had no role in trial design, data collection, data analysis, or data interpretation, or in the writing of the report. Corresponding authors had full access to all of the data in the study and had final responsibility for the decision to submit for publication. LYSARC is the sponsor.
Authorship
Contribution: S.L.G. and R.-O.C. designed the trial in collaboration with J.-P.J., C.H., E.I., and T.L., conducted the study, analyzed the results, enrolled and treated patients, and wrote the first draft of the manuscript; H.G., L.O., F.M., H.T., V.R., T.L., C.T., H.M., R.G., K.B., C.H., G.D., L.F., R.B., P.F., D.S., G.C., C.B., and M.A. enrolled and treated patients; L.C. and J.-P.J. performed statistical analysis; T.J.M. and J.B. performed pathology review; E.I., F.K.-B., C.B.-M., and A.B.-R. performed PET review; P.R. performed cell of origin analysis using Nanostring technology; and all authors approved the final version of the manuscript and are accountable for all aspects of the work.
Conflict-of-interest disclosure: S.L.G. received grants, personal fees, or nonfinancial support from Roche Genentech, during the conduct of the study; personal fees from Celgene; and grants and personal fees from Janssen-Cilag, Gilead/Kite, and Servier outside of the submitted work. H.G. received grants, personal fees, or nonfinancial support from Gilead Sciences, Janssen, Celgene, Roche, and Takeda. L.O. served on advisory boards for Roche and Takeda, and received honoraria from Celgene, Janssen, and Roche. F.M. has received honoraria from Bristol Myers Squibb and Janssen, and served as a consultant or advisor to Celgene, Bayer, AbbVie, Verastem, Gilead, Servier, Roche/Genentech, and Epizyme. H.T. provided consulting services to, and served on advisory boards for, Roche, Janssen-Cilag, Karyopharm, and AstraZeneca, and provided lectures to Roche, Bristol Myers Squibb, and Servier. V.R. received grants and personal fees from Infinity Pharmaceuticals, Bristol Myers Squibb, PharmaMar, Gilead Sciences, Astra Zeneca, Epizyme, Incyte, Merck Sharp & Dohme, Servier, Roche, and Argenx. C.T. received honoraria from Amgen, Celgene, Jazz Pharma, Kite/Gilead, Novartis, Servier, Roche, and Janssen, and received research funding from Roche, Celgene, and Aspira. C.H. received grants and personal fees from Takeda and AbbVie, and received honoraria and nonfinancial support from Roche, Janssen-Cilag, AbbVie, and Takeda. G.D. served on boards for Roche and Takeda; received travel expenses from Roche, AbbVie, and Pfizer; and received grants from Takeda and Roche. L.F. received honoraria from Roche, Janssen, Gilead, Servier, and Takeda; received travel grants from Roche, Janssen, AbbVie, and Takeda; and served on boards for Roche, Servier, and Takeda. P.F. received grants and personal fees from Roche, Genentech, Celgene, AbbVie, Janssen, and Gilead. G.C. has received honoraria from Janssen, Sanofi, AbbVie, Gilead, Roche, and Celgene, and served as a consultant for Celgene and Roche/Genentech. C.B. is a board member for Roche. C.B.-M. provided consulting services to Bristol Myers Squibb and Gilead. T.J.M. provided consulting services to Merck and Novartis. R.-O.C. received grants, personal fees, and nonfinancial support from Roche and Genentech, during the conduct of the study; received personal fees from Merck Sharp & Dohme, Bristol Myers Squibb, AbbVie, Amgen, and Celgene; and grants and personal fees from Takeda and Gilead/Kite, outside of the submitted work. The remaining authors declare no competing financial interests.
Correspondence: René-Olivier Casasnovas, Department of Hematology, CHU Dijon, 14 Rue Paul Gaffarel, 21000 Dijon, France; e-mail: olivier.casasnovas@chu-dijon.fr; and Steven Le Gouill, Department of Hematology CHU Nantes, 1 Place Alexis Ricordeau, 44093 Nantes, France; e-mail: steven.legouill@chu-nantes.fr.
