

Key Points
When SMEs are abundant in RBC concentrates, transfusion recovery is diminished.
SMEs are rapidly cleared after transfusion predominantly through spleen- and macrophage-related mechanisms.

Abstract
Permanent availability of red blood cells (RBCs) for transfusion depends on refrigerated storage, during which morphologically altered RBCs accumulate. Among these, a subpopulation of small RBCs, comprising type III echinocytes, spheroechinocytes, and spherocytes and defined as storage-induced microerythrocytes (SMEs), could be rapidly cleared from circulation posttransfusion. We quantified the proportion of SMEs in RBC concentrates from healthy human volunteers and assessed correlation with transfusion recovery, investigated the fate of SMEs upon perfusion through human spleen ex vivo, and explored where and how SMEs are cleared in a mouse model of blood storage and transfusion. In healthy human volunteers, high proportion of SMEs in long-stored RBC concentrates correlated with poor transfusion recovery. When perfused through human spleen, 15% and 61% of long-stored RBCs and SMEs were cleared in 70 minutes, respectively. High initial proportion of SMEs also correlated with high retention of RBCs by perfused human spleen. In the mouse model, SMEs accumulated during storage. Transfusion of long-stored RBCs resulted in reduced posttransfusion recovery, mostly due to SME clearance. After transfusion in mice, long-stored RBCs accumulated predominantly in spleen and were ingested mainly by splenic and hepatic macrophages. In macrophage-depleted mice, splenic accumulation and SME clearance were delayed, and transfusion recovery was improved. In healthy hosts, SMEs were cleared predominantly by macrophages in spleen and liver. When this well-demarcated subpopulation of altered RBCs was abundant in RBC concentrates, transfusion recovery was diminished. SME quantification has the potential to improve blood product quality assessment. This trial was registered at www.clinicaltrials.gov as #NCT02889133.
Introduction
Maintaining the permanent availability of human red blood cells (RBCs) for transfusion depends on refrigerated storage of RBC concentrates for up to 42 days. The potential impact of storage duration on transfusion safety has been extensively studied.1-5 Meta-analyses of prospective randomized controlled trials suggest there is no advantage in terms of mortality in transfusing short-stored, as compared with standard-issue, RBC concentrates.6,7 A secondary analysis of the INFORM trial8 concluded that RBCs stored for >35 days were not associated with an increased mortality risk; however, no randomized trials have addressed whether the oldest blood is associated with harm. Therefore, questions remain regarding the clinical impact of long-stored RBC concentrates in general and on massive transfusion in particular, with few studies and discordant results,9,10 or in chronically transfused patients, who are susceptible to transfusion-related iron overload.
The term storage lesions refers to the alterations that accumulate during hypothermic storage.11-16 The intensity of storage lesions varies from donor to donor,17-20 and despite extensive studies in vitro,14,21,22 its impact on transfusion outcome remains unclear. The wealth of analyses on RBC transfusion safety sharply contrasts with the small number of studies evaluating the impact of storage duration on transfusion recovery. For example, a study of autologous transfusion of 51-chromium (51Cr)–labeled RBCs in healthy volunteers showed that storage duration was associated with decreased posttransfusion recovery and increased extravascular hemolysis, serum transferrin saturation, and circulating non–transferrin-bound iron.23 In addition, in retrospective studies, transfusion-induced hemoglobin increments were significantly decreased when RBC concentrates were stored for longer durations.24-26 The 24-hour posttransfusion recovery was also significantly decreased when patients with hematological malignancies were transfused with irradiated RBC concentrates stored for >2 weeks compared with irradiated RBC concentrates stored for <2 weeks.17 These studies suggest that rapid clearance of long-stored RBCs results in reduced transfusion recovery. Early studies showed that some in vitro markers of storage lesions, such as storage hemolysis, correlated poorly with transfusion recovery.27 Although other in vitro markers, such as ATP level and the morphology index, have shown better correlation with transfusion recovery, the predictive value of these markers is limited.28-35 Finally, direct evidence is lacking that RBCs with low levels of ATP or morphologically altered RBCs are indeed the target for early posttransfusion clearance.
A well-demarcated subpopulation of morphologically altered and smaller RBCs, comprising type III echinocytes, spheroechinocytes, and spherocytes, is easily quantified by imaging flow cytometry in a reproducible, objective, and operator-independent manner.36 Their decreased surface area, resulting from progressive membrane loss during storage,37-39 is expected to lead to their rapid clearance from the recipient’s circulation after transfusion. Indeed, the decreased surface area of chemically treated RBCs leads to splenic entrapment.40 These small RBCs, defined as storage-induced microerythrocytes (SMEs), accumulate during storage, reaching a mean proportion of 24% of the entire RBC population at day 42 of storage.36 Rapid clearance of this subpopulation could explain the decreased transfusion recovery observed after transfusion of long-stored RBC concentrates.
Herein, we assessed whether the proportion of SMEs in stored RBC concentrates correlates with posttransfusion recovery in healthy volunteers. We also investigated the fate of SMEs during ex vivo perfusion of human spleen, as well as in a specifically developed mouse model. Converging results obtained in human participants and mice confirmed that SMEs are rapidly cleared after transfusion, predominantly through spleen- and macrophage-related mechanisms.
Methods
RBC concentrate collection and storage
Leukoreduced RBC concentrates from healthy donors were stored in saline-adenine-glucose-mannitol (SAGM) solution at 2 to 6°C for 42 days and provided by the Etablissement Français du Sang Haut de France-Normandie (French blood banking system). Samples were aseptically collected for each experiment. For human 51Cr RBC posttransfusion recovery studies, leukoreduced RBC concentrates in additive solution-3 (AS-3; n = 30) or AS-1 (n = 1) were collected from consented healthy volunteers and stored at 2 to 6°C. On day 40 to 42 of storage, 20 to 30 mL were aseptically retrieved from the bag to perform 51Cr labeling of RBCs and 24-hour posttransfusion recovery experiments as described.23,41,42 At the same time, a second aliquot of RBCs was immediately shipped at 4°C from Columbia University to Institut National de la Transfusion Sanguine for SME quantification (which occurred 40-48 hours after posttransfusion recovery study). Technical details on RBC concentrate collection are available in the supplemental Methods, available on the Blood Web site.
Scanning electron microscopy of human samples
Samples were fixed by incubation in 4% paraformaldehyde and 1% glutaraldehyde in 0.1 M of phosphate buffer (pH, 7.3), washed in phosphate buffer, and postfixed by incubation with 2% osmium tetroxide for 1 hour. Samples were then fully dehydrated in a graded series of ethanol solutions and dried in hexamethyldisilazane. Finally, samples were coated with 4 nm of carbon using a GATAN PECS 682 apparatus before observation under a Zeiss Ultra plus field emission gun scanning electron microscope.
Imaging flow cytometric analysis of human samples
Imaging flow cytometry using ImageStream X Mark II (Amnis of EMD Millipore) was performed to determine RBC dimensions and morphology by using brightfield images (×60 magnification) processed with computer software (IDEAS [version 6.2]; Amnis) as described.36 Technical details are available in supplemental Methods.
Human spleen retrieval and ex vivo perfusion
Spleens were retrieved and processed as described.43 All patients underwent distal splenopancreatectomy for pancreatic disease. Spleens were macroscopically and microscopically normal in all cases. Main splenic artery was cannulated, and spleens were flushed with cold Krebs-albumin solution for transport to the laboratory. Spleens were coperfused with untreated long-stored RBCs (stained with Celltrace Violet, CellTrace Yellow, or 8 μg/mL of biotin), rejuvenated long-stored RBCs (stained with carboxyfluorescein diacetate succinimidyl ester [CFSE], Celltrace Far Red, or 32 μg/mL of biotin), and short-stored RBCs, at a final hematocrit of 5% to 30% (Krebs-albumin solution), over a 70-minute period at 37°C. Samples were retrieved from the circuit for flow cytometric or imaging flow cytometric analysis. Persistence in circulation was calculated using the following formula: (% stained RBCs in sample/% stained RBCs at T0) × 100. Mean retention rate was calculated using the following formula: 100 − ([mean % of stained RBCs in all samples taken between 40 and 70 minutes/% of stained RBCs at T0] × 100). Rejuvenation was conducted by adding 3 mL of rejuvenation solution (Zimmer Biomet) to 20 mL of RBCs and incubating 1 hour at 37°C, followed by 2 washes in SAGM solution.
Mouse blood banking and transfusion
Intact, splenectomized, or sham splenectomized C57BL/6 female mice (age 8-10 weeks) were purchased from Janvier Laboratory. RBCs were aseptically collected in citrate-phosphate-dextrose-adenine solution, leukoreduced, and stored at 4°C for up to 14 days as previously reported.44 For macrophage depletion, mice were intraperitoneally injected with 1 and 0.5 mg of clodronate liposomes (Liposoma) 5 and 2 days before transfusion, respectively. RBCs were stained with CFSE (20 μM) and washed twice in RPMI. CFSE+ RBC suspensions (200 μL) were transfused through the retro-orbital plexus, and their proportion after transfusion was measured by flow cytometry. Posttransfusion recovery was calculated using the following formula: (% CFSE+ RBCs in sample/% CFSE+ RBCs in 5-minute sample) × 100.
Imaging flow cytometric analysis of mouse samples
Blood bank or transfused mouse samples were diluted (1:100) in Dulbecco’s phosphate-buffered saline (PBS) supplemented with 1 g/L of glucose and 0.01% bovine serum albumin (pH, 7.3), incubated for 50 minutes at 37°C, and analyzed by imaging flow cytometry as for human samples. Transfused RBCs were analyzed by gating on CFSE+ events. Posttransfusion recovery of the SME subpopulation was calculated using the following formula: posttransfusion recovery × (% of CFSE+ RBCs <41 μm2 in sample/% of CFSE+ RBCs <41 μm2 in 5-minute sample).
Enrichment in organs
Spleen and liver were sliced in PBS, 2% fetal bovine serum, and 2 mM of EDTA, and bone marrow cells were obtained by flushing the bones. After 15-minute incubation at room temperature, supernatants were collected, filtered (40 μm), and stained with the DNA stain Draq5. Samples were analyzed by flow cytometry, and the enrichment factor (EF) was calculated using the following formula: (% of CFSE+ RBCs within Draq5− cells of organ/% of CFSE+ RBCs in blood sample) × 100.
In vivo erythrophagocytosis
Spleen and liver cells were dissociated mechanically using dedicated dissociation kits and gentleMACS dissociator (Miltenyi Biotec). Bone marrow cells were obtained by flushing tibia and femur with PBS, 2% fetal bovine serum, and 2 mM of EDTA. RBCs were removed from the suspension using ACK lysing buffer (Invitrogen). Cells were first incubated with anti-mouse CD16/CD32 clone 2.4G2 to block immunoglobulin G receptors (BD). Cells were then stained at 4°C using a panel of antibodies and analyzed by flow cytometry (supplemental Methods).
Statistics
Calculations for statistical differences between various groups were carried out using the analysis of variance technique and the Sidak, Tukey, or Kruskal-Wallis posttest to correct for multiple comparisons, as indicated in the figure legends. The Spearman test was used to assess correlation between SMEs and posttransfusion recovery in human volunteers and in ex vivo perfusion of human spleen. Otherwise, the 2-tailed paired Student t test was used. A P value <.05 was considered statistically significant. Statistical analyses were performed using Prism software (GraphPad).
Study approval
The study was conducted according to the Declaration of Helsinki, and all research participants provided written informed consent before study participation. The study was approved by the Columbia University Irving Medical Center and Institutional Review Board (#00001072). Human spleens were retrieved in the context of the Spleenvivo project approved by the “Ile-de-France II” Institutional Review Board on 4 September 2017 (#CPP 2015-02-05 SM2 DC). Animal experiments were conducted according to European Directives and were approved by the French Ministry of Education and Research (#12071-2017012712012626 v5).
Results
Accumulation of morphologically altered RBCs during storage
At the beginning of storage, scanning electron microscopic images showed that discocytes were abundant, and only a few morphologically altered RBCs could be observed (Figure 1Ai-ii). By 41 days of storage, morphologically altered RBCs were abundant, and fewer discocytes were observed (Figure 1Aiii-iv). RBC shapes, presented according to the Bessis classification,45 included discocytes, type I, II, and III echinocytes, spheroechinocytes, and spherocytes (Figure 1B); the last 3 categories composed the SME subpopulation.36 These qualitative observations confirm the evolution of RBC morphology during storage.22,30,46-48
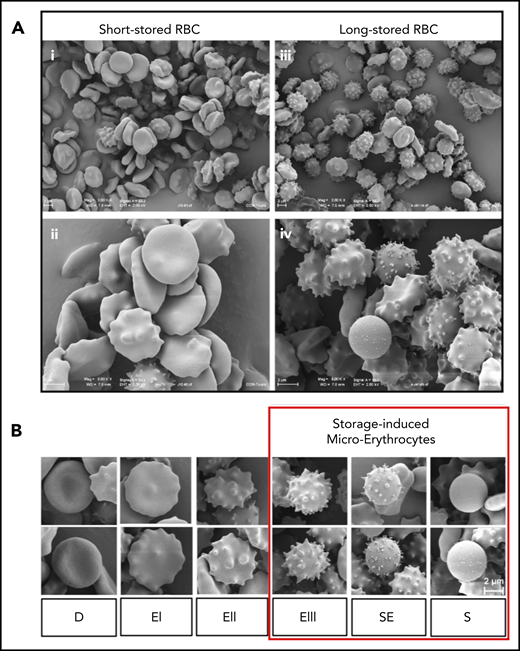
Accumulation of morphologically altered RBCs during storage. (A) Panoramic (×2000) (i) and detailed (×5000) (ii) views of short-stored RBC sample (day 12 of storage) containing a majority of discocytes (D) and type I (EI) or II echinocytes (EII), and panoramic (×2000) (iii) and detailed (×5000) (iv) views of long-stored RBC sample (day 41 of storage) containing abundant EIII, spheroechinocytes (SE), and spherocytes (S). (B) Representative scanning electron images of RBC shapes observed during storage in SAGM: D, EI, EII, EIII, SE, and S; numerically zoomed regions from 2000× acquisitions. Red square highlights morphologically altered RBCs defined as SMEs. Scale bars = 2 μM.
Accumulation of morphologically altered RBCs during storage. (A) Panoramic (×2000) (i) and detailed (×5000) (ii) views of short-stored RBC sample (day 12 of storage) containing a majority of discocytes (D) and type I (EI) or II echinocytes (EII), and panoramic (×2000) (iii) and detailed (×5000) (iv) views of long-stored RBC sample (day 41 of storage) containing abundant EIII, spheroechinocytes (SE), and spherocytes (S). (B) Representative scanning electron images of RBC shapes observed during storage in SAGM: D, EI, EII, EIII, SE, and S; numerically zoomed regions from 2000× acquisitions. Red square highlights morphologically altered RBCs defined as SMEs. Scale bars = 2 μM.
Proportions of SMEs at the end of storage display high interdonor variability
We quantified SMEs weekly throughout storage in 24 RBC concentrates collected from healthy human donors and stored in SAGM solution. For all donors, mean SMEs (range ± standard deviation [SD]) accumulation during storage ranged from 5.2% (1.1%-9.8% ± 2.4%) on day 3 to 24.6% (4.9%-68.1% ± 13.6%) on day 42, with marked interdonor variability (Figure 2A). We defined low- and high-SME RBC concentrates by cutoff proportions of SMEs < −1 SD and > +1 SD at the end of storage, respectively. Low- and high-SME concentrates accounted for 12.5% and 21% of RBC concentrates, respectively. These proportions of SMEs are broadly similar to the proportions of RBCs cleared in human posttransfusion recovery studies.20
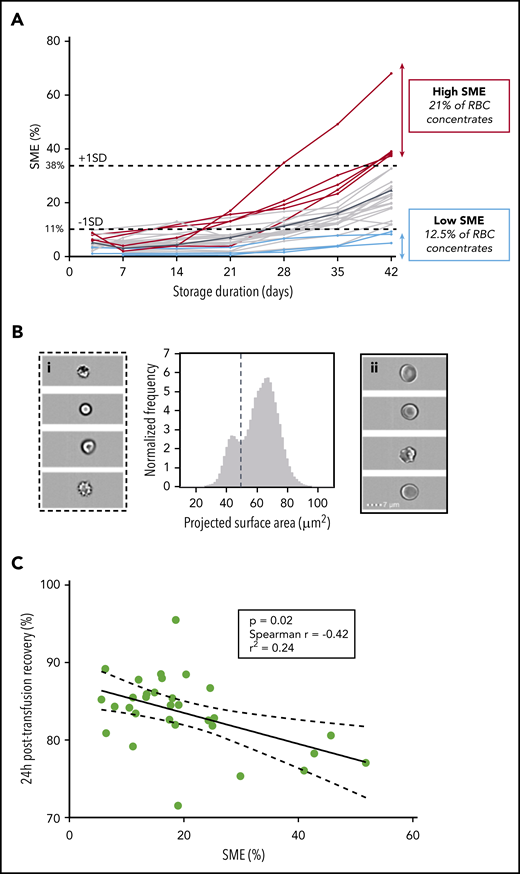
Proportion of SMEs at the end of storage correlates with 24-hour posttransfusion recovery in healthy human volunteers. (A) Quantification of SMEs upon storage of RBC concentrates in SAGM solution (n = 24) between days 3 and 42 (mean value in solid black line). Low (blue lines) and high proportions of SMEs (red lines) defined by proportions of SME < −1 SD (11%) and > +1 SD (38%) at the end of storage, respectively. (B) Representative normalized frequency plot for RBC concentrate at the end of storage in AS-3 showing a well-demarcated subpopulation of SMEs. Subpopulation of SMEs contains spherocytes, spheroechinocytes, and type III echinocytes (i), whereas normal-sized RBCs (ii) contain discocytes and type I and II echinocytes. (C) Correlation between 24-hour posttransfusion recovery and proportions of SMEs quantified by imaging flow cytometry at the end of storage (n = 31; P = .02; Spearman r = −0.42; r2 = 0.24).
Proportion of SMEs at the end of storage correlates with 24-hour posttransfusion recovery in healthy human volunteers. (A) Quantification of SMEs upon storage of RBC concentrates in SAGM solution (n = 24) between days 3 and 42 (mean value in solid black line). Low (blue lines) and high proportions of SMEs (red lines) defined by proportions of SME < −1 SD (11%) and > +1 SD (38%) at the end of storage, respectively. (B) Representative normalized frequency plot for RBC concentrate at the end of storage in AS-3 showing a well-demarcated subpopulation of SMEs. Subpopulation of SMEs contains spherocytes, spheroechinocytes, and type III echinocytes (i), whereas normal-sized RBCs (ii) contain discocytes and type I and II echinocytes. (C) Correlation between 24-hour posttransfusion recovery and proportions of SMEs quantified by imaging flow cytometry at the end of storage (n = 31; P = .02; Spearman r = −0.42; r2 = 0.24).
High proportions of SMEs in long-stored RBC concentrates correlate with poor transfusion recovery in healthy human volunteers
We examined correlation of pretransfusion proportions of SMEs in autologous RBC concentrates (stored in AS-3 or AS-1 for 42 days) with 24-hour posttransfusion recovery (using 51Chr-labeling procedure41 ) in 31 healthy volunteers. As observed with RBCs stored in SAGM solution, the projected surface area on normalized frequency plots displayed a bimodal distribution for all donors, enabling quantification of SMEs in each RBC concentrate (Figure 2B). Mean percentage of SMEs was 19.9%, and variability among volunteers was similarly wide, with extreme values of 6% and 52% (Figure 2C). Mean (range ± SD) 24-hour posttransfusion recovery was 83.5% (71.5%-95.5% ± 4.8%). One of the 31 volunteers had 24-hour posttransfusion recovery of 71.5%, which was below the US Food and Drug Administration guideline of 75%. The proportion of pretransfusion SMEs negatively correlated with 24-hour posttransfusion recovery (P = .02; Spearman r = −0.42; r2 = 0.24; Figure 2C). Mean posttransfusion recovery was significantly decreased (P = .03) in high-SME RBC concentrates (78%) when compared with low-SME RBC concentrates (85%).
Most SMEs are rapidly cleared upon ex vivo perfusion of human spleen
We quantified the persistence of long-stored RBCs (14 RBC concentrates stored for 35-42 days in SAGM solution) mixed with short-stored RBCs (stored for 3-12 days) in circulation during ex vivo perfusion of human spleen. The morphology of RBCs was similar in the perfusion medium and fresh plasma (supplemental Figure 1). RBCs were or were not rejuvenated using a procedure that improves intracellular ATP levels.49 Mean proportion of long-stored RBCs in circulation decreased by 14.6% (P < .01) in 70 minutes, with marked interdonor variability (Figure 3A). Rejuvenation restored the projected surface area of RBCs to a normal Gaussian distribution by imaging flow cytometry (similar to that observed at beginning of storage), decreased the proportion of SMEs (Figure 3B), and induced improvement in the circulatory lifespan that reached statistical significance at 1, 1.5, 2, 5, and 40 minutes of perfusion (P = .01, .003, .009, .03, and .02, respectively). The proportion of SMEs was also quantified during ex vivo perfusion. Projected surface area showed a bimodal distribution before perfusion and rapid clearance of SMEs (Figure 3C). The proportion of SMEs decreased during perfusion from a mean (range) of 20.0% (3.3%-36.1%) initially to 7.8% (2.2%-16.2%) at the end (P = .02; Figure 3D). The initial proportion of SMEs in untreated or rejuvenated RBC concentrates correlated with the mean retention rate in human spleen (P = .03; Spearman r = 0.5; Figure 3E). In contrast, in vitro storage hemolysis, intracellular ATP level, and deformability did not correlate with retention rate (supplemental Figure 2).

SMEs are rapidly cleared when perfused through human spleen ex vivo. (A) Kinetics (means ± standard errors of the mean) of the normalized concentration in the perfusate of human spleen ex vivo (n = 7) of 14 RBC concentrates stored for 35 to 42 days and rejuvenated (RW; dashed line) or not (NT; solid line). (B) Representative normalized frequency plot of the projected surface area of RBCs stored for 42 days before (solid red histogram) and after (dotted line) rejuvenation. Dashed vertical line defines the gating cutoff for SMEs. (C) Representative frequency plot of projected surface area of stored RBCs (37 days) before (red histogram) and at different time points after perfusion through human spleen ex vivo (0 minutes, solid blue line; 2 minutes, solid green line; 20 minutes, dotted black line; and 40 minutes, dashed orange line). (D) Proportion of SMEs at the beginning (T0) and mean proportion of SMEs at all observations between 40 and 70 minutes (T40-70min) of perfusion through human spleen ex vivo (n = 6; red dashed line represents mean). (E) Correlation between mean retention rate in human spleen perfused ex vivo and proportion of SMEs in the RBC concentrate before transfusion (n = 28; P = .03; Spearman r = 0.5; r2 = 0.2). *P < .05, **P < .01 by Sidak multiple comparisons test comparing, at each time point, the persistence in circulation of rejuvenated vs nontreated RBCs (A) or by paired Student t test comparing proportion of SMEs at T0 vs T40-70min (D).
SMEs are rapidly cleared when perfused through human spleen ex vivo. (A) Kinetics (means ± standard errors of the mean) of the normalized concentration in the perfusate of human spleen ex vivo (n = 7) of 14 RBC concentrates stored for 35 to 42 days and rejuvenated (RW; dashed line) or not (NT; solid line). (B) Representative normalized frequency plot of the projected surface area of RBCs stored for 42 days before (solid red histogram) and after (dotted line) rejuvenation. Dashed vertical line defines the gating cutoff for SMEs. (C) Representative frequency plot of projected surface area of stored RBCs (37 days) before (red histogram) and at different time points after perfusion through human spleen ex vivo (0 minutes, solid blue line; 2 minutes, solid green line; 20 minutes, dotted black line; and 40 minutes, dashed orange line). (D) Proportion of SMEs at the beginning (T0) and mean proportion of SMEs at all observations between 40 and 70 minutes (T40-70min) of perfusion through human spleen ex vivo (n = 6; red dashed line represents mean). (E) Correlation between mean retention rate in human spleen perfused ex vivo and proportion of SMEs in the RBC concentrate before transfusion (n = 28; P = .03; Spearman r = 0.5; r2 = 0.2). *P < .05, **P < .01 by Sidak multiple comparisons test comparing, at each time point, the persistence in circulation of rejuvenated vs nontreated RBCs (A) or by paired Student t test comparing proportion of SMEs at T0 vs T40-70min (D).
SMEs accumulate during storage in mouse model of RBC storage
We developed a mouse model of RBC storage and transfusion to assess the fate of SMEs in vivo and determine the main mechanisms of RBC clearance. Long-stored RBCs showed lower 24-hour posttransfusion recovery rate (61.9% ± 2.4%) compared with short-stored RBCs (94.7% ± 0.9%; P < .001; Figure 4A).
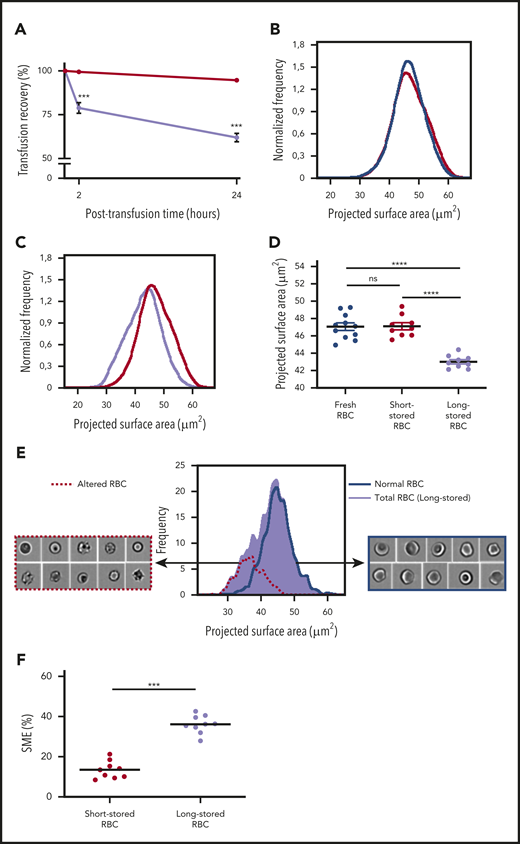
Identification and quantification of a subpopulation of SMEs in a mouse model. (A) Posttransfusion recovery of long-stored RBCs (14 days of storage; lavender line; n = 7) is decreased at 2 and 24 hours after transfusion to control recipients compared with short-stored RBCs (1 day of storage; red line; n = 7). (B) Normalized frequency plots of projected surface area for fresh (purple line; n = 11) and short-stored RBCs (red line; n = 9) show similar patterns. (C) Long-stored RBCs (lavender line; n = 9) have a reduced projected surface area compared with short-stored RBCs (red line). (D) Quantification of projected surface area of front views of focused RBCs obtained by imaging flow cytometry shows a significant decrease in long-stored RBCs. (E) Representative analysis of brightfield images of long-stored RBCs shows that morphologically altered RBCs (dashed red line) have a reduced projected surface area compared with RBCs with normal morphology (blue line). Morphologically altered RBCs defined as type III echinocytes, spheroechinocytes, spherostomatocytes, and spherocytes, whereas normal RBCs comprised discocytes and type I and II echinocytes. (F) SMEs in short- and long-stored RBCs accumulate during storage. Data are presented as means ± standard errors of the mean. ***P < .001, ****P < .0001 by Sidak multiple comparisons test comparing, at each time point, recovery of short- vs long-stored RBCs (A), by Tukey multiple comparisons test comparing projected surface area for each condition (D), or by Student t test comparing proportion of SMEs in short-stored vs long-stored RBC (F). ns, not significant.
Identification and quantification of a subpopulation of SMEs in a mouse model. (A) Posttransfusion recovery of long-stored RBCs (14 days of storage; lavender line; n = 7) is decreased at 2 and 24 hours after transfusion to control recipients compared with short-stored RBCs (1 day of storage; red line; n = 7). (B) Normalized frequency plots of projected surface area for fresh (purple line; n = 11) and short-stored RBCs (red line; n = 9) show similar patterns. (C) Long-stored RBCs (lavender line; n = 9) have a reduced projected surface area compared with short-stored RBCs (red line). (D) Quantification of projected surface area of front views of focused RBCs obtained by imaging flow cytometry shows a significant decrease in long-stored RBCs. (E) Representative analysis of brightfield images of long-stored RBCs shows that morphologically altered RBCs (dashed red line) have a reduced projected surface area compared with RBCs with normal morphology (blue line). Morphologically altered RBCs defined as type III echinocytes, spheroechinocytes, spherostomatocytes, and spherocytes, whereas normal RBCs comprised discocytes and type I and II echinocytes. (F) SMEs in short- and long-stored RBCs accumulate during storage. Data are presented as means ± standard errors of the mean. ***P < .001, ****P < .0001 by Sidak multiple comparisons test comparing, at each time point, recovery of short- vs long-stored RBCs (A), by Tukey multiple comparisons test comparing projected surface area for each condition (D), or by Student t test comparing proportion of SMEs in short-stored vs long-stored RBC (F). ns, not significant.
Morphological alterations of stored mouse RBCs were quantified by adapting the imaging flow cytometric approach previously applied to human RBCs. Projected surface area showed a Gaussian distribution for short-stored and fresh RBCs, the latter collected immediately before analysis (Figure 4B). The distribution of long-stored RBCs was shifted to the left, indicating that some RBCs lost projected surface area (Figure 4C). Mean projected surface area was 47.0 and 47.1 μm2 for fresh and short-stored RBCs, respectively; in contrast, it was significantly reduced to 43.0 μm2 for long-stored RBCs (P < .0001; Figure 4D). Morphological analysis of imaging flow cytometric brightfield images categorized long-stored RBCs into either altered RBCs (type III echinocytes, spheroechinocytes, spherostomatocytes, and spherocytes) or normal RBCs (type I and II echinocytes, stomatocytes, and discocytes). As shown in Figure 4E, altered RBCs had a mean projected area of 36.5 μm2 and corresponded to RBCs with a lower projected area, whereas RBCs categorized as normal had a profile similar to that of short-stored RBCs. In contrast to stored human RBCs, which showed a bimodal distribution, the 2 subpopulations of mouse RBCs overlapped on the projected area distribution profile in mice. Receiver operating characteristic analysis allowed determination of a gating threshold, set at 41 μm2, which enabled robust identification of altered RBCs (supplemental Figure 3). Using this threshold, the proportion of SMEs was 13.5% and 36.1% in short- and long-stored RBCs, respectively (P < .001; Figure 4F).
SMEs are rapidly cleared from circulation of transfused mice
Imaging flow cytometry was used to determine the fate of circulating long-stored RBCs posttransfusion. Transfused RBCs with reduced surface area were detected in circulation of recipients 5 minutes posttransfusion (Figure 5A). However, at 2 hours, an intermediate distribution profile was observed, and at 24 hours, the distribution profile of transfused RBCs was similar to that of fresh RBCs. SMEs were progressively cleared from circulation, declining from 30.5% at 5 minutes posttransfusion to 20.1% at 2 hours and 9.3% at 24 hours. When compared with the proportion observed in fresh RBCs (10.4%), the proportion of circulating SMEs at 5 minutes and 2 hours posttransfusion was significantly increased (P < .0001 and .05, respectively), whereas it was similar at 24 hours (Figure 5B). The decrease in 24-hour posttransfusion recovery of long-stored RBCs was mostly due to the clearance of SMEs, which had a markedly lower posttransfusion recovery (16.8%) than morphologically normal RBCs (86.8%; P < .0001; Figure 5C). Thus, ∼75% of transfused long-stored RBCs cleared from the circulation were SMEs.
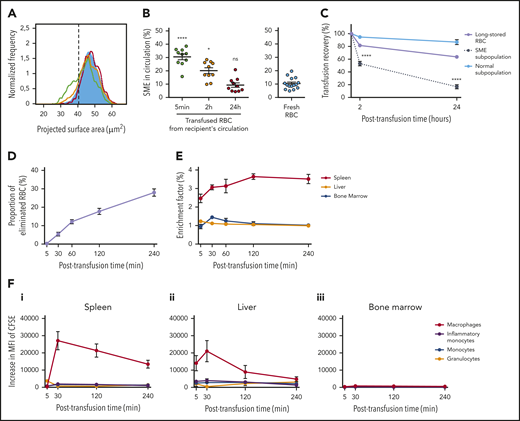
In the mouse model, SMEs are rapidly cleared, accumulate in the spleen, and are processed predominantly by macrophages. (A) Representative normalized frequency plot of projected surface area for long-stored mouse RBCs, as observed at 5 minutes (green line), 2 hours (yellow line), and 24 hours (red line) after transfusion to a syngeneic C57Bl/6 mouse. Control fresh RBCs from a nontransfused mouse (blue) are shown as reference. Dashed black vertical line defines the gating of SMEs. (B) Declining proportion of SMEs in circulation after transfusion (n = 10 mice per group). (C) Variable persistence in circulation of long-stored RBCs (lavender line) that contain the 2 complementary subpopulations of SMEs (black dotted line) and morphologically normal RBCs (light blue solid line), computed by combining flow cytometric and Imagestream data (n = 10 mice per group). (D) Proportion of long-stored RBCs that were cleared 5 to 240 minutes posttransfusion (n = 8 mice per time point). (E) EF 5 to 240 minutes posttransfusion (ratio of transfused CFSE+ RBCs in sliced organ/CFSE+ RBCs in venous blood; n = 4 mice per time point) in spleen (red line), liver (orange line), and bone marrow (blue line). (F) Posttransfusion erythrophagocytosis of RBCs in spleen (i), liver (ii), and bone marrow (iii), estimated by the increase in CFSE median fluorescence intensity (MFI) of macrophages (red lines), monocytes (blue lines), inflammatory monocytes (purple lines), and granulocytes (orange lines), compared with control nontransfused mice (n = 3 mice per time point). Data are presented as means ± standard errors of the mean. *P < .05, ****P < .0001 by Kruskal-Wallis test compared with fresh RBC condition (B) or by Sidak multiple comparisons test comparing, at each time point, recovery of SME subpopulation vs normal subpopulation (C).
In the mouse model, SMEs are rapidly cleared, accumulate in the spleen, and are processed predominantly by macrophages. (A) Representative normalized frequency plot of projected surface area for long-stored mouse RBCs, as observed at 5 minutes (green line), 2 hours (yellow line), and 24 hours (red line) after transfusion to a syngeneic C57Bl/6 mouse. Control fresh RBCs from a nontransfused mouse (blue) are shown as reference. Dashed black vertical line defines the gating of SMEs. (B) Declining proportion of SMEs in circulation after transfusion (n = 10 mice per group). (C) Variable persistence in circulation of long-stored RBCs (lavender line) that contain the 2 complementary subpopulations of SMEs (black dotted line) and morphologically normal RBCs (light blue solid line), computed by combining flow cytometric and Imagestream data (n = 10 mice per group). (D) Proportion of long-stored RBCs that were cleared 5 to 240 minutes posttransfusion (n = 8 mice per time point). (E) EF 5 to 240 minutes posttransfusion (ratio of transfused CFSE+ RBCs in sliced organ/CFSE+ RBCs in venous blood; n = 4 mice per time point) in spleen (red line), liver (orange line), and bone marrow (blue line). (F) Posttransfusion erythrophagocytosis of RBCs in spleen (i), liver (ii), and bone marrow (iii), estimated by the increase in CFSE median fluorescence intensity (MFI) of macrophages (red lines), monocytes (blue lines), inflammatory monocytes (purple lines), and granulocytes (orange lines), compared with control nontransfused mice (n = 3 mice per time point). Data are presented as means ± standard errors of the mean. *P < .05, ****P < .0001 by Kruskal-Wallis test compared with fresh RBC condition (B) or by Sidak multiple comparisons test comparing, at each time point, recovery of SME subpopulation vs normal subpopulation (C).
After transfusion, long-stored RBCs accumulate predominantly in the spleen and are mainly ingested by macrophages
Accumulation of transfused RBC was quantified in organs potentially involved in their clearance. Transfused RBC clearance from circulation was almost linear over a 4-hour period (Figure 5D). Organ accumulation of RBCs was measured by dividing the proportion of transfused RBCs in organs by the proportion of transfused RBCs simultaneously present in circulation, a ratio expressed as EF. Long-stored RBCs accumulated in the spleen as early as 5 minutes after transfusion (EF, 2.5), with a peak at 2 hours (EF, 3.6), followed by a plateau phase up to 4 hours (EF, 3.5; Figure 5E). In the liver, EF remained low, whereas in the bone marrow, it reached a maximum after 30 minutes (EF, 1.4). Erythrophagocytic cells in these organs were identified by quantifying their increase in CFSE fluorescence after transfusion. In the spleen, the increase in CFSE fluorescence in red pulp macrophages reached a maximum at 30 minutes (MFI, 27 092 ± 5299) and remained strong up to 4 hours posttransfusion (MFI, 13 454 ± 2295; Figure 5Fi). The maximum increase in CFSE fluorescence was mild in inflammatory monocytes (MFI, 1906 ± 443 at 30 minutes), monocytes (MFI, 1624 ± 334 at 30 minutes), and granulocytes (MFI, 3698 ± 687 at 5 minutes). Liver Kupffer cells also exhibited increased CFSE fluorescence, reaching a maximum at 30 minutes (MFI, 21 023 ± 6148), which declined by 4 hours after transfusion (Figure 5Fii). Mild erythrophagocytosis was detected in the bone marrow (Figure 5Fiii).
SME clearance is delayed in macrophage-depleted recipients
In clodronate-treated recipients, the projected surface area of circulating RBCs was similar at 5 minutes and 2 hours after transfusion, indicating a delay in clearance of RBCs with altered morphology (Figure 6A). At 24 hours, the distribution profile of RBCs transfused into clodronate-treated recipients was similar to that of fresh RBCs. The proportion of SMEs in circulation was relatively stable over 2 hours (32.4% and 28.6% at 5 minutes and 2 hours posttransfusion, respectively) but decreased at 24 hours (12.4%; Figure 6B). The proportion of circulating SMEs at 5 minutes and 2 hours was significantly increased (P < .0001 and .001, respectively) compared with fresh RBCs. In clodronate-treated recipients, 24-hour posttransfusion recovery of long-stored RBCs was increased (79.4%) compared with controls (61.9%; P < .0001; Figure 6C). Similarly to control mice (Figure 4C), the SME subpopulation was preferentially cleared (24-hour posttransfusion recovery, 28.5%), whereas the proportion of morphologically normal RBCs remained stable (P < .0001; Figure 6D). PBS liposome–treated recipients demonstrated posttransfusion morphology, SME clearance, and recovery similar to those observed in control recipients (supplemental Figure 4).

Clearance kinetics of SMEs in clodronate-treated mice. (A) Representative normalized frequency plots of projected surface area for long-stored mouse RBCs, as observed 5 minutes (green line), 2 hours (yellow line), and 24 hours (red line) after transfusion of a clodronate-treated mouse. Control fresh RBCs from a nontransfused mouse (blue) are shown as reference. Dashed black vertical line defines gating of SME. (B) Delayed clearance of SMEs in circulation after transfusion in clodronate-treated mice (n = 10 per group). (C) Posttransfusion recovery of long-stored RBCs is increased at 2 and 24 hours after transfusion to clodronate-treated recipients (dashed line; n = 10) compared with controls (solid line; n = 10). (D) Variable persistence in circulation of long-stored RBCs (lavender dashed line) that contain the 2 complementary subpopulations of SMEs (black dotted line) and morphologically normal RBCs (light blue solid line), computed by combining flow cytometric and Imagestream data after transfusion in clodronate-treated mice (n = 10 per group). (E) Decreased proportion of long-stored RBCs that were cleared 60 to 240 minutes posttransfusion in clodronate-treated recipients (dashed line; n = 6 mice per time point) compared with controls (solid line; n = 8 mice per time point). (F) EF (ratio of transfused CFSE+ RBCs in sliced organ/CFSE+ RBCs in venous blood) 5 to 240 minutes posttransfusion in spleen (red line), liver (orange line), and bone marrow (blue line) after transfusion in clodronate-treated mice (n = 3 mice per time point). (G) Posttransfusion erythrophagocytosis of RBCs in spleen (i) and liver (ii), estimated by the increase in MFI of CFSE in monocytes (blue lines), inflammatory monocytes (purple lines), and granulocytes (orange lines) in clodronate-treated recipients compared with control nontransfused mice (n = 3 mice per time point). Data are presented as means ± standard errors of the mean. **P < .01, ***P < .001, ****P < .0001 by Kruskal-Wallis test compared with fresh RBC condition (B), by Sidak multiple comparisons test comparing, at each time point, recovery (clearance) in clodronate-treated vs control recipients (C,E), and by Sidak multiple comparisons test comparing, at each time point, recovery of SME subpopulation vs normal subpopulation (D).
Clearance kinetics of SMEs in clodronate-treated mice. (A) Representative normalized frequency plots of projected surface area for long-stored mouse RBCs, as observed 5 minutes (green line), 2 hours (yellow line), and 24 hours (red line) after transfusion of a clodronate-treated mouse. Control fresh RBCs from a nontransfused mouse (blue) are shown as reference. Dashed black vertical line defines gating of SME. (B) Delayed clearance of SMEs in circulation after transfusion in clodronate-treated mice (n = 10 per group). (C) Posttransfusion recovery of long-stored RBCs is increased at 2 and 24 hours after transfusion to clodronate-treated recipients (dashed line; n = 10) compared with controls (solid line; n = 10). (D) Variable persistence in circulation of long-stored RBCs (lavender dashed line) that contain the 2 complementary subpopulations of SMEs (black dotted line) and morphologically normal RBCs (light blue solid line), computed by combining flow cytometric and Imagestream data after transfusion in clodronate-treated mice (n = 10 per group). (E) Decreased proportion of long-stored RBCs that were cleared 60 to 240 minutes posttransfusion in clodronate-treated recipients (dashed line; n = 6 mice per time point) compared with controls (solid line; n = 8 mice per time point). (F) EF (ratio of transfused CFSE+ RBCs in sliced organ/CFSE+ RBCs in venous blood) 5 to 240 minutes posttransfusion in spleen (red line), liver (orange line), and bone marrow (blue line) after transfusion in clodronate-treated mice (n = 3 mice per time point). (G) Posttransfusion erythrophagocytosis of RBCs in spleen (i) and liver (ii), estimated by the increase in MFI of CFSE in monocytes (blue lines), inflammatory monocytes (purple lines), and granulocytes (orange lines) in clodronate-treated recipients compared with control nontransfused mice (n = 3 mice per time point). Data are presented as means ± standard errors of the mean. **P < .01, ***P < .001, ****P < .0001 by Kruskal-Wallis test compared with fresh RBC condition (B), by Sidak multiple comparisons test comparing, at each time point, recovery (clearance) in clodronate-treated vs control recipients (C,E), and by Sidak multiple comparisons test comparing, at each time point, recovery of SME subpopulation vs normal subpopulation (D).
Organ accumulation and phagocytosis of long-stored RBCs and SMEs in macrophage-depleted or splenectomized mice
In clodronate-treated recipients, early clearance of long-stored RBCs was delayed and significantly reduced at 1 (P < .01), 2, and 4 hours compared with controls (P < .0001; Figure 6E). In the spleen, EF remained <1.3 during the first hour posttransfusion and then reached 2.1 at 4 hours (Figure 6F). No enrichment was observed in the liver or bone marrow. In the spleen of these macrophage-depleted recipients, erythrophagocytosis was observed in monocytes and inflammatory monocytes, in particular (Figure 6Gi). Similarly, in the liver, strong erythrophagocytosis was observed in monocytes and inflammatory monocytes (Figure 6Gii). In the bone marrow, there was only a mild increase in CFSE fluorescence (data not shown).
In splenectomized mice, the surface area of transfused RBCs returned to normal at the same rate as in controls and sham-splenectomized mice (Figure 7A; supplemental Figure 4). Accordingly, SME clearance kinetics were similar in splenectomized recipients and controls (Figure 7B). Although SME clearance was not delayed or decreased in splenectomized recipients, 24-hour posttransfusion recovery of long-stored RBCs was increased (73.7%) compared with controls (61.9%; P < .001; Figure 7C). The main determinant of 24-hour posttransfusion recovery was the clearance of SMEs, which showed low posttransfusion recovery (22.5%) compared with normal RBCs (98.5%; P < .0001; Figure 7D), indicating that ∼96% of the transfused long-stored RBCs cleared from circulation were SMEs. Early clearance of long-stored RBCs also decreased in splenectomized mice (P < .01; Figure 7E), with low retention observed in the liver and bone marrow (Figure 7F). Early erythrophagocytosis was detected in Kupffer cells and granulocytes (Figure 7Gi). Mild erythrophagocytosis was detected in the bone marrow (Figure 7Gii).

Clearance kinetics of SMEs in splenectomized mice. (A) Typical normalized frequency plots of projected surface area for long-stored mouse RBCs, as observed 5 minutes (green line), 2 hours (yellow line), and 24 hours (red line) after transfusion to a splenectomized mouse. Control fresh RBCs from a nontransfused mouse (blue) are shown as reference. Dashed black vertical line defines gating of SME. (B) Delayed clearance of SMEs in circulation after transfusion in splenectomized mice (n = 10 per group). (C) Posttransfusion recovery of long-stored RBCs is increased at 24 hours after transfusion to splenectomized recipients (dashed line; n = 10) compared with controls (solid line; n = 10). (D) Variable persistence in circulation of long-stored RBCs (lavender dashed line) that contain the 2 complementary subpopulations of SMEs (black dotted line) and morphologically normal RBCs (light blue solid line), computed by combining flow cytometric and Imagestream data, after transfusion in splenectomized mice (n = 10 per group). (E) Decreased proportion of long-stored RBCs that were cleared at 240 minutes posttransfusion in splenectomized recipients (dashed line; n = 6 mice per time point) compared with controls (solid line; n = 8 mice per time point). (F) EF (ratio of transfused CFSE+ RBCs in sliced organ/CFSE+ RBCs in venous blood) 5 to 240 minutes posttransfusion in liver (orange line) and bone marrow (blue line) after transfusion in splenectomized mice (n = 3 mice per time point). (G) Posttransfusion erythrophagocytosis of RBCs in liver (i) and bone marrow (ii), estimated by the increase in MFI of CFSE in macrophages (red lines), monocytes (blue lines), inflammatory monocytes (purple lines), and granulocytes (orange lines) in splenectomized recipients compared with control nontransfused mice (n = 3 mice per time point). Data are presented as means ± standard errors of the mean. *P < .05, **P < .01, ***P < .001, ****P < .0001 by Kruskal-Wallis test compared with fresh RBC condition (B), by Sidak multiple comparisons test comparing, at each time point, recovery (clearance) in splenectomized vs control recipients (C,E), and by Sidak multiple comparisons test comparing, at each time point, recovery of SME subpopulation vs normal subpopulation (D).
Clearance kinetics of SMEs in splenectomized mice. (A) Typical normalized frequency plots of projected surface area for long-stored mouse RBCs, as observed 5 minutes (green line), 2 hours (yellow line), and 24 hours (red line) after transfusion to a splenectomized mouse. Control fresh RBCs from a nontransfused mouse (blue) are shown as reference. Dashed black vertical line defines gating of SME. (B) Delayed clearance of SMEs in circulation after transfusion in splenectomized mice (n = 10 per group). (C) Posttransfusion recovery of long-stored RBCs is increased at 24 hours after transfusion to splenectomized recipients (dashed line; n = 10) compared with controls (solid line; n = 10). (D) Variable persistence in circulation of long-stored RBCs (lavender dashed line) that contain the 2 complementary subpopulations of SMEs (black dotted line) and morphologically normal RBCs (light blue solid line), computed by combining flow cytometric and Imagestream data, after transfusion in splenectomized mice (n = 10 per group). (E) Decreased proportion of long-stored RBCs that were cleared at 240 minutes posttransfusion in splenectomized recipients (dashed line; n = 6 mice per time point) compared with controls (solid line; n = 8 mice per time point). (F) EF (ratio of transfused CFSE+ RBCs in sliced organ/CFSE+ RBCs in venous blood) 5 to 240 minutes posttransfusion in liver (orange line) and bone marrow (blue line) after transfusion in splenectomized mice (n = 3 mice per time point). (G) Posttransfusion erythrophagocytosis of RBCs in liver (i) and bone marrow (ii), estimated by the increase in MFI of CFSE in macrophages (red lines), monocytes (blue lines), inflammatory monocytes (purple lines), and granulocytes (orange lines) in splenectomized recipients compared with control nontransfused mice (n = 3 mice per time point). Data are presented as means ± standard errors of the mean. *P < .05, **P < .01, ***P < .001, ****P < .0001 by Kruskal-Wallis test compared with fresh RBC condition (B), by Sidak multiple comparisons test comparing, at each time point, recovery (clearance) in splenectomized vs control recipients (C,E), and by Sidak multiple comparisons test comparing, at each time point, recovery of SME subpopulation vs normal subpopulation (D).
Discussion
We found that the proportion of small spherocytic RBCs that accumulated during storage correlated with posttransfusion RBC recovery in healthy human volunteers (using the gold standard of 51Chr labeling) and with retention rate in human spleen perfused ex vivo. In a mouse RBC storage and transfusion model, we also observed the accumulation of SMEs and confirmed that they were rapidly cleared from circulation after transfusion. In both humans and mice, the spleen contributed to SME clearance from circulation. We found that SMEs progressively accumulated upon storage in commonly used preservation solutions and accounted for 20% to 25% of the entire RBC population after 6 weeks of storage.36,50 Only a subpopulation of RBCs was severely altered during storage, possibly corresponding to the older RBC component present in the concentrate at the beginning of storage.51,52 On the basis of these observations, the spherocytic shift of stored RBCs should be considered a mechanism of suboptimal transfusion recovery in humans. Thus, quantification of SMEs becomes a potentially powerful predictor of RBC storage quality and transfusion recovery. Indeed, the proportion of SMEs at the end of storage displayed wide interindividual variability, which may have contributed to the similarly wide variation in posttransfusion recovery observed previously in healthy human volunteers and patients.17,18,20,23
Time-dependent decrease in circulating SMEs can result from extravascular clearance, intravascular hemolysis, or restoration of morphology (if SMEs revert to normal morphology while circulating). In macrophage-depleted mice, SMEs persisted in circulation for at least 2 hours, suggesting that simple morphological reversibility in circulation is not a major contributor to the rapid clearance observed in macrophage-intact recipients. We also showed that SME morphology was stable when suspended in fresh plasma.
Posttransfusion recovery results in macrophage-depleted mice suggest that most RBCs cleared from circulation are SMEs. The mouse in vivo erythrophagocytosis experiments identified splenic red pulp macrophages and hepatic Kupffer cells as important cells in this posttransfusion phagocytic process. That splenic and hepatic macrophages were the main erythrophagocytic cells in mice agrees with previous reports,53,54 along with the increased susceptibility of long-stored RBCs to macrophage phagocytosis in vitro.55 Little is known about the role of macrophages in clearance of transfused RBCs in humans, although 1 study showed increased phagocytosis of long-stored RBCs in vitro,56 and another suggested that the liver and spleen are the predominant organs involved.57 Although it cannot be excluded that some long-stored RBCs undergo intravascular destruction, converging data from mouse models strongly suggest that, as in humans,23 the decreased posttransfusion recovery of long-stored RBCs depends predominantly on their extravascular hemolysis.
In our murine model, long-stored RBCs accumulated in the spleen, likely by mechanical filtration.58 The simultaneous accumulation of long-stored RBCs in erythrophagocytic organs coupled with their disappearance from circulation suggests that retention of long-stored RBCs participates in their elimination. The clearance of morphologically normal RBCs, mainly observed in control recipients, could be due to proerythrophagocytic conditions induced by the accumulation of transfused RBCs in the spleen. This clearance-enhancing mechanism, called the bystander effect, has been observed in other situations, such as malaria.59,60 SME clearance was not affected by splenectomy in mice but was delayed by macrophage depletion, indicating that phagocytosis is indispensable and that the liver or other organs, like the kidney or lung, that were not investigated here may compensate for splenic clearance.
Type III echinocytes and spheroechinocytes progressively lose membrane content through budding of microvesicles from their spicules.61,62 This process also occurs upon exposure of RBCs to low pH, low ATP concentrations, and high concentrations of calcium.62 In the context of pretransfusion refrigerated storage, this shape change is slowed by resuspension of RBCs in a large volume of solution.63,64 Because SMEs irreversibly lose more surface than volume upon vesiculation, they no longer display the advantageous surface/volume ratio that enables normal discocytes to readily deform and cross the narrow slits in the spleen.65,66 When perfused ex vivo with human RBCs, human spleen cleared SMEs from circulation in 2 phases. The initial phase occurred within 2 minutes of perfusion, and the second occurred between 10 and 20 minutes of perfusion. This 2-step process suggests the involvement of distinct and successive mechanisms of clearance. RBC adherence to endothelial cells could be involved in the first phase. Previous observations have suggested that this type of adherence happens rapidly,67 whereas the timing of the second phase is compatible with biomechanical retention of SMEs upstream of narrow splenic slits. Whether the second phase relies predominantly on biomechanical retention or phagocytosis by resident macrophages remains to be determined.
The specific alterations of SMEs that induce their elimination was not definitely determined. In addition to their proadhesive properties68 and presumed reduced deformability, SMEs may also overexpress prophagocytic “eat me” surface markers, such as phosphatidylserine or clustered band 3, or conversely underexpress “don’t eat me” signals, such as CD47.69-71 The fact that rejuvenation decreases both the proportion of SMEs and RBC clearance in the human spleen model also supports the adherence and biomechanical retention hypothesis, because rejuvenation reduces adherence of stored RBCs to endothelial cells and improves their filterability in a biomimetic splenic filter.68
The extent of storage lesions varies between human blood donors and between mouse strains.18,20,72 One possible explanation is that RBCs from good storers may withstand the metabolic stress of storage more robustly than RBCs from poor storers.73 In addition, storage duration is a crude and potentially misleading indicator of RBC quality, because metabolic age likely differs from chronological age. In the future, more relevant markers should thus better predict RBC clearance. The 24-hour posttransfusion recovery of 51Chr-labeled RBCs in healthy volunteers is still the gold standard for US Food and Drug Administration approval of any new process for preparing and storing RBC concentrates,20 but this method and other analogous methods do not recapitulate all the conditions of standard allogeneic RBC transfusion.74 In addition, posttransfusion recovery studies using 51Chr-labeled RBCs are technically challenging, expensive, and only performed at a few centers. Furthermore, the reliability of the method was recently questioned.57 Quantification of SMEs requires access to imaging flow cytometric technology but is otherwise a label-free, operator-independent, quantitative, reproducible, and reasonably simple method. Data presented here show that 21% of donors had high SME levels at day 42, potentially identifying them as poor storers. Similarly, 12.5% of donors exhibited low SME levels at day 42, potentially identifying them as good storers. This could be relevant for public health; for example, in France, 3.4% of RBC concentrates are transfused after storage day 35, which represents 78 000 individual transfusions per year. In addition, the proportion of such transfused RBC units may be even higher in the United States, reaching 10% to 20% by some estimates.75 Moreover, at the median time of RBC concentrate delivery in France (16-20 days of storage), high interdonor variability is already noticeable.
If a decrease in recovery is not expected to cause serious consequences in the acute transfusion setting, it could have a major impact in chronically transfused patients, such as those with sickle cell disease, thalassemia, or low-risk myelodysplastic syndrome. For example, transfusion-related iron overload is a major cause of morbidity and mortality in these patients, and the need to provide more transfusions because some are of lower quality or recovery could have significant adverse consequences. In the future, quantifying SMEs could be a surrogate measure for transfusion recovery when assessing promising alternative storage solutions, such as AS-776 ; new manufacturing processes, such as hypoxic storage77 ; or donor-related factors that contribute to storage quality, such as those identified in REDS-III78 and other26 studies. These innovations could reduce or abrogate the transfusion of lower-quality products, with potential benefit for chronically transfused patients in whom improved transfusion recovery would be expected to decrease the degree of iron overload.
For original data, please contact pascal.amireault@inserm.fr.
The online version of this article contains a data supplement.
The publication costs of this article were defrayed in part by page charge payment. Therefore, and solely to indicate this fact, this article is hereby marked “advertisement” in accordance with 18 USC section 1734.
Acknowledgments
The authors thank Etablissement Français du Sang Haut de France-Normandie for providing RBC concentrates.
This work was supported by state funding from the Agence Nationale de la Recherche under the “Investissements d’avenir” program (ANR-10-IAHU-01, ANR-11-LABX-0051, and ANR-18-IDEX-0001); the Fondation Bettencourt Schueller; the National Heart, Lung and Blood Institute, National Institutes of Health, grants R01HL133049 and HL148151; and Zimmer Biomet. A. Morel was supported by an Imagine Institute PhD scholarship. C.R., M. Colard, and M. Casimir were supported by a scholarship from the Laboratory of Excellence GR-Ex. C.R. was supported by a scholarship from the Société Française d’Hématologie.
Authorship
Contribution: C.R., A. Morel, M. Dussiot, M.M., M. Colard, A.F.-M., A. Martinez, C.C., B.H., M. Casimir, G.V., M. Dépond, S.G., E.A.H., and P.A. performed experiments; C.R., A. Morel, M. Dussiot, M.M., M. Colard, A.F.-M., A. Martinez, C.C., B.H., M. Casimir, G.V., M. Dépond, C.L.V.K., Y.C., S.G., P.R., S.L.S., P.A.N., O.H., E.A.H., P.A.B., and P.A. analyzed the data; S.D., F.P., and A.S. provided human spleens; C.R., A. Morel, M. Dussiot, P.A.N., S.L.S., O.H., E.A.H., P.A.B., and P.A. designed the research; C.R., A. Morel, M. Dussiot, P.A.B., and P.A. wrote the manuscript; S.L.S. and E.A.H. edited the manuscript; and all authors read and approved the manuscript.
Conflict-of-interest disclosure: P.A.B. and P.A. are funded in part by Zimmer Biomet. The remaining authors declare no competing financial interests.
Correspondence: Pascal Amireault, Institut National de la Transfusion Sanguine, 6 Rue Alexandre Cabanel, F-75015 Paris, France; e-mail: pascal.amireault@inserm.fr; and Pierre A. Buffet, Institut National de la Transfusion Sanguine, 6 Rue Alexandre Cabanel, F-75015 Paris, France; e-mail: pabuffet@gmail.com.
