

Key Points
The 12-month cumulative incidence of VTE is currently 3% after cancer diagnosis, which is ninefold higher than in the general population.
For the past 2 decades, cancer patients’ VTE risk increased threefold overall and sixfold in those using chemotherapy or targeted therapy.

Abstract
The incidence of venous thromboembolism (VTE) in cancer patients may have changed in the past decade, possibly due to novel cancer therapies, improved survival, and high-resolution imaging. Danish medical registries were used to identify 499 092 patients with a first-time cancer diagnosis between 1997 and 2017, who were matched to 1 497 276 comparison individuals without cancer from the general population. We computed cumulative incidences of VTE 6 and 12 months after the diagnosis/index date. Hazard ratios (HRs) were calculated using Cox regression. Risk factors were examined by computing subdistribution hazard ratios (SHRs) in a competing-risk analysis. Cumulative incidence of VTE 12 months after the cancer diagnosis/index date was 2.3% (95% confidence interval [CI], 2.2% to 2.3%) in the cancer cohort and 0.35% (95% CI, 0.34% to 0.36%) in the comparison cohort (HR, 8.5; 95% CI, 8.2-8.8). Important risk factors for cancer patients were prior VTE (SHR, 7.6; 95% CI, 7.2-8.0), distant metastasis (SHR, 3.2; 95% CI, 2.9-3.4), and use of chemotherapy (SHR, 3.4; 95% CI, 3.1-3.7), protein kinase inhibitors (SHR, 4.1; 95% CI, 3.4-4.9), antiangiogenic therapy (SHR, 4.4; 95% CI, 3.8-5.2), and immunotherapy (SHR, 3.6; 2.8-4.6). Twelve-month incidence in the cancer cohort increased from 1.0% (95% CI, 0.9% to 1.2%) in 1997 to 3.4% (95% CI, 2.9% to 4.0%) in 2017, which was paralleled by improved 12-month survival and increased use of computed tomography scans, chemotherapy, and targeted therapies. In conclusion, the risk of VTE in cancer patients is increasing steadily and is ninefold higher than in the general population.
Introduction
Cancer patients are at increased risk of venous thromboembolism (VTE), as has been well established since 1823.1 VTE is associated with interruption of cancer treatment, decreased quality of life, and increased morbidity and mortality, all leading to increased health care costs.2-5 Cancer treatment has evolved rapidly in recent years. Novel cancer therapies and the increased diagnostic modalities led to improved survival for cancer patients, but may have affected the risk and burden of cancer-associated VTE.6-8
Large population-based health care registries often are considered the gold standard for estimating disease incidences, such as cancer-associated VTE.9-15 However, recent estimates of VTE incidence in the cancer population are lacking. Hence, recent developments in cancer treatment and their impact on cancer-associated VTE remain to be taken into account. Several previous studies also may have overestimated the risk by using naive survival analysis techniques, not taking into account the competing risk of death.16
Therefore, we aimed to provide valid up-to-date estimates of the incidence of cancer-associated VTE by evaluating data from Danish population-based health registries, using a competing-risk approach. In addition, we evaluated time trends in incidence and risk factors for cancer-associated VTE.
Methods
Danish registries
All Danish residents are included in national population-based health and administrative registries, which contain a broad range of health care data.17 The civil personal registration number, a unique identification number assigned to each Danish resident, makes it possible to link data from these registries. The Danish registries provide complete and high-quality data with a positive predictive value of 88% or higher for VTE.18,19
Cancer and general population comparison cohorts
The Danish Cancer Registry (DCR) records cancer-specific health care data and was used to construct a cancer cohort in which all residents aged 18 years or older in Denmark with a first-time diagnosis of solid cancer, multiple myeloma, Hodgkin lymphoma, non-Hodgkin lymphoma, or leukemia between 1997 and 2017 were included.20 Nonmelanoma skin cancer was excluded. A comparison cohort was constructed by selecting 3 comparison individuals from the general population for each cancer patient by using the Civil Registration System, which tracks the vital status of all Danish residents.19 Comparison individuals were randomly selected with replacement and matched to each cancer patient by sex, year of birth, and calendar year. Comparison individuals had to be alive and free of cancer on their matched patient’s cancer diagnosis date (defined as the index date).
Study outcomes and follow-up
The Danish National Patient Registry (DNPR) was used to retrieve information of study outcomes. The DNPR contains primary and secondary discharge diagnosis data from all Danish nonpsychiatric hospitals since 1977 and from emergency room and outpatient clinic visits since 1995, classified according to the International Classification of Diseases.21 The main study outcome was any primary or secondary inpatient or outpatient clinic diagnosis of VTE, including deep vein thrombosis (DVT), pulmonary embolism (PE), abdominal thrombosis, and other VTE events.22 Superficial thrombophlebitis was not included as an outcome given its different treatment and clinical relevance. Cancer patients and comparison individuals were followed from their cancer diagnosis/index date until their first VTE diagnosis, death, emigration, loss to follow-up, or end of data collection (31 December 2017) for a maximum of 5 years. If a comparison individual was diagnosed with cancer, follow-up was stopped and the individual was shifted to the cancer cohort. To explore the period prevalence of VTE in the 6 months prior to cancer diagnosis/index date, a separate analysis was performed in which cancer patients and comparison individuals were followed starting 6 months before the cancer diagnosis/index date. Fatal VTE events preceding the cancer diagnosis/index date were not included in this analysis by definition.
Covariates
The following covariates, considered potential confounding factors, were identified from the DNPR from 1977 onward: congestive heart failure, atherosclerosis and peripheral vascular disease, chronic obstructive pulmonary disease, inflammatory bowel disease, liver disease, renal disease, diabetes, obesity, alcoholism and alcoholism-related conditions, and hypertension. Charlson Comorbidity Index scores, excluding the comorbidities listed in the previous sentence, were also considered to be a potential confounder.23 Cancer stage at time of cancer diagnosis was retrieved from the DCR. Information about cancer treatment in the first 4 months after diagnosis, including surgical procedures, chemotherapy, hormonal therapy, and radiotherapy, was obtained from the DCR until 2004, and from the DNPR thereafter.21 From 2004 onward, detailed information on targeted therapies could be retrieved from the DNPR. Data of anticoagulant use was obtained from the Danish National Prescription Registry, which contains data on all prescription drugs sold in Danish pharmacies.24
Statistical analysis
Members of the 2 cohorts were categorized by age group, sex, calendar period, cancer stage, cancer treatment, Charlson Comorbidity Index score, and previous VTE history. Cumulative incidences with 95% confidence intervals (CIs) were computed using the competing-risk approach, in which death was regarded as a competing outcome event to VTE.25 Incidence rates and 95% CIs were calculated per 1000 person-years of follow-up. All outcomes were evaluated for the 6 months preceding the cancer diagnosis/index date and for 6 and 12 months after the cancer diagnosis/index date. Time-to-event curves were constructed based on the competing-risk analysis.25 VTE events diagnosed concurrently with a cancer diagnosis were included in the 6-month period prior to cancer diagnosis, and not in the 6- and 12-month follow-up analyses.
Relative-risk differences between the cohorts were evaluated by calculating hazard ratios (HRs) using Cox proportional hazards regression analysis. To evaluate potential risk factors for VTE in the cancer cohort, cause-specific HRs were adjusted for matching factors by study design and for the covariates listed in “Covariates.” In addition, subdistribution HRs (SHRs) were computed using the Fine-Gray competing-risk regression model. Second, the risk-factor analyses were adjusted for age, sex, prior VTE, cancer stage, and cancer type (categorized for VTE risk according to the Khorana score classification). No major violation of the proportional hazards assumption was observed by visual inspection of log-minus-log plots.
To examine the association between VTE and systemic cancer treatment from 2004 onward, VTE incidence was computed separately for patients who received no treatment, chemotherapy, or targeted therapies (comprising protein kinase inhibitors, antiangiogenic therapy, immunotherapy, and other targeted therapies) during the first 4 months after cancer diagnosis. To provide contemporary information on risk of cancer-associated VTE, study outcomes were assessed for patients diagnosed with cancer between 2011 and 2017, and for the group that received chemotherapy or targeted therapy in the first 4 months after cancer diagnosis in this period. In a secondary analysis, DVT and PE were evaluated separately. In a sensitivity analysis, the outcome was restricted to an inpatient diagnosis, which has a higher positive predictive value.18 A time-trend analysis was performed to evaluate changes in VTE incidence and several VTE risk factors over time, using the Jonckheere-Terpstra test to assess significance (P < .05).26 The diagnostic codes used in the analyses are presented in supplemental Table 1 (available on the Blood Web site) and the categorization of systemic cancer therapies in supplemental Table 2. All statistical analyses were performed using SAS version 9.4 (SAS Institute, Cary, NC).
Results
Cancer and general population–comparison cohorts
A total of 499 092 patients with a first-time diagnosis of cancer were included in the analysis. Median age was 68 years (interquartile range, 59-76 years) and 253 745 patients (51%) were female. Of the cancer cohort, 294 392 patients (59%) underwent cancer surgery during the first 4 months after cancer diagnosis, 83 107 (17%) received radiotherapy, 44 532 (8.9%) (anti)hormonal therapy, 136 199 (27%) chemotherapy, 21 161 (4.2%) targeted therapy, and 109 130 (22%) received no treatment. The comparison cohort comprised 1 497 276 individuals with similar baseline characteristics (Table 1).
Baseline characteristics of the cancer and comparison cohorts, Denmark, 1997-2017
| Cancer cohort, N = 499 092 | Comparison cohort, N = 1 497 276 | |
|---|---|---|
| Female, n (%) | 253 745 (50.8) | 761 235 (50.8) |
| Age, median (IQR), y | 68 (59-76) | 68 (59-76) |
| Age, y | ||
| <50 | 54 380 (10.9) | 163 140 (10.9) |
| 50-59 | 77 578 (15.5) | 232 734 (15.5) |
| 60-69 | 140 134 (28.1) | 420 402 (28.1) |
| 70-79 | 142 131 (28.5) | 426 393 (28.5) |
| ≥80 | 84 869 (17.0) | 254 607 (17.0) |
| Year of cancer diagnosis/index date, n (%) | ||
| 1997-2003 | 137 581 (27.6) | 412 743 (27.6) |
| 2004-2010 | 170 938 (34.2) | 512 814 (34.2) |
| 2011-2017 | 190 573 (38.2) | 571 719 (38.2) |
| Cancer stage at diagnosis, n (%)* | ||
| Localized | 172 350 (36.1) | — |
| Regional | 123 314 (25.8) | — |
| Distant | 98 919 (20.7) | — |
| Unknown | 82 975 (17.4) | — |
| Cancer treatment, n (%)† | ||
| No treatment | 109 130 (21.9) | — |
| Hormone therapy | 44 532 (8.9) | — |
| Surgery | 294 392 (59.0) | — |
| Radiotherapy | 83 107 (16.7) | — |
| Chemotherapy | 136 199 (27.3) | — |
| Targeted therapy | 21 161 (4.2) | |
| Protein kinase inhibitors | 3 088 (0.6) | |
| Antiangiogenic therapy | 4 937 (1.0) | |
| Immunotherapy | 1 775 (0.4) | |
| Other targeted therapy | 13 638 (2.7) | |
| Charlson Comorbidity Index score, n (%) | ||
| 0 | 386 018 (77.3) | 1 198 086 (80.0) |
| 1 | 84 672 (17.0) | 229 346 (15.3) |
| 2 | 20 669 (4.1) | 52 717 (3.5) |
| 3+ | 7 733 (1.5) | 17 127 (1.1) |
| Previous VTE, n (%) | 17 068 (3.4) | 36 315 (2.4) |
—, not applicable; IQR, interquartile range.
For solid cancers and lymphoma.
Treatments received during the first 4 months after cancer diagnosis. Treatments were not mutually exclusive.
VTE prior to cancer diagnosis
In the cancer cohort, the period prevalence of VTE during the 6 months prior to cancer diagnosis was 0.93% (95% CI, 0.90% to 0.96%). In the matched-comparison cohort, this period prevalence was 0.16% (95% CI, 0.15% to 0.16%) (HR, 6.0; 95% CI, 5.7-6.3). The incidence rate during the same period was 18.6 (95% CI, 18.1-19.2) per 1000 person-years in the cancer cohort and 3.2 (95% CI, 3.0-3.3) per 1000 person-years in the comparison cohort (Table 2).
Incidence of VTE during follow-up intervals, overall, and by cancer type
| 6 mo prior to cancer diagnosis/index date | 6 mo after cancer diagnosis/index date | 12 mo after cancer diagnosis/index date | ||||||||
|---|---|---|---|---|---|---|---|---|---|---|
| No. of persons | Period prevalence (95% CI) | Rate per 1000 person-years (95% CI) | HR* (95% CI) | Cumulative incidence (95% CI) | Incidence rate per 1000 person-years (95% CI) | HR* (95% CI) | Cumulative incidence (95% CI) | Incidence rate per 1000 person-years (95% CI) | HR* (95% CI) | |
| Comparison cohort | 1 497 276 | 0.16 (0.15-0.16) | 3.2 (3.0-3.3) | Ref | 0.19 (0.18-0.19) | 3.7 (3.6-3.9) | Ref | 0.35 (0.34-0.36) | 3.6 (3.5-3.7) | Ref |
| Cancer cohort | 499 092 | 0.93 (0.90-0.96) | 18.6 (18.1-19.2) | 6.0 (5.7-6.3) | 1.69 (1.66-1.73) | 39.0 (38.2-39.9) | 11.1 (10.5-11.6) | 2.28 (2.24-2.32) | 28.4 (27.9-29.0) | 8.5 (8.2-8.8) |
| Cancer groups | ||||||||||
| Pancreatic | 16 044 | 3.02 (2.76-3.29) | 60.5 (55.1-65.9) | 15.3 (12.1-19.2) | 4.43 (4.12-4.76) | 156.0 (144.4-167.5) | 50.4 (36.5-69.6) | 5.50 (5.15-5.87) | 133.3 (124.4-142.1) | 41.7 (32.1-54.2) |
| Ovarian | 10 565 | 2.25 (1.98-2.55) | 45.1 (39.3-50.9) | 20.5 (14.0-30.2) | 3.10 (2.78-3.44) | 71.8 (64.0-79.6) | 30.7 (21.0-45.1) | 3.94 (3.58-4.32) | 49.3 (44.6-54.1) | 20.2 (15.3-26.6) |
| Biliary | 2 611 | 1.80 (1.34-2.38) | 36.1 (25.7-46.5) | 19.5 (8.1-47.5) | 2.90 (2.31-3.60) | 87.2 (67.4-106.9) | 40.5 (15.6-105.4) | 3.78 (3.09-4.56) | 71.2 (57.0-85.4) | 27.0 (13.9-52.5) |
| HL | 2 459 | 0.60 (0.34-0.98) | 11.9 (5.7-18.2) | 10.5 (2.7-41.4) | 2.88 (2.27-3.61) | 60.5 (46.3-74.7) | 95.8 (22.9-401.2) | 3.77 (3.06-4.59) | 41.3 (32.8-49.8) | 60.7 (21.7-169.2) |
| MM | 6 693 | 1.03 (0.81-1.30) | 20.7 (15.8-25.6) | 5.4 (3.6-8.3) | 2.84 (2.46-3.26) | 64.7 (55.4-74.0) | 20.3 (13.3-31.1) | 3.80 (3.36-4.28) | 46.8 (41.0-52.6) | 13.4 (9.8-18.3) |
| Liver | 6 103 | 3.41 (2.97-3.89) | 68.4 (59.0-77.7) | 24.0 (14.6-39.4) | 2.82 (2.42-3.26) | 103.6 (88.0-119.1) | 23.1 (13.4-39.8) | 3.37 (2.94-3.85) | 81.6 (70.4-92.9) | 18.0 (11.5-28.1) |
| NHL | 18 473 | 1.19 (1.04-1.36) | 23.9 (20.7-27.1) | 8.1 (6.2-10.6) | 2.66 (2.43-2.90) | 59.5 (54.2-64.8) | 20.1 (15.5-26.0) | 3.22 (2.97-3.49) | 38.6 (35.5-41.7) | 14.8 (12.0-18.1) |
| NSCLC | 63 548 | 1.60 (1.50-1.70) | 31.9 (30.0-33.9) | 9.7 (8.5-11.1) | 2.60 (2.48-2.73) | 74.4 (70.8-78.0) | 20.0 (17.4-22.9) | 3.31 (3.17-3.45) | 59.0 (56.5-61.6) | 17.4 (15.5-19.6) |
| Stomach | 10 296 | 0.97 (0.79-1.17) | 19.3 (15.5-23.2) | 8.1 (5.4-12.3) | 2.48 (2.19-2.80) | 66.4 (58.2-74.6) | 20.1 (14.0-28.9) | 3.18 (2.85-3.53) | 51.5 (45.9-57.2) | 16.5 (12.3-22.1) |
| Colon | 51 436 | 1.08 (0.99-1.17) | 21.6 (19.8-23.4) | 6.0 (5.2-7.0) | 2.21 (2.09-2.34) | 51.9 (48.9-55.0) | 12.8 (11.2-14.7) | 2.84 (2.70-2.99) | 36.0 (34.1-37.9) | 9.5 (8.5-10.5) |
| Brain | 8 500 | 0.37 (0.26-0.52) | 7.5 (4.8-10.1) | 3.6 (2.0-6.4) | 2.18 (1.88-2.51) | 54.6 (46.7-62.5) | 23.0 (14.7-35.9) | 3.32 (2.96-3.73) | 50.3 (44.4-56.2) | 19.9 (14.2-27.8) |
| Kidney | 12 333 | 1.52 (1.32-1.75) | 30.5 (26.1-34.9) | 10.4 (7.6-14.2) | 2.17 (1.92-2.44) | 51.2 (45.0-57.3) | 22.3 (15.4-32.3) | 2.66 (2.38-2.95) | 34.2 (30.5-38.0) | 10.7 (8.4-13.7) |
| Esophageal | 7 956 | 0.86 (0.67-1.08) | 17.2 (13.1-21.3) | 5.9 (3.7-9.3) | 2.16 (1.86-2.50) | 58.1 (49.4-66.8) | 21.2 (13.4-33.4) | 3.00 (2.64-3.40) | 51.5 (44.9-58.1) | 15.7 (11.2-22.0) |
| Rectal | 26 191 | 0.51 (0.43-0.61) | 10.3 (8.5-12.0) | 3.1 (2.4-3.9) | 2.07 (1.90-2.25) | 45.5 (41.7-49.4) | 12.0 (9.9-14.7) | 2.81 (2.61-3.01) | 32.9 (30.5-35.3) | 9.8 (8.4-11.5) |
| Bladder | 16 051 | 0.71 (0.59-0.86) | 14.3 (11.6-16.9) | 4.8 (3.5-6.5) | 1.66 (1.47-1.87) | 37.8 (33.2-42.4) | 8.9 (6.9-11.4) | 2.74 (2.50-3.01) | 34.5 (31.3-37.8) | 8.6 (7.1-10.4) |
| SCLC | 11 536 | 0.73 (0.58-0.90) | 14.6 (11.4-17.7) | 6.9 (4.5-10.6) | 1.50 (1.29-1.73) | 43.0 (36.6-49.5) | 14.8 (10.0-21.9) | 2.24 (1.98-2.53) | 40.3 (35.4-45.3) | 16.1 (11.6-22.4) |
| Cervical | 7 701 | 0.68 (0.52-0.89) | 13.7 (9.9-17.4) | 7.9 (4.5-14.1) | 1.49 (1.24-1.79) | 31.5 (25.7-37.3) | 20.6 (11.8-36.1) | 2.02 (1.72-2.36) | 22.2 (18.7-25.7) | 17.2 (11.1-26.7) |
| Uterine | 13 656 | 0.75 (0.61-0.91) | 15.0 (12.0-17.9) | 6.4 (4.4-9.3) | 1.43 (1.24-1.65) | 30.1 (25.9-34.4) | 10.8 (7.8-14.9) | 1.98 (1.76-2.23) | 21.5 (18.9-24.1) | 6.9 (5.5-8.7) |
| Leukemia | 14 841 | 0.99 (0.84-1.17) | 19.9 (16.6-23.1) | 6.4 (4.8-8.7) | 1.27 (1.10-1.47) | 29.8 (25.5-34.0) | 9.6 (7.1-13.0) | 1.74 (1.54-1.97) | 21.9 (19.2-24.6) | 6.5 (5.2-8.2) |
| Prostate | 68 334 | 0.73 (0.67-0.79) | 14.6 (13.3-15.9) | 3.8 (3.3-4.4) | 0.80 (0.73-0.87) | 16.5 (15.1-17.9) | 3.8 (3.3-4.3) | 1.21 (1.13-1.30) | 12.9 (12.0-13.8) | 3.0 (2.7-3.3) |
| Testicular | 5 946 | 0.43 (0.29-0.63) | 8.7 (5.3-12.1) | 7.1 (3.3-15.4) | 0.80 (0.60-1.05) | 16.1 (11.5-20.8) | 22.5 (8.8-57.7) | 1.29 (1.02-1.61) | 13.2 (10.2-16.1) | 18.0 (9.4-34.2) |
| Breast | 85 746 | 0.22 (0.19-0.25) | 4.3 (3.7-5.0) | 1.8 (1.5-2.2) | 0.64 (0.59-0.70) | 13.2 (12.1-14.3) | 4.5 (3.9-5.1) | 1.00 (0.94-1.07) | 10.5 (9.8-11.2) | 3.7 (3.3-4.1) |
| Melanoma | 32 073 | 0.21 (0.16-0.26) | 4.1 (3.1-5.1) | 2.5 (1.7-3.5) | 0.36 (0.30-0.43) | 7.3 (6.0-8.7) | 2.9 (2.2-3.8) | 0.63 (0.55-0.73) | 6.5 (5.6-7.4) | 2.5 (2.1-3.0) |
HL, Hodgkin lymphoma; MM, multiple myeloma; NHL, non-Hodgkin lymphoma; NSCLC, non–small cell lung carcinoma; Ref, reference group; SCLC, Small-cell lung carcinoma
HR compared with matched-comparison cohort and adjusted for matching factors, Charlson Comorbidity Index score, and congestive heart failure, atherosclerosis, peripheral vascular disease, chronic obstructive pulmonary disease, inflammatory bowel disease, liver diseases, chronic kidney disease, diabetes, obesity, alcohol-related diseases, and hypertension.
VTE after cancer diagnosis
Cumulative VTE incidence during the 6 months after the cancer diagnosis/index date was 1.69% (95% CI, 1.66% to 1.73%) in the cancer cohort and 0.19% (95% CI, 0.18% to 0.19%) in the matched-comparison cohort (HR, 11.1; 95% CI, 10.5-11.6). The incidence rate during the same period was 39 (95% CI, 38-40) per 1000 person-years in the cancer cohort and 3.7 (95% CI, 3.6-3.9) per 1000 person-years in the comparison cohort.
Similarly, cumulative 12-month VTE incidence was higher in the cancer cohort (2.3%; 95% CI, 2.2% to 2.3%) than in the comparison cohort (0.35%; 95% CI, 0.34% to 0.36%), translating to an HR of 8.5 (95% CI, 8.2-8.8). In the same period, the incidence rates were 28.4 (95% CI, 27.9-29.0) per 1000 person-years in the cancer cohort and 3.6 (95% CI, 3.5-3.7) per 1000 person-years in the comparison cohort. Six- and 12-month study outcomes are presented in Table 2. Study outcomes restricted to DVT, PE, and inpatient VTE diagnoses, which showed a similar pattern, are shown in supplemental Tables 3, 4, and 5, respectively.
Cancer types
The 6-month cumulative incidence of VTE varied broadly across cancer types (Table 2). Cancers associated with the highest 6-month cumulative VTE incidence were pancreatic cancer (4.4%; 95% CI, 4.1% to 4.8%), Hodgkin lymphoma (2.9%; 95% CI, 2.3% to 3.6%), non-Hodgkin lymphoma (2.7%; 95% CI, 2.4% to 2.9%), and ovarian cancer (3.1%; 95% CI, 2.8% to 3.4%). In contrast, melanoma (0.36%; 95% CI, 0.30% to 0.43%) was associated with the lowest risk. The incidence rate during the first 6 months postdiagnosis ranged from 156 (95% CI, 144-168) per 1000 person-years for pancreatic cancer to 7.3 (95% CI, 6.0-8.7) per 1000 person-years for melanoma (Figure 1). Study outcomes for several subtypes of leukemia and brain cancer are provided in supplemental Table 6.

Incidence rate of VTE during the first 6 months after cancer diagnosis by cancer type for 3 calendar-year periods. NSC, non–small cell; SC, small-cell.
Incidence rate of VTE during the first 6 months after cancer diagnosis by cancer type for 3 calendar-year periods. NSC, non–small cell; SC, small-cell.
Risk factors for VTE
In the cancer cohort, the following risk factors were associated with VTE during the first 6 months of follow-up, after adjusting for the aforementioned covariates: prior VTE (SHR, 7.6; 95% CI, 7.2-8.0), distant metastasis at diagnosis (SHR, 3.2; 95% CI, 2.9-3.4), and surgery (SHR, 2.2; 95% CI, 2.0-2.4) during the first 4 months after cancer diagnosis. Additionally, use of chemotherapy (SHR, 3.4; 95% CI, 3.1-3.7), protein kinase inhibitors (SHR, 4.1; 95% CI 3.4-4.9), antiangiogenic therapy (SHR, 4.4; 95% CI, 3.8-5.2), immunotherapy SHR, 3.6; 2.8-4.6), and other targeted therapies (SHR, 3.5; 95% CI, 3.0-4.0) were identified as VTE risk factors for cancer patients (Table 3). Supplemental Table 7 shows the HR and adjusted HR for all potential risk factors. Figure 2 shows the 12-month cumulative VTE incidence stratified for use of systemic therapies during the first 4 months after cancer diagnosis.
Analysis of risk factors for VTE during the 6-month period following cancer diagnosis
| SHR (95% CI) | Adjusted SHR* (95% CI) | Cumulative incidence (95% CI) | |
|---|---|---|---|
| Sex | |||
| Female | Ref | Ref | 1.61 (1.56-1.66) |
| Male | 1.11 (1.06-1.16) | 1.02 (0.98-1.07) | 1.78 (1.73-1.83) |
| Age group, y | |||
| <50 | Ref | Ref | 1.22 (1.13-1.31) |
| 50-59 | 1.37 (1.24-1.50) | 1.15 (1.04-1.26) | 1.66 (1.57-1.75) |
| 60-69 | 1.58 (1.45-1.72) | 1.24 (1.14-1.35) | 1.91 (1.84-1.99) |
| 70-79 | 1.56 (1.43-1.70) | 1.11 (1.02-1.22) | 1.89 (1.82-1.96) |
| ≥80 | 1.10 (1.00-1.22) | 0.75 (0.68-0.83) | 1.34 (1.26-1.42) |
| Prior VTE | |||
| No | Ref | Ref | 1.38 (1.35-1.42) |
| Yes | 8.10 (7.68-8.54) | 7.58 (7.18-8.01) | 10.46 (10.01-10.93) |
| Cancer stage at diagnosis† | |||
| Localized | Ref | Ref | 0.80 (0.75-0.84) |
| Regional | 2.44 (2.28-2.61) | 2.29 (2.14-2.45) | 1.93 (1.85-2.01) |
| Distant | 4.01 (3.76-4.28) | 3.15 (2.94-3.37) | 3.14 (3.03-3.25) |
| Cancer treatment‡ | |||
| No treatment | Ref | Ref | 1.05 (0.98-1.13) |
| Hormone therapy | 0.87 (0.76-0.99) | 1.18 (0.99-1.41) | 0.92 (0.82-1.03) |
| Surgery | 1.75 (1.62-1.89) | 2.20 (2.02-2.39) | 1.84 (1.79-1.90) |
| Radiotherapy | 1.96 (1.79-2.14) | 2.16 (1.94-2.39) | 2.07 (1.96-2.18) |
| Chemotherapy | 3.33 (3.08-3.60) | 3.35 (3.06-3.66) | 3.50 (3.39-3.61) |
| Targeted therapy | 3.97 (3.60-4.38) | 3.85 (3.43-4.32) | 4.18 (3.91-4.46) |
| Protein kinase inhibitors | 5.40 (4.58-6.38) | 4.07 (3.39-4.90) | 5.69 (4.89-6.56) |
| Antiangiogenic therapy | 5.67 (4.96-6.50) | 4.43 (3.76-5.22) | 5.93 (5.29-6.62) |
| VEGF inhibitors | 5.87 (5.04-6.84) | 4.29 (3.54-5.19) | 6.13 (5.35-6.98) |
| Immunotherapy | 3.84 (3.00-4.91) | 3.56 (2.75-4.59) | 4.08 (3.21-5.10) |
| Checkpoint inhibitors | 3.73 (2.16-6.43) | 2.78 (1.61-4.80) | 4.08 (2.27-6.71) |
| Other targeted therapy | 3.29 (2.93-3.70) | 3.48 (3.03-3.98) | 3.47 (3.17-3.79) |
| Charlson Comorbidity Index | |||
| 0 | Ref | Ref | 1.69 (1.65-1.74) |
| 1 | 1.02 (0.96-1.08) | 0.85 (0.80-0.90) | 1.72 (1.63-1.81) |
| 2 | 0.92 (0.82-1.03) | 0.70 (0.62-0.78) | 1.55 (1.39-1.73) |
| 3+ | 1.03 (0.87-1.23) | 0.68 (0.57-0.81) | 1.75 (1.47-2.06) |
| Cancer type | |||
| Melanoma | Ref | Ref | 0.36 (0.30-0.43) |
| Breast | 1.79 (1.46-2.19) | 1.53 (1.25-1.88) | 0.64 (0.59-0.70) |
| Testicular | 2.22 (1.58-3.12) | 2.17 (1.54-3.06) | 0.80 (0.60-1.05) |
| Prostate | 2.22 (1.81-2.71) | 1.86 (1.51-2.29) | 0.80 (0.73-0.87) |
| Leukemia | 3.55 (2.82-4.49) | 2.79 (2.19-3.55) | 1.27 (1.10-1.47) |
| Uterine | 4.01 (3.18-5.05) | 3.64 (2.88-4.60) | 1.43 (1.24-1.65) |
| Cervical | 4.17 (3.22-5.40) | 3.53 (2.72-4.58) | 1.49 (1.24-1.79) |
| Bladder | 4.63 (3.72-5.77) | 3.62 (2.89-4.53) | 1.66 (1.47-1.87) |
| Small-cell lung cancer | 4.17 (3.29-5.29) | 2.08 (1.63-2.65) | 1.50 (1.29-1.73) |
| Rectal | 5.78 (4.72-7.07) | 4.07 (3.31-5.01) | 2.07 (1.90-2.25) |
| Kidney | 6.11 (4.90-7.61) | 4.11 (3.29-5.14) | 2.17 (1.92-2.44) |
| Colon | 6.20 (5.11-7.52) | 4.06 (3.33-4.96) | 2.21 (2.09-2.34) |
| Brain | 6.09 (4.82-7.69) | 7.49 (5.91-9.48) | 2.18 (1.88-2.51) |
| Esophageal | 6.05 (4.78-7.67) | 3.45 (2.70-4.40) | 2.16 (1.86-2.50) |
| Non-Hodgkin | 7.44 (6.07-9.13) | 4.75 (3.85-5.85) | 2.66 (2.43-2.90) |
| Hodgkin | 8.05 (5.98-10.83) | 5.70 (4.23-7.70) | 2.88 (2.27-3.61) |
| Stomach | 6.96 (5.58-8.68) | 4.27 (3.40-5.36) | 2.48 (2.19-2.80) |
| Multiple myeloma | 7.96 (6.30-10.04) | 5.92 (4.65-7.53) | 2.84 (2.46-3.26) |
| Non–small cell lung cancer | 7.32 (6.05-8.85) | 4.03 (3.31-4.91) | 2.60 (2.48-2.73) |
| Ovarian | 8.75 (7.07-10.84) | 5.25 (4.22-6.54) | 3.10 (2.78-3.44) |
| Biliary | 8.16 (6.10-10.92) | 5.05 (3.75-6.80) | 2.90 (2.31-3.60) |
| Liver | 7.98 (6.29-10.12) | 4.50 (3.53-5.75) | 2.82 (2.42-3.26) |
| Pancreatic | 12.64 (10.37-15.41) | 6.38 (5.19-7.84) | 4.43 (4.12-4.76) |
Ref, reference group; VEGF, vascular endothelial growth factor.
Adjusted for age, sex, prior VTE, cancer stage (solid cancers), cancer type (categorized for VTE risk according to Khorana score classification).
For solid cancers and lymphoma.
Treatments received during the first 4 months after cancer diagnosis. Treatments were not mutually exclusive. Targeted therapies could only be evaluated from 2004 onward.

Twelve-month cumulative incidence of VTE in cancer patients receiving systemic therapy during the first 4 months after cancer diagnosis.
Twelve-month cumulative incidence of VTE in cancer patients receiving systemic therapy during the first 4 months after cancer diagnosis.
Compared with the matched-comparison cohort without cancer, the 6-month VTE risk was sixfold higher in cancer patients who did not receive any treatment in the first 4 months after cancer diagnosis (HR, 6.3; 95% CI, 5.5-7.2). This risk was considerably higher for cancer patients who received chemotherapy (HR, 24.4; 95% CI, 22.1-26.9), protein kinase inhibitors (HR, 44.0; 95% CI, 22.8-84.8), antiangiogenic therapy (HR, 45.7; 95% CI, 27.8-75.1), immunotherapy (HR, 71.4; 95% CI, 19.6-260), and other targeted therapies (HR, 22.9; 95% CI, 17.3-30.4) (supplemental Table 8).
Time trends for VTE
The observed incidence of VTE in the cancer cohort increased during recent years. The 12-month VTE incidence was 1.0% (95% CI, 0.9% to 1.2%) for those with a cancer diagnosis in 1997, 1.9% (95% CI, 1.7% to 2.0%) for those diagnosed in 2004, and 3.4% (95% CI, 2.9% to 4.0%) for those diagnosed in 2017 (P < .0001). In the matched-comparison cohort, the 12-month cumulative incidence of VTE was 0.24% (95% CI, 0.21% to 0.29%) in 1997, 0.34% (0.30% to 0.39%) in 2004, and 0.56% (95% CI, 0.42% to 0.74%) in 2017 (P < .0001). The time trend of VTE is shown in Figure 3 for both cohorts. Figure 1 shows changes in VTE incidence rates over time.
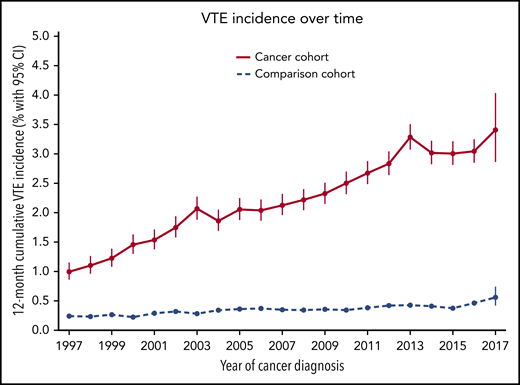
Twelve-month cumulative incidence of VTE in the cancer and comparison cohorts between 1997 and 2017.
Twelve-month cumulative incidence of VTE in the cancer and comparison cohorts between 1997 and 2017.
The 12-month incidence of PE in the cancer cohort increased from 0.32% (95% CI, 0.25% to 0.41%) in 1997 to 2.3% (95% CI, 1.8% to 2.9%) in 2017 (P < .0001; supplemental Figure 1). In contrast, 12-month DVT incidence in the cancer cohort did not materially change (P = .8; supplemental Figure 3).
In the analysis restricted to cancer patients who received chemotherapy or targeted therapy in the first 4 months after their cancer diagnosis, the time trend of VTE incidence was more pronounced. Twelve-month VTE incidence in this cohort was 1.1% (95% CI, 0.8% to 1.6%) in 1997 and 6.0% (95% CI, 4.9% to 7.2%) in 2017 (P < .0001) (supplemental Figure 3).
Contemporary VTE incidence (2011-2017)
Between 2011 and 2017, 6-month cumulative VTE incidence was 2.2% (95% CI, 2.2% to 2.3%) in the cancer cohort and 0.23% (95% CI, 0.21% to 0.24%) in the matched-comparison cohort (HR, 11.5; 95% CI, 10.8-12.4). In the first 12 months following the cancer diagnosis/index date, cumulative incidences were 3.0% (2.9% to 3.1%) in the cancer cohort and 0.42% (95% CI, 0.40% to 0.44%) in the comparison cohort (HR, 9.1; 95% CI, 8.6-9.6). Study outcomes restricted to the 2011 to 2017 period are presented in supplemental Table 9.
For cancer patients who were diagnosed between 2011 and 2017 and received chemotherapy or targeted therapy during the first 4 months after diagnosis, cumulative VTE incidence during the first 6 months following diagnosis was 4.0% (95% CI, 3.8% to 4.1%), compared with 0.19% (95% CI, 0.17% to 0.21%) for matched-comparison individuals during the first 6 months following their index date (HR, 23; 95% CI, 20-26). The 12-month cumulative VTE incidence was 5.3% (95% CI, 5.1% to 5.5%) for these cancer patients and 0.34% (95% CI, 0.31% to 0.36%) for the matched-comparison individuals (HR, 20; 95% CI, 18-22) (supplemental Table 10).
Time trends in risk factors for VTE
Time trends for several potential VTE risk factors among cancer patients were explored in a post hoc analysis. We found that median age at cancer diagnosis was 68 years (interquartile range, 57-77 years) in 1997 and 69 years (interquartile range, 60-76 years) in 2017. The average number of computed tomography (CT) scans performed per cancer patient during the first 12 months following diagnosis increased from 0.17 in 2001 to 1.16 in 2017 (P < .0001). Twelve-month survival among cancer patients increased from 62.9% (95% CI, 62.2% to 63.6%) in 1997 to 79.4% (95% CI, 78.5% to 80.2%) in 2017 (P < .0001). The proportion of cancer patients receiving chemotherapy during the first 4 months after their cancer diagnosis increased from 17% in 1997 to 33% in 2017 (P < .0001). The proportion of patients receiving targeted therapies that could be estimated from 2004 onward showed a comparable increase over time. Changes in these risk factors for VTE over time are depicted in supplemental Figure 4.
Discussion
This large population-based cohort study of a half-million Danish cancer patients provides contemporary estimates of the incidence of cancer-associated VTE based on a competing-risk approach. We found that 6-month VTE risk for cancer patients is currently 12-fold higher than in the general population, and even 23-fold higher in cancer patients receiving chemotherapy or targeted therapy. Among cancer patients, the risk appeared to be elevated in patients with a prior VTE or distant metastasis, and in recipients of chemotherapy or targeted therapy. A striking increase in the incidence of cancer-associated VTE was observed in the past 2 decades: the 12-month cumulative VTE incidence increased threefold for cancer patients, and even sixfold for those receiving chemotherapy or targeted therapy.
Exploratory analyses suggested that increased VTE incidence in cancer patients may have resulted from several factors. Improved survival and more frequent use of chemotherapy and targeted therapies were observed over time. Another explanation could be increased use of chest CT scans, which increased 10-fold over the study period and possibly led to more incidental PE findings. The observation that PE incidence in the cancer cohort increased over time, while the incidence of DVT did not materially change, supports this explanation. Increased incidence of incidental PE would be clinically relevant, as previous studies showed that incidental VTE findings in cancer patients are of clinical importance27,28 and international guidelines recommend the same treatment of incidental findings and symptomatic events.29-31
In the 6 months preceding a cancer diagnosis, in which VTE risk factors such as surgery and chemotherapy do not yet play a role, the period prevalence of VTE was substantial, especially for patients who subsequently were diagnosed with abdominal or gynecological cancers. To detect cancer cases at an early stage, it is thus important for clinicians to consider the possibility of occult cancer in patients with unexplained VTE.32-34 Still, studies that compared a more extensive screening approach to that suggested in current international guidelines indicated no clear benefit of extended screening to detect occult cancers.35,36
To our knowledge, 2 earlier studies showed an increased VTE incidence over time for cancer patients in the period between 1995 and 2006.10,37 This study adds to this knowledge by showing that the increase over time continued in the period beyond 2006, during which various novel anticancer treatments were introduced. In contrast to previous studies, we examined several factors that can explain this increase, including novel cancer therapies and increased use of CT scanning. Additionally, risk estimates were provided both before and after cancer diagnosis and for patients using chemotherapy or targeted therapies separately. This study used comprehensive routine clinical care data from all Danish residents regardless of insurance status, sociodemographic factors, or ethnic background. In contrast to an earlier Danish study,13 the current data represent all regions of Denmark, capturing a larger oncological population and thereby increasing the precision of the estimates. Use of a competing-risk analysis, which recently was shown to be appropriate in the setting of cancer-associated VTE,16 prevented overestimation of risk factors, which may have occurred in earlier population-based studies.10,13,37-39
Several limitations need to be acknowledged. First, some data on patient characteristics associated with VTE risk, such as body mass index, smoking, and use of contraceptives, were not available. Second, we could not distinguish between incidentally detected and symptomatic VTE. A third concern is that close clinical surveillance after a cancer diagnosis might have led to earlier detection of VTE in the cancer cohort. Fourth, analysis of VTE point prevalence in the 6 months prior to cancer diagnosis introduced immortal time bias for members of both cohorts. The absence of fatal VTE events in this period could therefore have led to underestimation of study outcomes, especially in the cancer cohort. Fifth, in some of the smaller cancer groups, the HR could not be calculated because of a lack of VTE events in the comparison cohort. Sixth, cancer treatment was not limited to a single modality and was recorded only during the first 4 months following cancer diagnosis. Additionally, as cancer treatments are administered specifically according to cancer type and disease stage, the observed associations between these treatments and the risk of VTE may not be causal. Notably, the increased VTE risk observed in the systemic cancer treatment groups might in part be explained by a prolonged exposure due to improved survival over the years. Evaluation of this potential explanation was not possible due to a limited number of patients and outcomes in these subgroups. Seventh, data from private hospitals were not included in this study. However, private hospitals account for <1% of hospital beds in Denmark, and treatment of cancer and VTE takes place exclusively in the public health system.17 Finally, as in all registry studies, misclassification of disease diagnosis codes cannot be completely ruled out. However, the observed increase in VTE incidence over time is supported by a comparable increase in anticoagulant use among cancer patients (supplemental Table 11).
This study demonstrated that risk of VTE is currently 12-fold higher in cancer patients than in the general population, taking death into account as a competing risk. For cancer patients receiving chemotherapy or targeted therapy, this risk is currently 23-fold increased. The overall incidence of cancer-associated VTE increased threefold over recent years, and even sixfold in those using chemotherapy or systemic therapy. The increase might be explained by improved cancer survival and increased use of chemotherapy and CT scans in cancer patients. Two recent trials showed the feasibility of primary thromboprophylaxis in cancer patients.40,41 Our findings underscore the increasing importance of preventive measures in this patient population.
For original data, please contact H. T. Sørensen (hts@clin.au.dk).
The online version of this article contains a data supplement.
The publication costs of this article were defrayed in part by page charge payment. Therefore, and solely to indicate this fact, this article is hereby marked “advertisement” in accordance with 18 USC section 1734.
Acknowledgments
This work was financially supported by the Karen Elise Jensen Foundation. The Department of Clinical Epidemiology receives funding for other studies from companies in the form of research grants to (and administered by) Aarhus University. None of these studies has any relation to the present study.
Authorship
Contribution: H.T.S. initiated the study; N.v.E., H.T.S., E.H.-P., F.M., C.A., and F.I.M. were responsible for the study concept and design; E.H.-P. performed the statistical analysis; and all authors interpreted the data, drafted the manuscript, approved the final manuscript, and agreed to be accountable for all aspects of the work.
Conflict-of-interest disclosure: The Department of Clinical Epidemiology receives funding for other studies from companies in the form of research grants to (and administered by) Aarhus University (none of these studies has any relation to the present study). H.W.M.v.L. was a consultant to, or had an advisory role with, Bristol Myers Squibb (BMS), Lilly, Merck Sharp & Dohme (MSD), Nordic Pharma, and Servier, and received research funding and/or medication from Bayer, BMS, Celgene, Janssen, Lilly, Nordic Pharma, Philips, Roche, and Servier (none of these have any relation to the present study). N.v.E. reports receiving consultancy fees from Bayer, LEO Pharma, and Daiichi Sankyo, which were transferred to his institution (none of these have any relation to the present study). C.A. reports honoraria for lectures from Bayer, Daiichi Sankyo, BMS/Pfizer, and Sanofi, and participation in advisory boards for Bayer, Boehringer Ingelheim, Daiichi Sankyo, and BMS/Pfizer (none of these have any relation to the present study). The remaining authors declare no competing financial interests.
Correspondence: F. I. Mulder, Department of Vascular Medicine, Amsterdam Cardiovascular Science, Amsterdam UMC, University of Amsterdam, Meibergdreef 9, 1105 AZ Amsterdam, The Netherlands; e-mail: f.i.mulder@amsterdamumc.nl.

This feature is available to Subscribers Only
Sign In or Create an Account Close Modal