

Key Points
A few small compounds, including hematoxylin, can target the N-glycan binding domain of mutant human CALR.
Hematoxylin binding disrupts the interaction between mutant CALR and the thrombopoietin receptor, causing apoptosis of mutant cells.

Abstract
Somatic mutations of calreticulin (CALR) have been identified as a main disease driver of myeloproliferative neoplasms, suggesting that development of drugs targeting mutant CALR is of great significance. Site-directed mutagenesis in the N-glycan binding domain (GBD) abolishes the ability of mutant CALR to oncogenically activate the thrombopoietin receptor (MPL). We therefore hypothesized that a small molecule targeting the GBD might inhibit the oncogenicity of the mutant CALR. Using an in silico molecular docking study, we identified candidate binders to the GBD of CALR. Further experimental validation of the hits identified a group of catechols inducing a selective growth inhibitory effect on cells that depend on oncogenic CALR for survival and proliferation. Apoptosis-inducing effects by the compound were significantly higher in the CALR-mutated cells than in CALR wild-type cells. Additionally, knockout or C-terminal truncation of CALR eliminated drug hypersensitivity in CALR-mutated cells. We experimentally confirmed the direct binding of the selected compound to CALR, disruption of the mutant CALR-MPL interaction, inhibition of the JAK2-STAT5 pathway, and reduction at the intracellular level of mutant CALR upon drug treatment. Our data indicate that small molecules targeting the GBD of CALR can selectively kill CALR-mutated cells by disrupting the CALR-MPL interaction and inhibiting oncogenic signaling.
Introduction
Three phenotypic driver mutations have been identified in classical myeloproliferative neoplasms (MPNs): mutations in JAK2, MPL, and CALR genes.1-8 Calreticulin (CALR) mutations are frameshift mutations that occur in exon 9 of the gene, all leading to use of the same alternative reading frame. Our group and others have shown that mutant CALR interacts with MPL and constitutively activates the Janus kinase (JAK)–signal transducer and activator of transcription (STAT) pathway.9-15 This interaction is mediated by both the lectin domain and the mutant C-terminal peptide.9,16,17 Strikingly, mutations at the N-glycan binding domain (GBD) abolish mutant CALR–induced JAK-STAT pathway activation, indicating the essentiality of this domain for its oncogenic function.12,15,16 Moreover, the N-glycosylated sites at the extracellular domain of MPL are also required for this activation, and aberrant glycosylation of MPL is detected in mutated CALR cells.12 These findings suggest that the GBD of CALR is a potential therapeutic target in mutated CALR–driven MPNs.
The structure of the globular lectin domain of CALR has partially been solved by X-ray crystallography.18,19 This domain mediates both glycan-dependent and -independent interactions of CALR with the substrate proteins.20 Interestingly, cocrystallization of CALR and a tetrasaccharide substrate reveals a pocket-like domain of the protein that forms hydrogen bond networks interacting with its monoglucosylated protein substrates.19 These atomic details provide crucial structural insights into the targeting strategy by small-molecule inhibitors. In this study, we attempted to identify binders of the GBD that inhibit the oncogenic activation of MPL by mutant CALR.
Methods
Molecular docking
The in silico docking was performed with 2 independent methods. For the discovery method, the docking study was conducted with the OpenEye Scientific Software program. For the validation method, Autodock Vina was used for compound docking (supplemental Data, available on the Blood Web site).
Generation of CALR-mutated and knockout cell line models by CRISPR-Cas9 technology
The CRISPR RNAs targeting murine and human endogenous CALR gene loci were cloned into pSpCas9(BB)-2A-Puro (PX459) V2.0 vectors that were a gift from the Feng Zhang laboratory (plasmid #62988; Addgene; supplemental Table 3).21 The recipient cell lines were transfected using the Amaxa Cell Line Nucleofector Kit V (#VCA-1003; Lonza). The selection and sequencing of single clones were conducted as previously described.10
Cell viability assay
Ba/F3 and UT-7/Tpo cells were plated at 5000 cells per well in RPMI media and 16 000 cells per well in Iscove modified Dulbecco medium media, respectively, into 96-well plates with the desired concentrations of drugs/cytokines added in a total volume of 100 µL; 72 hours later, the CellTiter-Glo Luminescent Cell Viability Assay (#500050; Promega) was used to determine cell viability as previously described.10
Competition assay
Cell lines were transduced with pMSCV-IRES-mCherry constructs, and the fluorescence+ cells were sorted by the SH800Z Cell Sorter (Sony). mCherry+ cell lines were mixed 1:1 with their nonfluorescent control cells and went through drug treatment of 3 to 12 days. Drugs and cytokines were refreshed every 2 to 3 days. Cell samples at each time point were analyzed using the BD LSRFortessa cell analyzer (BD Biosciences).
Apoptosis assay by annexin V/PI staining
The Annexin V Apoptosis Detection Kit (#88-8007-74; eBioscience) was used based on the manufacturer’s instructions; 5 µL of propidium iodide (PI) staining solution (#00-6990-50; Invitrogen) was added to each sample for 10 minutes before analysis using the BD LSRFortessa cell analyzer without washing.
Western blot
Protease inhibitors and antibodies are listed in supplemental Table 6. Clarity Western ECL Blotting Substrate (#1705061; Bio-Rad) was used for the chemiluminescence detection method.
NanoBRET assay
The NanoBRET assay (#N1811, NanoBRET PPI Starter Systems; Promega) was conducted as previously described.22 Cells were treated with specific concentrations of hematoxylin 24 hours posttransfection. The treated cells were used for the NanoBRET assay and western blot to check the CALR del52-HaloTag expression. Each condition was repeated as 3 biological replicates in each independent experiment (n = 4 experiments).
CETSA
HEK293T cells were transfected with pcDNA3.1 CALR wild type (WT), pcDNA3.1 CALR ins5, and pcDNA3.1 CALRMPL constructs, respectively, using the Calcium Phosphate Transfection Kit (#K2780-01; Thermo Fisher Scientific). Hematoxylin or dimethyl sulfoxide (DMSO) was added to cell lysate followed by 30-minute incubation on ice. The cellular thermal shift assay (CETSA) was adapted from published protocols.23,24
Colony formation assay
Five hundred to 1000 human CD34+ cells were plated in 1 mL of Methocult classic medium (#H4434; STEMCELL Technologies) with 40 μM of hematoxylin or DMSO control. Cells were incubated for 10 to 14 days before colony counting under the microscope. Colonies were picked up for DNA extraction and genotyping (data supplement).
Results
Molecular docking identifies potential CALR-targeting compounds
Based on the published globular structure of WT CALR,18-20,25 the lectin domain of the protein consists of an N-glycan binding site, an ATP binding site, and a calcium binding site (Figure 1A). The N-glycan binding site is of particular interest, because it has been suggested to be crucial to the mutant CALR function.12,22 To validate the therapeutic potential of this domain in our models, we mutated the human CALR del52 sequence at residue lysine 111 and aspartic acid 317, respectively. These 2 amino acid residues are essential for the N-glycan binding capacity of WT CALR.19,26-28 We transduced Ba/F3-MPL cells with retroviral vectors carrying WT CALR, CALR del52, and GBD-mutated CALR del52, respectively. Both K111G and D317G mutations abolished the transforming properties of CALR del52 in the Ba/F3-MPL cell line in the absence of interleukin-3 (IL-3) or thrombopoietin (TPO), confirming the essentiality of the GBD in the oncogenic function of mutant CALR (Figure 1B).
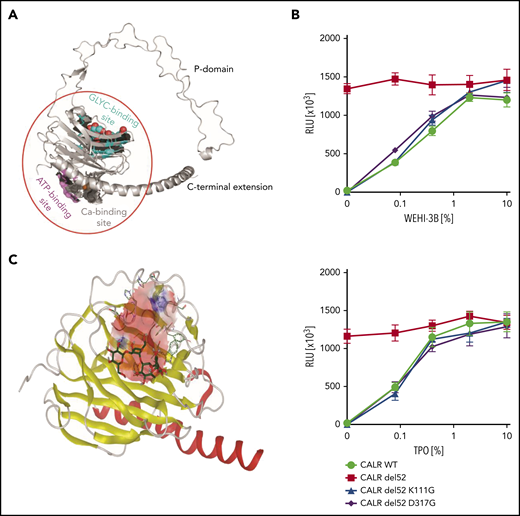
Molecular docking of CALR GBD was conducted to search for mutant CALR inhibitors. (A) Structural model of human CALR. Colored surface representations indicate experimentally identified interaction sites: N-glycan binding site (cyan), ATP binding site (magenta), and Ca2+ binding site (gray). (B) Cytokine dose response of the GBD-mutated Ba/F3-MPL cells. Ba/F3-MPL cells were transduced with pMSCV-puro constructs carrying CALR WT, CALR del52, and lysine 111– and aspartic acid 317– mutated CALR del52. The transduced cells were cultured with different concentrations of the cytokines, and the cell viability was detected after 72 hours. WEHI-3B–conditioned media and TPO-conditioned media were used as murine IL-3 and human TPO supplements (n = 6). Data are shown as mean ± standard deviation. (C) In silico modeling of the CALR GBD domain. The globular domain of CALR is shown (α-helix, red; β-sheets, yellow). A grid box is defined at the GBD domain for the docking prediction (pink area). The cocrystalized tetrasaccharide molecule (carbon molecule, dark green; oxygen molecule, red; hydrogen molecule, gray) is displayed and interacts with the CALR GBD. RLU, relative luminescence unit.
Molecular docking of CALR GBD was conducted to search for mutant CALR inhibitors. (A) Structural model of human CALR. Colored surface representations indicate experimentally identified interaction sites: N-glycan binding site (cyan), ATP binding site (magenta), and Ca2+ binding site (gray). (B) Cytokine dose response of the GBD-mutated Ba/F3-MPL cells. Ba/F3-MPL cells were transduced with pMSCV-puro constructs carrying CALR WT, CALR del52, and lysine 111– and aspartic acid 317– mutated CALR del52. The transduced cells were cultured with different concentrations of the cytokines, and the cell viability was detected after 72 hours. WEHI-3B–conditioned media and TPO-conditioned media were used as murine IL-3 and human TPO supplements (n = 6). Data are shown as mean ± standard deviation. (C) In silico modeling of the CALR GBD domain. The globular domain of CALR is shown (α-helix, red; β-sheets, yellow). A grid box is defined at the GBD domain for the docking prediction (pink area). The cocrystalized tetrasaccharide molecule (carbon molecule, dark green; oxygen molecule, red; hydrogen molecule, gray) is displayed and interacts with the CALR GBD. RLU, relative luminescence unit.
Because the pathological mutations of CALR in MPNs only change the sequence at the C-terminus of the protein, we predicted that the lectin domain of the mutant protein would be conserved and that the structure information based on the WT protein could be used in the study. Therefore, we generated a 3-dimensional structural model based on crystallized structures of both human and mouse CALR and performed 2 independent in silico molecular docking studies to identify potential chemical candidate binders (Figure 1C; data supplement). To gain insight into the specificity and selectivity of each ligand, we selected 2 other proteins as negative controls, including calnexin, which is structurally and functionally similar to CALR, and endoplasmic reticulum (ER) mannosidase I, an enzyme that is involved in ER-associated degradation of glycoproteins in mammalian cells but structurally different from CALR.29,30 Among 140 000 structures, a list of candidate compounds with the highest binding affinity and specificity to CALR was generated.
Identification of compounds that selectively reduce the viability of CALR-mutant cells
Of the top 100 predicated binders, 41 were accessible. To exclude the compounds with low biological activity, we performed a growth inhibitory screen at a 10-μM concentration in Ba/F3-MPL and UT-7/TPO cell lines carrying heterozygous CALR oncogenic mutations generated by CRISPR-Cas9 technology. Eight of 41 compounds exerted a growth-inhibitory effect in both cell lines (inhibitory effect >10%) and had a >50% inhibitory effect in at least 1 of the cell lines (Figure 2A). These 8 compounds were taken as hits for the subsequent multidose response analysis. The hits were tested for their growth-inhibitory capabilities in isogenic CALR WT and CALR-mutated cell lines to identify compounds that preferentially inhibit CALR-mutated cells. Of the 8 compounds, we identified 7,11b-dihydroindeno[2,1-c]chromene-3,4,6a,9,10(6H)-pentol (known as hematoxylin) as delivering a mutant-specific inhibitory effect. Hematoxylin is conventionally used in histological staining. However, its oxidation and the addition of a high concentration of metal ions such as aluminum are essential steps in its conversion to an active dye. Hematoxylin was predicted to form hydrogen bonds with 4 amino acids at the CALR GBD through its hydroxyl groups (Figure 2B). To ensure that the growth of both CALR WT and CALR-mutated cell lines was dependent on MPL signaling, TPO was added to CALR WT cells, and CALR-mutated cells were cultured without cytokines to ensure that the oncogenic signaling was activated. Both heterozygous and homozygous mutant CALR–expressing Ba/F3-MPL cell lines showed hypersensitivity to hematoxylin treatment compared with the WT control (mutant: 50% inhibitory concentration [IC50], 2.90 ± 0.67 μM; WT: IC50, 11.18 ± 2.87 μM; Figure 2C). In human UT-7/TPO cell lines, the hypersensitivity of CALR-mutated cell lines to hematoxylin was present despite the smaller effective magnitude and the higher drug concentration required (mutant: IC50, 16.01 ± 2.27 μM; WT: IC50, 33.61 ± 3.28 μM; Figure 2D).
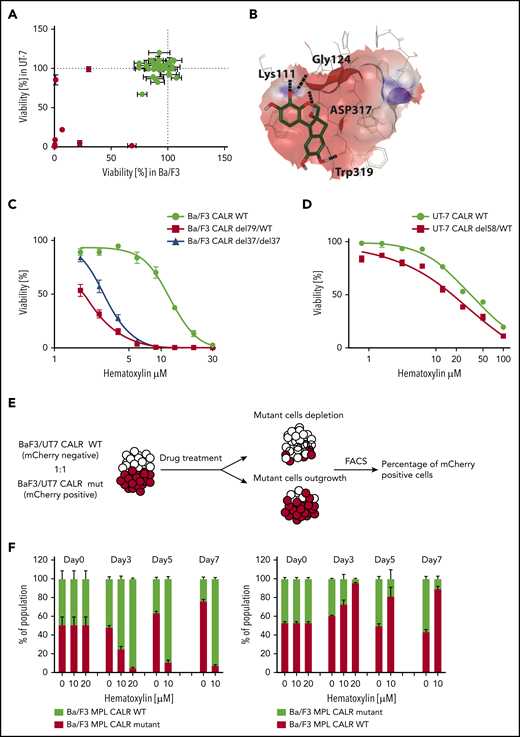
Selective inhibitory effect of hematoxylin was observed on CALR-mutated cell lines. (A) Single-dose cytotoxic screen of the docking library in Ba/F3-MPL and UT-7/TPO cell lines. CRISPR-Cas9–generated Ba/F3-MPL CALR del79/WT and UT-7/TPO CALR del61/WT were treated by each compound at 10 μM for 72 hours. All luminescent signals were normalized to DMSO control to calculate the percentage of reduced viability (n = 3). Positive hits are shown in red. Data are shown as mean ± standard deviation (SD). (B) Molecular docking model of hematoxylin with the GBD of CALR. The predicted interacting amino acid residues are labeled. The hydrogen bonds are labeled with black dash lines. The pink area indicates the grid box used in the docking study. (C) Dose-response test of hematoxylin in Ba/F3-MPL cell lines. A heterozygous and a homozygous CALR-mutated cell line were used in comparison with WT control. WT cells were grown with 1% TPO-conditioned media, and mutant cell lines were grown without cytokine. All drug treatment groups contained an equal amount of DMSO (n = 6). (D) Dose-response test of hematoxylin in UT-7/TPO cell lines. A CALR heterozygous mutant cell line was used in comparison with WT control. WT cells were grown with 1% TPO-conditioned media, and mutant cell lines were grown without cytokine. All drug treatment groups contained an equal amount of DMSO (n = 6). (E) Schematic diagram of the experimental process of the 2-color competition assay. (F) Drug selectivity test of hematoxylin in Ba/F3-MPL by the 2-color competition assay. Ba/F3-MPL CALR WT (mCherry+) and Ba/F3-MPL CALR del79/WT (mCherry−) cells were treated with the indicated concentration of hematoxylin for 7 days (1% TPO-conditioned media) and, the drug was refreshed every 2 to 3 days (left). The reverse color setting was used, and Ba/F3-MPL CALR WT (mCherry−) and Ba/F3-MPL CALR del79/WT (mCherry+) cells were used (right; n = 3). Data are shown as mean ± SD. FACS, fluorescence-activated cell sorting.
Selective inhibitory effect of hematoxylin was observed on CALR-mutated cell lines. (A) Single-dose cytotoxic screen of the docking library in Ba/F3-MPL and UT-7/TPO cell lines. CRISPR-Cas9–generated Ba/F3-MPL CALR del79/WT and UT-7/TPO CALR del61/WT were treated by each compound at 10 μM for 72 hours. All luminescent signals were normalized to DMSO control to calculate the percentage of reduced viability (n = 3). Positive hits are shown in red. Data are shown as mean ± standard deviation (SD). (B) Molecular docking model of hematoxylin with the GBD of CALR. The predicted interacting amino acid residues are labeled. The hydrogen bonds are labeled with black dash lines. The pink area indicates the grid box used in the docking study. (C) Dose-response test of hematoxylin in Ba/F3-MPL cell lines. A heterozygous and a homozygous CALR-mutated cell line were used in comparison with WT control. WT cells were grown with 1% TPO-conditioned media, and mutant cell lines were grown without cytokine. All drug treatment groups contained an equal amount of DMSO (n = 6). (D) Dose-response test of hematoxylin in UT-7/TPO cell lines. A CALR heterozygous mutant cell line was used in comparison with WT control. WT cells were grown with 1% TPO-conditioned media, and mutant cell lines were grown without cytokine. All drug treatment groups contained an equal amount of DMSO (n = 6). (E) Schematic diagram of the experimental process of the 2-color competition assay. (F) Drug selectivity test of hematoxylin in Ba/F3-MPL by the 2-color competition assay. Ba/F3-MPL CALR WT (mCherry+) and Ba/F3-MPL CALR del79/WT (mCherry−) cells were treated with the indicated concentration of hematoxylin for 7 days (1% TPO-conditioned media) and, the drug was refreshed every 2 to 3 days (left). The reverse color setting was used, and Ba/F3-MPL CALR WT (mCherry−) and Ba/F3-MPL CALR del79/WT (mCherry+) cells were used (right; n = 3). Data are shown as mean ± SD. FACS, fluorescence-activated cell sorting.
As a further confirmation of the selective inhibitory effect of hematoxylin on mutant CALR–expressing cells, we tested its effect in a coculture assay where WT and mutant CALR–expressing cells were initially seeded at a 1:1 ratio (Figure 2E). In the coculture system, either CALR WT or CALR-mutant Ba/F3-MPL cells were fluorescently labeled. In the presence of the drug, the CALR-mutated cells were nearly depleted at day 7 of the culture, at which point CALR WT cells dominated (Figure 2F; supplemental Figure 1). In the absence of hematoxylin (DMSO group), the CALR-mutant cells gradually overgrew the CALR WT cells, as expected because of their transformed nature. To exclude the possibility that the observed fitness difference was due to the fluorescent protein marker (mCherry), we used the reverse-color setup as an additional control. We also observed the differential killing effect of hematoxylin in the human UT-7/TPO cell lines (supplemental Figure 2).
To elucidate the mechanism of cell death caused by the drug treatment, we performed an apoptosis assay using annexin V/PI staining. We observed a significant elevation of apoptotic cell numbers induced by hematoxylin in CALR-mutated cell lines, but not in the WT control. The addition of TPO did not have a significant impact on apoptosis, whereas the addition of 50 ng/mL of murine IL-3 partially rescued the apoptosis induced by hematoxylin (Figure 3A-B).
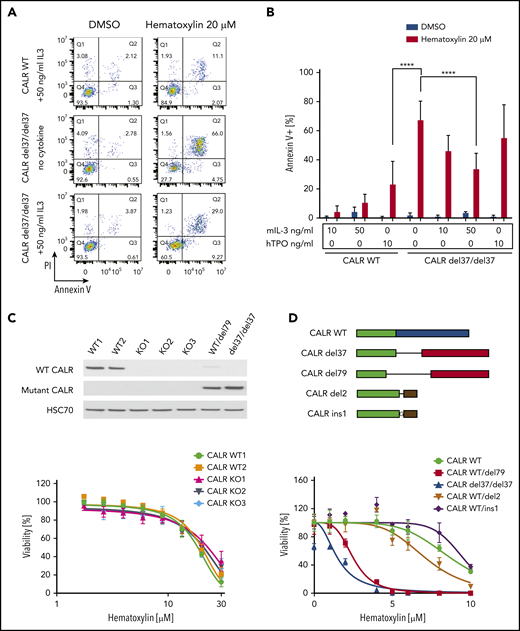
C-terminal truncation and knockout (KO) CALR rescue apoptosis induced by hematoxylin in CALR-mutated cells. (A) Annexin V/PI staining of Ba/F3-MPL cells after hematoxylin treatment for 24 hours. Representative fluorescence-activated cell sorting plots of annexin V/PI staining in both CALR WT and mutant cell lines; 10 and 50 ng/mL of murine IL-3 were used, and 10 ng/mL of human TPO (hTPO) was used. (B) Quantification of apoptotic cells (annexin V+; n = 3). Data are shown as mean ± standard deviation. The statistical test was conducted by 1-way analysis of variance followed by Bonferroni’s multiple comparison tests. WT cells were tested in the presence of 10 and 50 ng/mL of murine IL-3 or 10 ng/mL of hTPO. Mutant cell lines were tested in either absence of cytokine or presence of 10 and 50 ng/mL of murine IL-3 or 10 ng/mL of hTPO. (C) KO of CALR in Ba/F3-MPL cells shown by western blot (top). Dose response of Ba/F3-MPL CALR WT and CALR KO cell lines (bottom). CALR KO cell lines were generated by CRISPR-Cas9 targeting exon 3 of CALR gene from Ba/F3-MPL cell lines; 3 individual KO clones and 2 WT clones were used in the experiment (n = 5). (D) Sequence alignment of the C-terminal sequences of WT CALR, disease frameshift mutant CALR (CALR del79 and CALR del37 as 2 examples), and C-terminal–truncated CALR (CALR del2 and CALR ins1 as 2 examples) from Ba/F3 cells. Nonmutated sequences (green), disease frameshift mutant–specific sequences (red), WT-specific sequences (blue), and nondisease frameshift mutant sequences (brown) are indicated (top). Dose response of Ba/F3-MPL cell lines carrying WT CALR, disease frameshift mutant CALR, and C-terminal–truncated CALR (bottom; n = 3). ****P < .0001.
C-terminal truncation and knockout (KO) CALR rescue apoptosis induced by hematoxylin in CALR-mutated cells. (A) Annexin V/PI staining of Ba/F3-MPL cells after hematoxylin treatment for 24 hours. Representative fluorescence-activated cell sorting plots of annexin V/PI staining in both CALR WT and mutant cell lines; 10 and 50 ng/mL of murine IL-3 were used, and 10 ng/mL of human TPO (hTPO) was used. (B) Quantification of apoptotic cells (annexin V+; n = 3). Data are shown as mean ± standard deviation. The statistical test was conducted by 1-way analysis of variance followed by Bonferroni’s multiple comparison tests. WT cells were tested in the presence of 10 and 50 ng/mL of murine IL-3 or 10 ng/mL of hTPO. Mutant cell lines were tested in either absence of cytokine or presence of 10 and 50 ng/mL of murine IL-3 or 10 ng/mL of hTPO. (C) KO of CALR in Ba/F3-MPL cells shown by western blot (top). Dose response of Ba/F3-MPL CALR WT and CALR KO cell lines (bottom). CALR KO cell lines were generated by CRISPR-Cas9 targeting exon 3 of CALR gene from Ba/F3-MPL cell lines; 3 individual KO clones and 2 WT clones were used in the experiment (n = 5). (D) Sequence alignment of the C-terminal sequences of WT CALR, disease frameshift mutant CALR (CALR del79 and CALR del37 as 2 examples), and C-terminal–truncated CALR (CALR del2 and CALR ins1 as 2 examples) from Ba/F3 cells. Nonmutated sequences (green), disease frameshift mutant–specific sequences (red), WT-specific sequences (blue), and nondisease frameshift mutant sequences (brown) are indicated (top). Dose response of Ba/F3-MPL cell lines carrying WT CALR, disease frameshift mutant CALR, and C-terminal–truncated CALR (bottom; n = 3). ****P < .0001.
Next, we examined whether hematoxylin hypersensitivity could also be conferred by CALR deficiency or CALR exon 9 truncation. We first knocked out CALR in the Ba/F3-MPL cell line using CRISPR-Cas9 technology and examined the response of CALR-deficient cells to hematoxylin. Neither CALR ablation nor CRISPR-Cas9–induced C-terminal truncation conferred hypersensitivity to hematoxylin (Figure 3C-D).
To show that the hypersensitivity of mutant CALR cells to hematoxylin treatment was conferred by the GBD, we conducted a dose-response assay in Ba/F3cells by transducing them with different GBD mutants of CALR del52. Substitutions at lysine 111 and aspartic acid 317 of CALR del52 abolished the vulnerability of cells in response to hematoxylin, as shown in both the dose-response assay and the apoptosis assay (Figure 4A-B; supplemental Figure 3).

Hematoxylin (HEM)-induced apoptosis and disrupted CALR-MPL interaction in CALR-mutated cells. (A) Dose-response test of HEM in Ba/F3-MPL cell lines transduced with pMSCVpuro retroviral constructs carrying CALR WT, CALR del52, CALR del52 K111G, and CALR del52 D317G (n = 3). (B) Annexin V/PI staining of Ba/F3-MPL cells carrying GBD-mutated CALR del52 after HEM treatment for 24 hours. Annexin V+ cells were quantified as the apoptotic cells. Data are shown as mean ± standard deviation (SD; n = 3). The statistical test was conducted by 1-way analysis of variance (ANOVA) followed by Bonferroni’s multiple comparison tests (n = 3). (C) Dose-response test of HEM in Ba/F3-MPL cell lines transduced with retroviral constructs carrying JAK2 WT and JAK2V617F (n = 4). (D) Dose-response test of HEM in Ba/F3 cell lines that were cotransduced with retroviral constructs carrying erythropoietin receptor (EPOR) and CALR WT or CALR del52 (n = 3). (E) The interaction of mutant CALR and MPL was detected by the NanoBRET assay. EBNA cells were transfected with CALR del52-HaloTag and NanoLuciferase-MPL/EPOR constructs. Cells were treated with HEM for 24 hours at respective concentrations. The BRET ratio was calculated by dividing the donor bioluminescent signal (460 nm) by the acceptor bioluminescent signal (618 nm). EPOR-CALRdel52 was used as negative control for background signal. (F) Quantification of the NanoBRET assay result. Data are shown as mean ± SD. The statistical test was calculated by 1-way ANOVA followed by Tukey’s multiple comparisons test. (G) HEM binding with mutant and WT CALR tested by the cellular thermal shift assay. HEK293T cells were transfected with pcDNA3.1 CALR ins5/CALR WT/MPL constructs. HEM or DMSO was added to cell lysates before heating at respective temperatures for 6 minutes. Western blot was used to detect the soluble fraction of the protein lysates. The lysates were treated with DMSO/1 mM of HEM and incubated with a gradient of temperatures (left). The lysates were treated with multiple concentrations of HEM and incubated with a gradient of temperatures (bottom). *P < .05, **P < .01, ****P < .0001.
Hematoxylin (HEM)-induced apoptosis and disrupted CALR-MPL interaction in CALR-mutated cells. (A) Dose-response test of HEM in Ba/F3-MPL cell lines transduced with pMSCVpuro retroviral constructs carrying CALR WT, CALR del52, CALR del52 K111G, and CALR del52 D317G (n = 3). (B) Annexin V/PI staining of Ba/F3-MPL cells carrying GBD-mutated CALR del52 after HEM treatment for 24 hours. Annexin V+ cells were quantified as the apoptotic cells. Data are shown as mean ± standard deviation (SD; n = 3). The statistical test was conducted by 1-way analysis of variance (ANOVA) followed by Bonferroni’s multiple comparison tests (n = 3). (C) Dose-response test of HEM in Ba/F3-MPL cell lines transduced with retroviral constructs carrying JAK2 WT and JAK2V617F (n = 4). (D) Dose-response test of HEM in Ba/F3 cell lines that were cotransduced with retroviral constructs carrying erythropoietin receptor (EPOR) and CALR WT or CALR del52 (n = 3). (E) The interaction of mutant CALR and MPL was detected by the NanoBRET assay. EBNA cells were transfected with CALR del52-HaloTag and NanoLuciferase-MPL/EPOR constructs. Cells were treated with HEM for 24 hours at respective concentrations. The BRET ratio was calculated by dividing the donor bioluminescent signal (460 nm) by the acceptor bioluminescent signal (618 nm). EPOR-CALRdel52 was used as negative control for background signal. (F) Quantification of the NanoBRET assay result. Data are shown as mean ± SD. The statistical test was calculated by 1-way ANOVA followed by Tukey’s multiple comparisons test. (G) HEM binding with mutant and WT CALR tested by the cellular thermal shift assay. HEK293T cells were transfected with pcDNA3.1 CALR ins5/CALR WT/MPL constructs. HEM or DMSO was added to cell lysates before heating at respective temperatures for 6 minutes. Western blot was used to detect the soluble fraction of the protein lysates. The lysates were treated with DMSO/1 mM of HEM and incubated with a gradient of temperatures (left). The lysates were treated with multiple concentrations of HEM and incubated with a gradient of temperatures (bottom). *P < .05, **P < .01, ****P < .0001.
To exclude the possibility that hematoxylin hypersensitivity was conferred by mutant CALR–independent inhibition of the JAK-STAT pathway, we tested the drug effect on cells carrying a JAK2V617F mutation (Figure 4C). JAKV617F mutation did not sensitize cells to hematoxylin treatment, suggesting a mutant CALR–dependent mechanism. To show that hematoxylin selectivity was dependent on MPL but not on another type I cytokine receptor, we tested the drug on cells that were transduced with the EPOR. Ba/F3-EPOR CALR del52 cells did not show hypersensitivity to hematoxylin treatment, indicating the drug effect was conferred by an MPL-specific mechanism (Figure 4D).
Hematoxylin binds to CALR and disrupts CALR-MPL interaction
Because the GBD was predicted to mediate the interaction between MPL and the mutant CALR protein, we hypothesized that the binding of hematoxylin could disrupt this interaction. First, we applied the NanoBRET assay to detect the potential interference of hematoxylin with CALR del52-MPL interaction (Figure 4E-F; supplemental Figure 4).22 The EPOR was used in the assay as a background control, because it has substantial homology with MPL but does not interact with CALR del52.22 The addition of hematoxylin reduced CALR-MPL interaction in a dose-dependent manner, indicating that the occupancy of the GBD by hematoxylin blocked MPL binding to mutant CALR (Figure 4F). To further prove the binding of the compound to CALR, we next performed the CETSA.23,24 We transiently expressed either mutant or WT CALR in HEK293T cells with hematoxylin added to the cell lysates. The melting temperatures of both mutant and WT CALR were increased by hematoxylin compared with the DMSO control, suggesting that the physical interaction between the proteins and the drug stabilized the protein to the heat denaturation (Figure 4G). The absence of selectivity of binding between WT and mutant CALR was a result of the GBD presence in both forms of the protein. We used MPL as a control and did not observe interaction with hematoxylin.
Hematoxylin reduces the cellular abundance of mutant CALR and inhibits STAT5 phosphorylation
To investigate how hematoxylin affects mutant CALR and JAK-STAT signaling, we treated Ba/F3-MPL CALR WT and CALR-mutant cells with the drug for 24 hours and collected both RNA and protein samples. Real-time polymerase chain reaction suggested a mild increase in both WT and mutant CALR messenger RNAs caused by the drug treatment (Figure 5A). Interestingly, western blot analysis showed a striking downregulation of both mutant CALR and MPL in both heterozygous and homozygous CALR-mutant cells upon drug treatment (Figure 5B). The abundance of WT CALR was not affected in CALR WT cells and was upregulated in heterozygous CALR-mutant cells. Next, we examined the time course of hematoxylin action in CALR WT and heterozygous and homozygous CALR-mutant cells. The reduction of mutant CALR was first detectable at 1 hour posttreatment, and more drastic reduction was observed at the 8-hour time point (Figure 5C). The reduction of mutant CALR was accompanied by a decrease in phosphorylated STAT5 and an upregulation of the apoptotic marker cleaved PARP (Figure 5C). The reduction in mutant CALR could also be detected in UT-7/TPO CALR-mutant cells (Figure 5D).
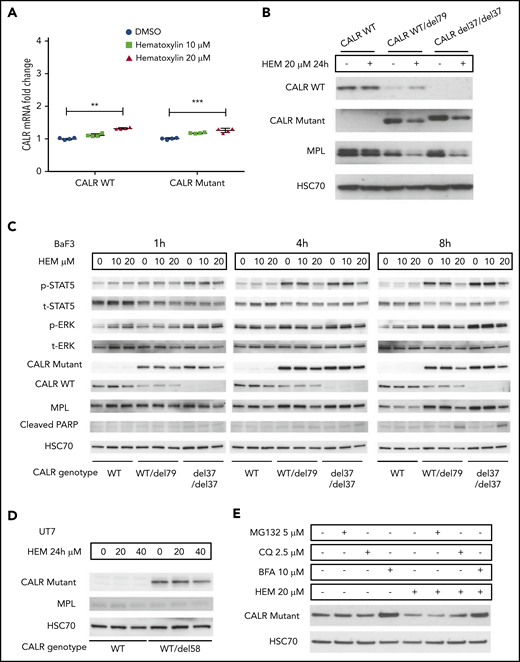
Hematoxylin reduced the intracellular abundance of mutant CALR and inhibited JAK-STAT signaling. (A) Real-time polymerase chain reaction analysis of 24-hour treatment of hematoxylin in Ba/F3-MPL cell lines. Ba/F3-MPL CALR WT and the CRISPR-Cas9–generated CALR del37/del37 cell lines were treated with 20 μM of hematoxylin or equivalent amount of DMSO as the control for 24 hours before cell collection and RNA extraction (n = 4). The statistical test was conducted by a 2-tailed paired Student t test. (B) Western blot analysis of 24-hour treatment of hematoxylin in Ba/F3-MPL cell lines. Ba/F3-MPL CALR WT cells and CRISPR-Cas9–generated CALR WT/del79 and CALR del37/del37 cell lines were treated with 20 μM of hematoxylin or equivalent amount of DMSO as control for 24 hours before cell extraction and lysis. (C) Effect of time course treatment of hematoxylin on Ba/F3-MPL CALR WT, WT/del79, and del37/del37 cell lines. Hematoxylin was added at 20 μM for the indicated time before collection and cell lysis. (D) Western blot analysis of 24-hour treatment of hematoxylin in UT-7/TPO cell lines. CALR WT cell line and CRISPR-Cas9–generated CALR del58/WT cell lines were used and treated with indicated concentrations of hematoxylin. (E) Effect of multiple inhibitors on CALR protein level. All the indicated inhibitors were added for 8 hours in Ba/F3-MPL CALR del79/WT cell line. **P < .01, ***P < .001. BFA, brefeldin A; CQ, chloroquine.
Hematoxylin reduced the intracellular abundance of mutant CALR and inhibited JAK-STAT signaling. (A) Real-time polymerase chain reaction analysis of 24-hour treatment of hematoxylin in Ba/F3-MPL cell lines. Ba/F3-MPL CALR WT and the CRISPR-Cas9–generated CALR del37/del37 cell lines were treated with 20 μM of hematoxylin or equivalent amount of DMSO as the control for 24 hours before cell collection and RNA extraction (n = 4). The statistical test was conducted by a 2-tailed paired Student t test. (B) Western blot analysis of 24-hour treatment of hematoxylin in Ba/F3-MPL cell lines. Ba/F3-MPL CALR WT cells and CRISPR-Cas9–generated CALR WT/del79 and CALR del37/del37 cell lines were treated with 20 μM of hematoxylin or equivalent amount of DMSO as control for 24 hours before cell extraction and lysis. (C) Effect of time course treatment of hematoxylin on Ba/F3-MPL CALR WT, WT/del79, and del37/del37 cell lines. Hematoxylin was added at 20 μM for the indicated time before collection and cell lysis. (D) Western blot analysis of 24-hour treatment of hematoxylin in UT-7/TPO cell lines. CALR WT cell line and CRISPR-Cas9–generated CALR del58/WT cell lines were used and treated with indicated concentrations of hematoxylin. (E) Effect of multiple inhibitors on CALR protein level. All the indicated inhibitors were added for 8 hours in Ba/F3-MPL CALR del79/WT cell line. **P < .01, ***P < .001. BFA, brefeldin A; CQ, chloroquine.
To examine the mechanism of mutant CALR depletion in hematoxylin-treated cells, we tested 2 possible mechanisms: protein degradation and secretion. We used MG132 as a proteasome inhibitor and chloroquine as a lysosome inhibitor. Neither of the 2 inhibitors rescued the loss of mutant CALR protein upon hematoxylin treatment. In contrast, BFA, a protein secretion inhibitor, markedly upregulated the mutant CALR level, suggesting the secretory pathway might be involved (Figure 5E).
We generated hematoxylin-resistant cell lines by incubating CALR-mutant cells with high-dose hematoxylin continuously. All the selected clones showed an upregulation of mutant CALR and resistance to the drug-induced reduction of the protein, revealing a universal hematoxylin resistance mechanism (supplemental Figure 5A-B). Furthermore, we edited the GBD regions located at exons 3 and 7 of the CALR gene in the mutant CALR cells using CRISPR-Cas9 technology followed by hematoxylin selection (supplemental Figure 6A). CALR-knockout cells were enriched by the hematoxylin selection (supplemental Figure 6B-C).31 In comparison with the control, both exon 3– and exon 7–edited groups showed resistance to hematoxylin treatment (supplemental Figure 6D). This suggests that the ablation or mutation of CALR in the oncogenic CALR-mutant cells abolishes their sensitivity to hematoxylin. We confirmed the result by isolating the resistant clones and genotyping them. Seventy percent (42 of 60) of individual clones carried mutations at the targeted CALR region. Sixty percent (36 of 60) of clones carried the mutations that led to an early stop codon and the knockout of CALR. Five clones carried in-frame mutations that replaced between 8 and 12 amino acids near the GBD (supplemental Figure 6E). These clones were confirmed to be cytokine dependent, suggesting the loss of CALR oncogenicity. This result supports our hypothesis that only oncogenic CALR cells are hypersensitive to hematoxylin treatment.
Potency and selectivity of chemical analogs of hematoxylin
Hematoxylin possesses a bis-catechol structure. To examine whether other catechols that are analogs to hematoxylin display similar inhibitory effects as hematoxylin, we tested 5 available chemical analogs. Of these, brazilin, the closely related natural compound of hematoxylin, showed the lowest IC50 among all the compounds tested. Methylation of the hydroxyl groups of hematoxylin seemed to reduce the potency of the drug, and the change of the polyheterocyclic ring structure largely compromised the selectivity (Figure 6; supplemental Figure 7). We also tested 2 clinically used drugs for MPN patients, ruxolitinib and hydroxyurea. CALR-mutant cells were more sensitive to ruxolitinib compared with WT cells, but the magnitude of the selectivity was smaller than that of hematoxylin. Hydroxyurea did not show any selective effect (Figure 6).
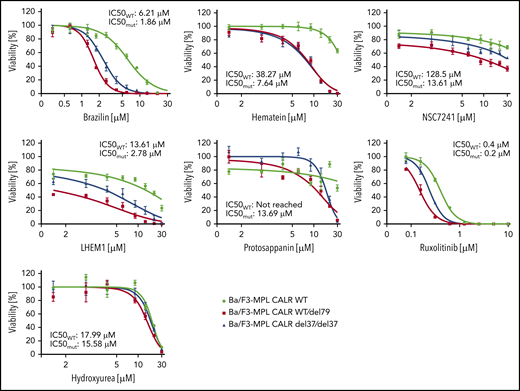
The inhibitory effect on CALR-mutated cells was tested using chemical analogs of hematoxylin and MPN clinically used drugs. CALR WT, heterozygous mutant, and homozygous mutant cell lines were treated with indicated drugs for 72 hours. IC50 was calculated by Graphpad Prism 7.0. Mutant IC50 was calculated as the mean of heterozygous and homozygous mutant cells (n = 3).
The inhibitory effect on CALR-mutated cells was tested using chemical analogs of hematoxylin and MPN clinically used drugs. CALR WT, heterozygous mutant, and homozygous mutant cell lines were treated with indicated drugs for 72 hours. IC50 was calculated by Graphpad Prism 7.0. Mutant IC50 was calculated as the mean of heterozygous and homozygous mutant cells (n = 3).
Hematoxylin showed a selective inhibitory effect on patient CD34+ cells
To further validate our result in primary patient samples, we isolated CD34+ cells from healthy individuals, CALR patients, and JAK2 patients and performed the colony formation assay. We observed sustained inhibition of colony-forming unit formation by hematoxylin in the CALR-mutant cases, with a much greater variability in responses to the drug in the healthy controls and JAK2 patients. The compound treatment significantly reduced the number of colony-forming units derived from CALR-mutated patients, but it did not do so in the healthy controls or JAK2 patients (Figure 7A; supplemental Figures 8 and 9). After normalization, we report a 40.5% killing in CALR patients, compared with 22.3% in healthy controls and 23.6% in JAK2 patients. This result suggests that a mild preferential inhibitory effect of hematoxylin is also present in human primary CALR-mutated hematopoietic progenitor cells. We also detected the reduction of mutant CALR in the CD34+ cells of 3 CALR patients after hematoxylin treatment, suggesting the effect of the drug on mutant CALR is also present in the primary patient samples.
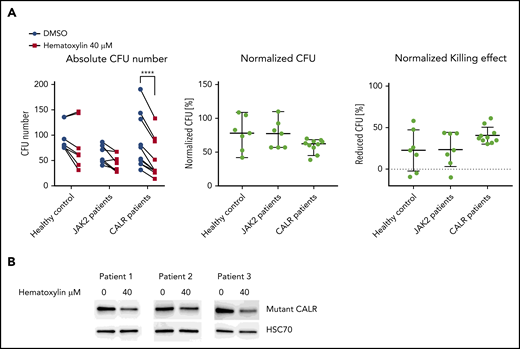
Hematoxylin inhibited the colony-forming capacity of CALR patient–derived CD34+ cells. (A) The colony formation assay of healthy individuals and JAK2V617F and CALR patients after hematoxylin treatment. CD34+ cells from 7 healthy controls, 7 JAK2 patients, and 10 CALR patients were isolated and plated for 10 to 14 days with DMSO or 40 μM of hematoxylin treatment before colony counting. Two-way analysis of variance followed by Sidak’s multiple comparisons test was used for P value calculation. Absolute colony count (left). Colony number of hematoxylin-treated plates normalized to the DMSO control plates from the same individual (middle). Reduced colony number of hematoxylin-treated plates normalized to the DMSO control plates from the same individual (bottom). (B) Western blot detecting mutant CALR protein extracted from CD34+ cells from 2 CALR del52/WT patients and 1 CALR ins5/WT patient with or without hematoxylin treatment. CD34+ cells were treated with DMSO or 40 μM of hematoxylin in StemSpan SFEM II with CD34+ expansion supplement for 16 hours before collection and protein extraction. ****P < .0001.
Hematoxylin inhibited the colony-forming capacity of CALR patient–derived CD34+ cells. (A) The colony formation assay of healthy individuals and JAK2V617F and CALR patients after hematoxylin treatment. CD34+ cells from 7 healthy controls, 7 JAK2 patients, and 10 CALR patients were isolated and plated for 10 to 14 days with DMSO or 40 μM of hematoxylin treatment before colony counting. Two-way analysis of variance followed by Sidak’s multiple comparisons test was used for P value calculation. Absolute colony count (left). Colony number of hematoxylin-treated plates normalized to the DMSO control plates from the same individual (middle). Reduced colony number of hematoxylin-treated plates normalized to the DMSO control plates from the same individual (bottom). (B) Western blot detecting mutant CALR protein extracted from CD34+ cells from 2 CALR del52/WT patients and 1 CALR ins5/WT patient with or without hematoxylin treatment. CD34+ cells were treated with DMSO or 40 μM of hematoxylin in StemSpan SFEM II with CD34+ expansion supplement for 16 hours before collection and protein extraction. ****P < .0001.
Discussion
CALR mutations contribute to a large proportion of JAK2− essential thrombocythemia and primary myelofibrosis patients who could potentially benefit from CALR-based targeted therapies. Therefore, searching for compounds that inhibit the oncogenic function of mutant CALR has great clinical significance. CALR is a novel target for small-molecule inhibitors and requires an exploration of an effective targeting domain. Previous studies reported genetic evidence indicating the importance of the GBD of mutant CALR in its oncogenic function.12,15,22 Mutagenesis experiments have pinpointed specific amino acids, such as W319, D135, and Y109, of mutant CALR as being indispensable in JAK-STAT pathway activation. Consistent with previous findings, our experiments suggest additional amino acids in the pocket, such as K111 and D317, to be essential as well (Figure 1B). Cocrystallization and 3-dimensional structural analyses of CALR and a synthetic tetrasaccharide have provided evidence that the same amino acid residues required for mutant CALR oncogenic activity are also involved in the tetrasaccharide binding.19 In this study, we explored if the GBD of CALR is a potential therapeutic targeting domain.
Through an exploration of a large set of chemical structures by in silico analysis and cell-based dose-response validation, a group of catechols was identified as top hits. In the Ba/F3-MPL cell line model, we compared the selectivity of these compounds with that of hydroxyurea and ruxolitinib, which are standard treatments for MPNs. A superior selectivity effect of such compounds, including hematoxylin and brazilin, was observed (Figure 6). This selective effect was observed not only in Ba/F3 background but also in the human UT-7/TPO cells and in patients’ CD34+ cells (Figures 2D and 7A; supplemental Figure 2).
Using hematoxylin as the representative compound from these catechols, we demonstrated its selectivity in the elimination of the CALR-mutant cells using a coculture competition assay (Figure 2F; supplemental Figure 2). Despite TPO being present in the assay, hematoxylin induced the depletion of CALR-mutant cells. These data suggest that hematoxylin does not simply restore the TPO dependence of CALR-mutant cells but rather triggers apoptosis (Figure 3A-B).
To prove that the hematoxylin effect is specific to mutant CALR, we tested the drug in the cells carrying C-terminal–truncated CALR or in CALR-deficient cells. In both cases, the cells were not susceptible to the drug, implying that hematoxylin is specifically inhibiting growth and provoking apoptosis of cells with oncogenic CALR (Figure 3C-D). Because binding of hematoxylin to the GBD is expected to have an impact on CALR-MPL interaction, we measured this interaction on the drug treatment by NanoBRET assay, which monitors interactions at a distance of <10 nm.32 We showed for the first time that a small-molecule inhibitor could disrupt the CALR-MPL interaction (Figure 4E-F). We further confirmed that the GBD is crucial to this protein interaction, consistent with the published mutagenesis studies.15,22 Because the GBD is located in the shared part of the WT and mutant CALR, the compound binds both forms of the protein. Indeed, this was confirmed by the CETSA results (Figure 4G). Despite the fact that hematoxylin binds both WT and mutant CALR, cells with WT CALR tolerated high hematoxylin doses, likely because calreticulin is not essential in the studied hematopoietic cell lines. Accordingly, Calr gene knockout by CRISPR-Cas9 did not result in reduced viability of Ba/F3 cells (data not shown). Therefore, we believe that the drug effect on WT CALR might not generate severe toxicity. Additionally, the essentiality of CALR suggested by mouse studies is due to its function in maintaining calcium homeostasis, especially in the heart muscle in the embryonic stage.33 Targeting the GBD should not affect its calcium binding function. We also observed a higher intracellular protein abundance of WT CALR compared with mutant protein, consistent with other studies.9,34 This could also contribute to identifying a therapeutic dosing window of the drug.
The mechanism of cell death induced by hematoxylin in CALR-mutant cells is likely due to the disruption of the mutant CALR-MPL interaction (Figure 4E-F), depletion of intracellular mutant CALR protein, and inhibition of TPO-independent JAK-STAT pathway activation (Figure 5C). Interestingly, mutant CALR protein levels were reduced by hematoxylin treatment, whereas WT CALR was unaffected or increased (Figures 5B-D and 7B). The reduced mutant CALR protein after hematoxylin treatment was observed in both cell line models and patients’ CD34+ cells. This was not due to a change in messenger RNA levels, suggesting that a posttranslational mechanism might be involved (Figure 5A). The blocking of proteasomal or lysosomal degradation did not restore the mutant CALR protein abundance; this suggests that the secretory pathway may be involved. Indeed, treatment with BFA restored the intracellular mutant CALR protein levels in the presence of hematoxylin (Figure 5E). We hypothesize that the disruption of CALR-MPL interaction has 2 consequences. First, mutant CALR (which does not have the KDEL ER retention signal) maintains its intracellular localization through its interaction with MPL. Because of the disruption of this interaction upon hematoxylin treatment, the mutant CALR loses its anchor and exits the cell by the secretory pathway. When we inhibited the secretory pathway using BFA, it caused intracellular retention of mutant CALR, which supports this hypothesis.34 Second, mutant CALR has been shown to be a functional chaperone of MPL that is immaturely glycosylated in cells carrying mutant CALR.12,22 Because mutant CALR can no longer stabilize the immaturely glycosylated MPL, it leads to MPL degradation (Figures 5B and 6B). This could explain why the presence of TPO cannot rescue CALR-mutant cells from hematoxylin-induced apoptosis (Figure 3A-B). On the other hand, the presence of 50 ng/mL of IL-3 significantly reduced the drug-induced apoptosis, suggesting the activation of the JAK-STAT pathway by the IL-3 receptor might compromise the drug-induced cell death. This rescue effect could explain a smaller magnitude of drug selectivity in the patients’ colony formation assay, because a nonphysiological concentration of IL-3 was used in the assay.
Although hematoxylin shows promising data in our in vitro study, its medical use, particularly in vivo use, might have limitations. As a natural chemical compound that has been primarily used for histological staining, the pharmacological properties of hematoxylin as a pharmaceutical still need to be tested. In addition, the effective dose of hematoxylin in our cell-based assays was in the micromolar to the millimolar range. The relatively high dose of hematoxylin might imply a low affinity of the target engagement. To date, the production of hematoxylin is limited to the extraction of the compound from logwood. The synthesis and chemical modification of hematoxylin require further research. We endeavored to search for more potent analogs or derivatives, but only brazilin achieved lower IC50 in the cytotoxicity assay (Figure 6). All these data indicate that searching for more potent inhibitors with a high-standard pharmacological property for in vivo medical use is required.
The targeted therapeutic approaches in MPNs are relatively underdeveloped. In particular, few treatment approaches manage to eliminate mutant hematopoietic stem cells specifically. Among MPN patients, those with primary myelofibrosis have the worst clinical outcomes and the most definite tendency to have their disease evolve into acute myeloid leukemia. Because approximately one-third of primary myelofibrosis patients carry a CALR mutation, this population could benefit most from CALR inhibitor therapy. Our study provides proof-of-concept data showing that targeting the GBD of CALR can lead to the disruption of CALR-MPL interaction and the inhibition of oncogenic signaling in CALR-mutated cells. We have also identified hematoxylin as a lead compound for the synthesis of more potent derivatives.
Requests for data sharing should be e-mailed to the corresponding author, Robert Kralovics (robert.kralovics@meduniwien.ac.at).
The online version of this article contains a data supplement.
The publication costs of this article were defrayed in part by page charge payment. Therefore, and solely to indicate this fact, this article is hereby marked “advertisement” in accordance with 18 USC section 1734.
Acknowledgments
The authors thank Heinz Gisslinger (Medical University of Vienna) for providing the patient materials and Yoko Edahiro (Juntendo University Graduate School of Medicine) for providing the UT-7/TPO cell line.
This study was supported by Austrian Science Fund (FWF) (grants SFB F4702 and P29018-B30) (R.K.) and by FWF Stand-Alone Project (grant P30041-B26) (H.N.). S.N.C. receives funding from Fondation Contre le Cancer, Salus Sanguinis, Action de Recherché Concertée (grant 16/21-073), and WELBIO (grant F 44/8/5–MCF/UIG–10955).
Authorship
Contribution: R.K. conceived and designed the study, interpreted the data, and wrote the manuscript; R.J. designed and performed the experiments, analyzed and interpreted the data, and wrote the manuscript; T.B. and A.N. designed and conducted specific experiments; T.B., A.N., and S.N.C. analyzed the BRET experiment data; V.A. and R.L. designed and conducted the molecular docking study and the chemical synthesis; H.N., E.X., L.K., and J.W. contributed to conducting specific experiments and cell line engineering; and S.N.C., S.K., and O.Z. contributed to manuscript writing.
Conflict-of-interest disclosure: Myelopro Diagnostics and Research GmbH reports holding a pending patent application (EPO 18202112.1–1110) regarding the use of small-molecule compounds in targeting mutant CALR. R.K., O.Z., and S.N.C. are cofounders of Myelopro Diagnostics and Research GmbH. The remaining authors declare no competing financial interests.
Correspondence: Robert Kralovics, Department of Laboratory Medicine, Medical University of Vienna, 18-20 Währinger Gürtel, 1090 Vienna, Austria; e-mail: robert.kralovics@meduniwien.ac.at.

This feature is available to Subscribers Only
Sign In or Create an Account Close Modal