

Abstract
Clonal evolution, the process of expansion and diversification of mutated cells, plays an important role in cancer development, resistance, and relapse. Although clonal evolution is most often conceived of as driven by natural selection, recent studies uncovered that neutral evolution shapes clonal evolution in a significant proportion of solid cancers. In hematological malignancies, the interplay between neutral evolution and natural selection is also disputed. Because natural selection selects cells with a greater fitness, providing a growth advantage to some cells relative to others, the architecture of clonal evolution serves as indirect evidence to distinguish natural selection from neutral evolution and has been associated with different prognoses for the patient. Linear architecture, when the new mutant clone grows within the previous one, is characteristic of hematological malignancies and is typically interpreted as being driven by natural selection. Here, we discuss the role of natural selection and neutral evolution in the production of linear clonal architectures in hematological malignancies. Although it is tempting to attribute linear evolution to natural selection, we argue that a lower number of contributing stem cells accompanied by genetic drift can also result in a linear pattern of evolution, as illustrated by simulations of clonal evolution in hematopoietic stem cells. The number of stem cells contributing to long-term clonal evolution is not known in the pathological context, and we advocate that estimating these numbers in the context of cancer and aging is crucial to parsing out neutral evolution from natural selection, 2 processes that require different therapeutic strategies.
Introduction
During cancer development, mutations accumulate over time, leading to the expansion and diversification of clones, cancer cells that share a specific set of mutations inherited from a common ancestor (Box 1). This process, known as clonal evolution, plays an important role in cancer development, progression, therapy resistance, and relapse.1,2
Definitions
Clone: Cells that share a specific set of mutations inherited from a common ancestor.
Linear evolution: A Russian doll organization of clones whereby each new mutant clone grows within the previous one.
Branched evolution: Multiple mutant clones arise independently and grow in parallel.
Natural selection: Process that changes allele frequencies across generations as the result of better-adapted clones contributing more offspring to the next generation compared with less well–adapted clones.
Neutral evolution: Evolution without natural selection (ie, the mutations introduced do not confer a functional advantage or disadvantage).
Genetic drift: Stochastic process in which allele frequencies change across generations purely by chance (eg, because 1 clone randomly has more cell death than another). It occurs in all finite populations but has the largest effect in small populations.
Hitchhiking: Process that allows neutral or weakly deleterious mutations to reach high frequency as a result of their presence in a clone that also has ≥1 driver mutation.
Effective population size: The cells that effectively contribute to clonal evolution.
Clonal evolution is increasingly depicted as an evolutionary process driven by natural selection (Box 1). In this framework, clones expand and outcompete other clones as a result of the fitness advantage conferred by their mutations. The mutations that increase fitness and confer a clonal growth advantage are called driver mutations. They represent a crucial target for cancer treatment and are subject to many clinical and biological investigations.3-5 Of note, a driver mutation can be selected through tumorigenesis but need not be required for cancer maintenance. In parallel, cells also accumulate neutral mutations, called passenger mutations, which do not confer any fitness advantage and, therefore, are not subject to natural selection. Neutral evolution of these passenger mutations can also shape clonal evolution, notably by a phenomenon called genetic drift, in which the allele frequencies of a mutation change over time because of mere chance (Box 1). Additionally, when passenger mutations occur in the same cells as driver mutations, the passenger mutations increase their allele frequency with the driver mutations. This phenomenon, called hitchhiking (Box 1), can also participate in clonal evolution. Exactly how the interplay between neutral evolution and natural selection shapes clonal evolution in cancer is disputed. Indeed, although natural selection is the dominant view, different studies have uncovered that neutral evolution shapes clonal evolution in more cases of cancer than expected.6-8 Although it seems counterintuitive that malignant hematological phenotypes, such as aberrant growth, could be associated with neutral evolution, it is possible that mutations that are neutral in the stem cells gain a selective advantage in other hematopoietic compartments, resulting in cancerous aberrant growth. For example, in some patients with chronic myelomonocytic leukemia (CMML), certain mutated clones expand more in myeloid differentiating cells than in stem cells as a result of increased sensitivity to granulocyte-macrophage colony-stimulating factor.9,10 In hematological malignancies, the role of neutral evolution has been less investigated with the exception of multiple myeloma, in which it has been linked to a poor prognosis.11
Distinguishing driver mutations from passenger mutations is not always straightforward. Functional assays to test the impact of mutations on cell fitness are the gold standard, but they are cumbersome to carry out on each mutation. Alternatively, recurrent mutations across patients with the same cancer type is a sign of natural selection but difficulties in mutation calling12-14 and neutral mutational hotspots complicate this inference.15,16 In other words, some recurrent mutations can look like driver mutations because they are occurring more frequently. Lastly, the architecture of clonal evolution can serve as indirect evidence of natural selection or neutral evolution. Clonal architecture is described as linear when the new mutant clone grows within the previous one (Figure 1A) and branched when multiple mutant clones arise independently and grow in parallel (Figure 1B). Of note, classification as linear or branched architecture might vary if the mutations are detected using targeted sequencing or whole-exome sequencing, because more mutations are recovered with whole-exome sequencing, resulting in more complex architecture. A linear architecture is typically interpreted as the output of natural selection, whereas neutral evolution has been described as an extreme case of branched evolution.6,7,17-19 Intriguingly, although branched evolution has been reported in solid tumors and hematological malignancies, most, if not all, cases of linear evolution reported so far are in hematological malignancies.10,20-28

Clonal architecture can follow 2 types of organization: linear and branched evolution. (A) Linear evolution refers to a Russian doll-like organization where each new clone occurs inside the previous one. Thus, each new clone inherits all of the previous mutations. (B) Branched evolution refers to parallel evolution of different clones. These 2 clonal architectures can be represented in various ways, including phylogenetic trees that reconstruct the occurrence of mutations through time (top), fishplots that, in addition, represent the growth of each new clone through time (middle), or slices that capture the clonal architecture similarly to the fishplot but at a particular time point (bottom).
Clonal architecture can follow 2 types of organization: linear and branched evolution. (A) Linear evolution refers to a Russian doll-like organization where each new clone occurs inside the previous one. Thus, each new clone inherits all of the previous mutations. (B) Branched evolution refers to parallel evolution of different clones. These 2 clonal architectures can be represented in various ways, including phylogenetic trees that reconstruct the occurrence of mutations through time (top), fishplots that, in addition, represent the growth of each new clone through time (middle), or slices that capture the clonal architecture similarly to the fishplot but at a particular time point (bottom).
Importantly, clonal architecture has been associated with different prognoses and impacts clinical outcome. In chronic lymphocytic leukemia, an increased number of subclonal driver mutations was associated with an inferior failure-free survival, whereas an increase in clonal drivers was not.29 In acute myeloid leukemia (AML), clonal dominance has been associated with a worse prognosis,30 whereas branched evolution of signaling mutations conveyed an inferior event-free survival compared with linear evolution.31 These various associations between clonal architecture and clinical outcomes highlight the importance of understanding the underlying processes that drive clonal architecture. Although most reports of linear evolution implicitly assume natural selection, the role of neutral evolution in shaping linear clonal architectures has not been investigated.
Here, we discuss the role of natural selection and neutral evolution in the production of linear clonal architectures in hematological malignancies. Although it is tempting to attribute linear evolution to natural selection, we argue that a smaller number of contributing stem cells (SCs) accompanied by drift can also result in a linear pattern of evolution, as illustrated by simulations of clonal evolution in hematopoietic SCs (HSCs). The number of SCs contributing to long-term clonal evolution is not known in the pathological context, and we advocate that estimating these numbers in the context of cancer and aging is crucial to parsing out neutral evolution from natural selection, 2 processes that require different therapeutic strategies.
A role for neutral evolution in linear architecture of hematological malignancies?
Although linear evolution seems to be a hallmark of hematological malignancies, linear and branched evolution have been reported for patients with the same hematological malignancies,10,20,23,24 and patients sometimes transition from 1 type to the other.32-34 Little is known about what differs between patients with linear and branched evolution, and understanding whether natural selection or neutral evolution mechanistically drives linear evolution has never been discussed. Given that linear evolution can result in more favorable outcomes for patients,29,31 this discussion is of importance for the design of therapeutic interventions.35
Linear evolution follows a pattern that intuitively looks consistent with a model of natural selection (Figure 1A): each new driver mutation provides a selective advantage, enabling those cells to outcompete previous clones, resulting in sequential dominant clones that expand and sometime sweep the whole compartment. Figure 2 illustrates this scenario using a toy model to simulate clonal evolution in the HSC population (supplemental Information, available on the Blood Web site). When the fitness advantage conferred by each mutation increases (here their probability to self-renew), the linearity index and the final clone sizes increase (Figure 2A-B). When mutations confer a strong selective advantage, the result is linear evolution, similar to that observed in patients (Figure 2C).
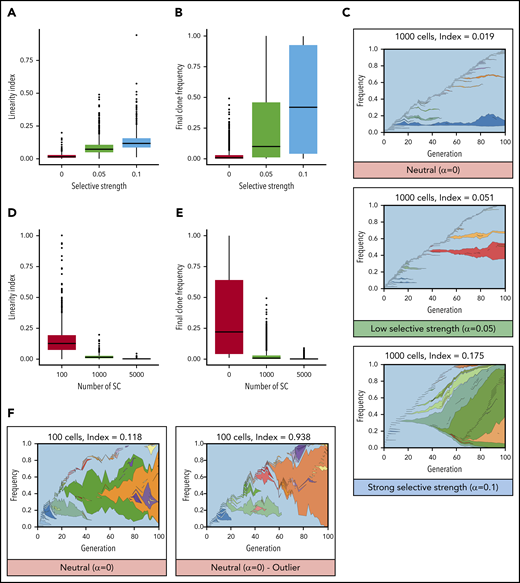
Mathematical modeling of clonal evolution illustrates that linear evolution requires natural selection to occur in large populations but can occur through drift in small populations. (A-C) Simulations of a Moran model with 1000 cells and with increasing selective strength (increasing probability to self-renew upon acquisition of a mutation, α). When α = 0, evolution is neutral, and all cells have equal probability to self-renew whether mutant or not. When α > 0, mutated cells have an increased probability to expand (ie, mutations increase their fitness). (A) Linearity indices at t = 100 for selective strengths α = 0, α = 0.05, and α = 0.1. (B) Final clone frequency for all remaining clones across all simulations at t = 100 for selective strengths α = 0, α = 0.05, and α = 0.1. (C) Representative examples of clonal evolution in these simulations. The text above indicates the numbers of cells remaining and the linearity index at the end of the simulation. (D-F) Simulations with neutral evolution (α = 0) for 100, 1000, and 5000 SCs. (D) Linearity indices at t =100 for 100, 1000, and 5000 SCs. (E) Final clone frequency for all remaining clones across all simulations at t = 100 for 100, 1000, and 5000 SCs. (F) Representative example of clonal evolution for 100 cells, and 1 example of an outlier with a high linearity index.
Mathematical modeling of clonal evolution illustrates that linear evolution requires natural selection to occur in large populations but can occur through drift in small populations. (A-C) Simulations of a Moran model with 1000 cells and with increasing selective strength (increasing probability to self-renew upon acquisition of a mutation, α). When α = 0, evolution is neutral, and all cells have equal probability to self-renew whether mutant or not. When α > 0, mutated cells have an increased probability to expand (ie, mutations increase their fitness). (A) Linearity indices at t = 100 for selective strengths α = 0, α = 0.05, and α = 0.1. (B) Final clone frequency for all remaining clones across all simulations at t = 100 for selective strengths α = 0, α = 0.05, and α = 0.1. (C) Representative examples of clonal evolution in these simulations. The text above indicates the numbers of cells remaining and the linearity index at the end of the simulation. (D-F) Simulations with neutral evolution (α = 0) for 100, 1000, and 5000 SCs. (D) Linearity indices at t =100 for 100, 1000, and 5000 SCs. (E) Final clone frequency for all remaining clones across all simulations at t = 100 for 100, 1000, and 5000 SCs. (F) Representative example of clonal evolution for 100 cells, and 1 example of an outlier with a high linearity index.
However, we argue that the hypothesis that linear evolution could also come from neutral evolution must not be discarded too rapidly. The neutral evolution model is usually presented as an extreme case of branched evolution,6,19 in which random mutations with no fitness advantage accumulate over time, driving clonal evolution in the absence of any natural selection.36 Nevertheless, this representation results from the hidden assumption that the population of cells that effectively contributes to clonal evolution, called the “effective population size” in population genetics, is large. Indeed, in large populations, in the absence of natural selection, clones rarely expand to a large frequency; therefore, it is likely that new mutations occur outside of preexisting clones. In contrast, it is well established that effective populations of small size are more susceptible to genetic drift, in which some clones expand more than others by mere chance (ie, the expansion of clones is not due to an increased fitness).37,38 In hierarchical models, such as blood, in which only SCs can self-renew and give rise to all other cells, clonal evolution is driven by cancer stem cells (CSCs),39 a small fraction of the cancer cells (in evolutionary terms, the effective population size is incredibly small compared with the census population size). Therefore, it is possible that a low number of contributing SCs in blood cancer could favor linear clonal evolution as the result of clones being more subject to genetic drift (ie, a particular case of neutral evolution in a roughly constant-sized population in which some clones grow bigger by mere chance). Figure 2D-F illustrate this point using the same toy model as before, this time removing the selective advantage conferred by mutations and, instead, varying the number of SCs. The linearity index increases with a smaller number of contributing SCs (Figure 2D). Simulations of small SC compartments frequently develop sizable clones (Figure 2E) and, in some cases, present examples of linear evolution similar to the patterns observed in patients (Figure 2F).10,21,22,24-26 When the number of SCs increases, the impact of genetic drift becomes minor. In summary, although linear evolution seems to be driven by natural selection, it can also result from neutral evolution through genetic drift if the number of contributing SCs is sufficiently low.
In practice, other investigators have reported a role for neutral evolution in 17% to 20% of patients with multiple myeloma, and this was associated with a shorter survival.11 However, in that study, neutral evolution was not linked to clonal architecture, which is complex in that disease.40 Applying the same approach and R2 threshold8 to 17 whole genome–sequenced CMML patient samples,23 a type of leukemia in which linear evolution is frequent,10,21 we found that 4 of the 17 patients fit the neutral evolution model (UPN57, UPN62, UPN64, UPN65; Figure 3A; supplemental Information), similar to the proportion in multiple myeloma.11 In this CMML cohort, patient UPN62 had 6 exonic mutations, among which 5 potential drivers (Figure 3B) organized in a linear clonal architecture (Figure 3C), making it a good candidate for clonal evolution driven by natural selection. Yet, the R2 value of 0.9967 also indicates that the mutations subsequent to the TET2 mutation occurred through neutral evolution. This example illustrates that neutral evolution is a plausible interpretation of clonal evolution in some patients with myeloid malignancies. Separating neutral evolution and natural selection is an oversimplification, because both mechanisms occur in parallel. It is possible that neutral evolution and natural selection successively drive clonal evolution.41 For example, in linear evolution, the first mutation could be a driver and increase the fitness of the clone, and subsequent mutations could be neutral and confer no growth advantage over that of the first. Many combinations of natural selection and neutral evolution can be envisaged.
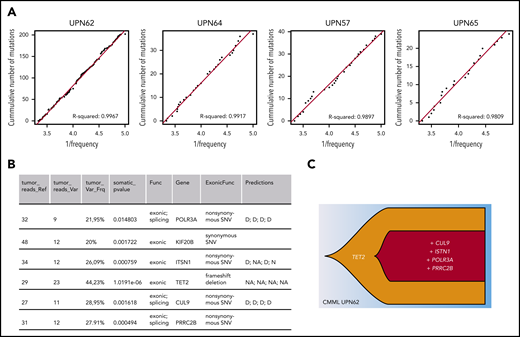
Neutral evolution in a CMML patient with linear evolution. (A) Inverse mutation allele frequency vs cumulative number of mutations from CMML patient tumors from Merlevede et al.21 The R2 value was computed as in Johnson et al,11 filtering mutations outside of the frequency range of 0.12 to 0.3. R2 > 0.98 was taken as samples compatible with neutral evolution and displayed. (B) Table listing exonic mutations of patient UPN62. This information was extracted from Merlevede et al,21 which reports results from whole-genome sequencing of 17 CMML patients. The final column states the impact of the mutation as predicted by Merlevede et al.21 (C) Fishplot representing the clonal architecture of the patient with the putative driver mutations (TET2 mutations are present in ∼60% of CMML patients, and mutations in PRRC2B have recently been identified as recurrent in CMML patients21 ). Drawn in R using the fishplot library.99,100 D, damaging mutation; N, neutral mutation; NA, not available.
Neutral evolution in a CMML patient with linear evolution. (A) Inverse mutation allele frequency vs cumulative number of mutations from CMML patient tumors from Merlevede et al.21 The R2 value was computed as in Johnson et al,11 filtering mutations outside of the frequency range of 0.12 to 0.3. R2 > 0.98 was taken as samples compatible with neutral evolution and displayed. (B) Table listing exonic mutations of patient UPN62. This information was extracted from Merlevede et al,21 which reports results from whole-genome sequencing of 17 CMML patients. The final column states the impact of the mutation as predicted by Merlevede et al.21 (C) Fishplot representing the clonal architecture of the patient with the putative driver mutations (TET2 mutations are present in ∼60% of CMML patients, and mutations in PRRC2B have recently been identified as recurrent in CMML patients21 ). Drawn in R using the fishplot library.99,100 D, damaging mutation; N, neutral mutation; NA, not available.
Is the number of contributing HSCs compatible with genetic drift?
Because neutral evolution can produce linear architecture when the population of long-term contributing SCs is small, estimating the number of contributing SCs is crucial to assess the potential role of neutral evolution in hematological malignancies. More precisely, for genetic drift to play a significant role in SCs within the timescale of a human lifetime, it is not the absolute number of SCs that matters, rather it is the number of SCs multiplied by the time between symmetric divisions.42,43 Of course, to contribute to cancer, the SCs that have undergone genetic drift also need to differentiate into blasts or more mature cells.
In healthy individuals, current estimates of HSCs are derived from indirect evidence (eg, the detection of somatic mutations in downstream cells in 1 individual),42 and range from as few as 385 active HSCs in steady-state44 to as many as 50 000 to 600 000 HSCs in adult hematopoiesis.42,43,45,46 Although the former estimates leave room for neutral linear evolution, the latter renders it implausible.
In hematological malignancies, a number of unknowns should make us cautious before ruling out neutral evolution. First, although there are a few estimates of HSC number for healthy individuals, they are not necessarily applicable to clonal evolution in cancer. In the context of hematological malignancies, it is unknown whether the number of CSCs contributing to clonal evolution is similar to the number of HSCs in healthy hematopoiesis and how this depends on the type of malignancy. In addition, cancer clones start from single mutated cells that multiply and expand over time; therefore, the early disease stage necessarily consists of a small number of cells. Therefore, genetic drift may play a sizeable role during this time period. Second, age and personal medical history may also, transiently or permanently, have a considerable impact on the size of the relevant HSC compartment. Several studies suggest decreased clonal diversity,47,48 exhaustion of HSC functionality,49-51 and increased functional heterogeneity among HSCs with age.48 The number of HSCs contributing to hematopoiesis in the elderly, the group most likely to develop myeloid malignancies, is unknown. In addition, the specific biological challenges encountered by an individual can also impact the number of HSCs. Some of the challenges shown to reduce the number of HSCs or induce quiescence include obesity,52,53 viral and bacterial infection,54,55 autoimmune disease (eg, acquired aplastic anemia),56 total body irradiation, and radiotherapy and chemotherapy used in the treatment of solid cancers.57
All of these challenges that reduce HSC numbers have been associated with the occurrence of clonal hematopoiesis: the overrepresentation of a single clone in the blood or bone marrow.58-60 However, the respective role of natural selection and neutral evolution in these clonal expansions has yet to be fully elucidated. The fact that synonymous (nonfunctional) mutations are rarely observed at high allele frequency in the blood of healthy people is good evidence in favor of natural selection in clonal hematopoiesis.43 However, whole-genome sequencing has shown that clonal hematopoiesis in some patients occurs with no known driver mutations.61,62 This observation has led to different interpretations, depending on the size of the SC population assumed or inferred. Assuming a relatively small number of SCs and relying on low-depth sequencing, Zink et al concluded that the allele frequencies of mutations were consistent with genetic drift.62 Conversely, Poon et al concluded that there must be hidden driver mutations to explain the allele frequency distribution of synonymous mutations.63 In conclusion, current evidence points to a role for natural selection in clonal hematopoiesis, but more evidence is needed before ruling out a role for neutral evolution.
Another interesting case is HSC transplantation, which results in a bottleneck in SC number. Only a limited number of cells initially seed and expand to regenerate the whole hematopoietic system, a situation that could be favorable to drift. Using the insertion site of the lentiviral vector used for gene therapy in HSCs from patients with Wiskott-Aldrich Syndrome, Biasco and colleagues estimated that 1600 to 4300 transduced HSCs were actively contributing to long-term hematopoiesis,64,65 a range that, particularly at the lower end, could allow a role for genetic drift. Interestingly, clonal hematopoiesis from donors can be engrafted in patients,66-69 the likelihood of a clone persistently engrafting is not dependent on the donor allele frequency,66 and there is no clear relationship between clone size in the recipient and that in the donor.66,68 These discrepancies between donor and recipient can be attributed to a change in the selection pressure due to transplantation or variability due to drift.
In addition to uncertainties in the number of HSCs in various physiological contexts, it has been extensively shown that HSCs are heterogeneous in their functional properties (eg, in their differentiation potential,70-72 cell cycle time,73 downstream cellular output,73-76 and level of quiescence70,77 ). The heterogeneity in HSC properties has several implications for the estimation of the SC effective population size. SCs (CSCs or HSCs) that exhaust their self-renewal potential because of a limit on the number of divisions78 or SCs that stay quiescent throughout the period of interest cannot make relevant contributions to clonal evolution.79 If SCs have stable, but heterogeneous, output, the relevant SC pool may be different for different malignancies.72 More fundamentally, recent studies have led to intense debate over the contribution of HSCs in homeostatic hematopoiesis, with some studies suggesting that they are largely dispensable.80-84 Similar investigations remain to be performed in hematological malignancies. Lastly, although progress in live imaging has started to shed light on the spatial distribution and motility of SCs in the bone marrow,85 the impact of cell-mixing dynamics on clonal evolution remains unexplored and is likely to impact our interpretation of genomic data.
Although the effective population size in HSCs and CSCs remains difficult to address and is largely unknown, it is clear that it can vary widely depending on context and life history. These variations might impact the processes that drive clonal evolution and the resulting clonal architecture by making linear evolution more or less likely to occur through genetic drift. To determine whether and when clonal evolution in hematological malignancies is mainly driven by natural selection or neutral evolution, it is crucial to determine the number of SCs actively contributing to clonal evolution.
Implications of potential genetic drift for cancer treatment
Distinguishing whether natural selection and/or neutral evolution plays a role in clonal evolution has some consequences for the design of therapeutic interventions. In particular, it might be important in the case of minimal residual disease and relapse to determine whether the residual clone is made of cells that are intrinsically resistant to the treatment or escape for some other reason.86 Some therapeutic strategies to handle these issues rely on the assumption of natural selection. For example, adaptive therapies aim at maintaining clonal competition to avoid therapy escape,87,88 and evolutionary steering strategies aim at steering the tumor evolution with a first drug and then use a second drug to target Darwinian adaptation trade-off (ie, specific sensitivity associated with resistance to the first drug).89 Both are elegant solutions to avoid the issue of therapy escape, but both also rely on exploiting selective pressures or competition between clones and, thus, would be ineffective in cases in which intratumor diversity is dominated by neutral evolution. It is unclear whether neutral evolution can persist during treatment, whether treatment always introduces selective pressure that can be exploited to design treatment, or whether it creates a bottleneck even more favorable to genetic drift. In the context of natural selection, understanding the selective pressures and associated fitness advantage of cancer cells can help us to predict future clonal evolution and choose the appropriate treatment. In contrast, clones undergoing neutral evolution in small populations are subject to stochastic amplification or reduction in a less predictable way, which complicates the design of therapeutic intervention. It is possible that patients with the same hematological malignancies undergo different evolutionary processes, some driven primarily by natural selection and others undergoing neutral evolution. These different underlying processes, which might be hidden by apparent similarities in the clonal evolution architecture, could partially account for the observed clinical heterogeneity that cannot be fully explained by genetics.90 Developing tools to stratify patients based on natural selection or neutral evolution could help us to understand and better anticipate these different clinical paths.
In addition to cancer treatment, the role of neutral evolution might impact the interpretation of, and intervention, in clonal hematopoiesis.91 Although clones have been retrospectively identified several years before the diagnosis of AML,92,93 suggesting a potential window of therapeutic intervention to avoid transformation of clonal hematopoiesis to AML, most instances of clonal hematopoiesis remain benign (AML driver mutations are ubiquitously found in adults94 ). Being able to discriminate clonal hematopoiesis emerging by neutral evolution from that emerging because of natural selection could contribute to a better understanding of the various natural histories and a better identification of patients at risk for malignant transformation.
Conclusions and perspective
Although it is tempting to assume that the linear evolution observed in blood cancers is caused by natural selection acting on fitter clones, we should not ignore the possibility that linear evolution can result from neutral evolution through genetic drift if the number of contributing SCs is sufficiently low. To discriminate whether natural selection or genetic drift is causing linear architecture in blood cancer, further investigations into the number of SCs contributing to clonal evolution in the long-term in different contexts (aging, cancer) are required.
In cancers, in the absence of mechanistic studies demonstrating a gain of fitness, natural selection can only be inferred indirectly, from the observation of large clones and/or from the recurrence of mutations across patients. However, in the case of indirect evidence for positive selection, alternatives causes are also possible. When large clones are observed, they could also result from genetic drift if the population of SCs is small enough. When recurrent mutations are observed across patients, the mutations could be selected for; alternatively, they could occur more frequently (passenger hotspot).15,16
In practice, genetic drift could explain the presence of clones with no candidate driver mutations observed in some hematological malignancies (eg, 10% of myeloproliferative neoplasms),95,96 although it is always possible that genetic or epigenetic driver alterations have been undetected.63 In addition, genetic drift could explain growth of clones with mutations providing no clear fitness advantage to stem cells, such as JAK2V617F mutations97 and SRSF2P95H mutations98 ; however, others factors could be involved, such as the microenvironment, epimutations, or noncoding mutations. To evaluate the plausibility of genetic drift among these possibilities, a better knowledge of the number of contributing SCs and of the personal history of the patient (whether they might have suffered SC exhaustion) seems crucial.
Importantly, genetic drift can indirectly increase the risk of malignancies. Genetic drift could allow a mutation with no selective advantage in SCs, but a malignant phenotype in downstream cells, to expand in the SC compartment. When genetic drift is strong enough to favor linear evolution, it increases the likelihood of accumulating mutations, including potentially malignant combinations of mutations. Both processes might have important implications for cancer risk and management.
To conclude, we encourage the community to question the general assumption that clonal evolution by natural selection is the only possible driving force of blood cancer. It is important to consider other hypotheses to avoid the potential misinterpretation of observed phenomena, such as large clones. In addition, such assumptions have consequences for patients. For example, evolutionary steering strategies try to predict the course of evolution to avoid therapy escape, but they may not work well for neutrally evolving tumors. These hypotheses could also be relevant in the interpretation of minimal residual disease, the late reoccurrence of clones, and the phenomenon of clonal hematopoiesis. Thus, it is important to acknowledge that clonal evolution can occur without natural selection, even in instances of linear evolution and/or the presence of recurrent mutations, and to be able to distinguish clones that have expanded as a result of genetic drift from those that have expanded as a result of selection.
The online version of this article contains a data supplement.
Acknowledgments
The authors thank Jason Cosgrove, Olivier Delattre, Matthieu Duchmann, Efe Ilker, Arnaud Pocheville, Celine Vallot, Cristina Lo Celso, Jamie Blundell, and 2 anonymous reviewers for feedback on the manuscript.
This work was supported by an Association Technique de l'Industrie Papetière (ATIP)-Avenir grant from Centre National de la Recherche Scientifique (CNRS) and the Bettencourt-Schueller Foundation (L.P.), and 2 grants from the Labex CelTisPhyBio (ANR-10-LBX-0038) and Idex Paris-Science-Lettres Program (ANR-10-IDEX-0001-02 PSL) (L.P.). This work was also supported by a starting European Research Council (ERC) grant from the H2020 Program (758170-Microbar) (L.P.) and a James S. McDonnell Foundation grant (220020480.01) (L.L.).
Authorship
Contribution: A.M.-L. performed the simulation study with input from L.P. and L.L.; and based on L.L.’s initial idea, all of the authors conceived the study and wrote the manuscript.
Conflict-of-interest disclosure: The authors declare no competing financial interests.
Correspondence: Lucie Laplane, IHPST, 13 rue du Four, 75006 Paris, France; e-mail: lucie.laplane@univ-paris1.fr; and Leïla Perié, Institut Curie, CNRS UMR 168, 11 rue Pierre et Marie Curie, 75005 Paris, France; e-mail: leila.perie@curie.fr.

This feature is available to Subscribers Only
Sign In or Create an Account Close Modal