

Key Points
An innovative digital assay technology enables rapid, point-of-care measurement of multiple protein biomarkers in blood.
Continuous monitoring of protein blood biomarker profiles is shown for critically ill human patients with a digital assay.

Abstract
Digital protein assays have great potential to advance immunodiagnostics because of their single-molecule sensitivity, high precision, and robust measurements. However, translating digital protein assays to acute clinical care has been challenging because it requires deployment of these assays with a rapid turnaround. Herein, we present a technology platform for ultrafast digital protein biomarker detection by using single-molecule counting of immune-complex formation events at an early, pre-equilibrium state. This method, which we term “pre-equilibrium digital enzyme-linked immunosorbent assay” (PEdELISA), can quantify a multiplexed panel of protein biomarkers in 10 µL of serum within an unprecedented assay incubation time of 15 to 300 seconds over a 104 dynamic range. PEdELISA allowed us to perform rapid monitoring of protein biomarkers in patients manifesting post-chimeric antigen receptor T-cell therapy cytokine release syndrome, with ∼30-minute sample-to-answer time and a sub–picograms per mL limit of detection. The rapid, sensitive, and low-input volume biomarker quantification enabled by PEdELISA is broadly applicable to timely monitoring of acute disease, potentially enabling more personalized treatment.
Introduction
The evolution of biomarker-guided precision medicine therapies targeting specific pathologic processes has advanced rapidly, based on a greater understanding of genomic, molecular, and cellular data of an individual patient.1,2 However, implementing the precision medicine approach in acute clinical care faces significant challenges.3,4 In particular, timely diagnosis and treatment of a quickly evolving illness5-7 require both fast and sensitive measurements of biomarkers as well as accessibility near the patient. Numerous efforts have been undertaken to develop rapid immunodiagnostics, including assay step simplification,8 label-free biosensing,9-14 surface-to-volume ratio enhancement,15-17 active analyte mixing,18,19 and molecular preconcentration.20,21 Nonetheless, these methods generally sacrifice assay sensitivity and specificity, and they face significantly increased complexity and costs resulting from sophisticated microfabrication and nanofabrication. For a system with weak antigen–antibody affinity in which the protein-binding kinetics are solely limited by the surface reaction rate (reaction-limited regimen22 ), the aforementioned methods involving active mass transport enhancement or miniaturization become less effective for shortening the assay time.
Digital immunoassays are emerging techniques for biochemical analysis of analytes in low abundance,23,24 which have great potential for point-of-care diagnosis. Their superior single-molecule sensitivity originates from binary counting of on/off signals amplified within various types of small subvolume partitions.25 The wide use of digital assays can be found in the literature as a platform for the ultrasensitive detection of nucleic acids,26,27 proteins,25,28-30 single viruses,31 and exosomes.32 The most well-established commercial implantation of an enzyme-linked immunosorbent assay (ELISA)-based digital assay, namely digital ELISA (dELISA), is Simoa from Quanterix25 ; however, its high assay and instrumentation costs and large physical footprint prevent its application for near-bedside real-time diagnosis. Several other groups28,30,33,34 have invented microfluidic platforms for laboratory-on-a-chip operation of digital assays. Despite the exciting performance and potential for point-of-care operation, these platforms generally require a long sample incubation time, and they exhibit low multiplex capacity. Thus, a near-bedside platform that can provide near–real-time protein biomarker profiling with a large clinically relevant dynamic range from femtomolar to subnanomolar has the potential to fulfill the promise of biomarker-guided precision medicine in time-sensitive critical care.
Herein, we introduce the concept of instantaneous single-molecule binary counting of non-equilibrium protein-binding events to simultaneously realize speed and sensitivity, the 2 key combined features critically lacking in conventional technologies for acute illness. This concept provides the basis for the “pre-equilibrium digital ELISA” (PEdELISA) technique enabling a rapid, sensitive biomarker analysis with a significantly shorter (up to 10-fold) incubation time than that of the gold standard ELISA method. The technique captures the “snapshot” of a pre-equilibrated 2-step sandwich assay formation process quenched at its very early stage (within 15-300 seconds) and applies single-molecule binary counting for biomarker quantification (Figure 1A). In this study, we found that this early quenching approach maintained a large assay linear dynamic range from femtomolar to clinically relevant subnanomolar, which is conventionally believed to be far outside the range permitted by single-molecule binary counting.24,35 We developed a theoretical model to validate this concept and later demonstrated this concept with an automated, potentially near-bedside digital assay platform that could be rapidly performed at low cost and low sample volume. This approach enabled longitudinal profiling of circulating protein biomarkers in human patients treated with chimeric antigen receptor T-cell (CAR-T) therapy who were experiencing cytokine release syndrome (CRS), which is a potentially life-threatening disorder of immune activation.7,36
![PEdELISA assay platform for monitoring CAR T-therapy associated CRS. (A) Concept of the instantaneous single-molecule binary counting of pre-equilibrium protein-binding events. The combination of pre-equilibrium reaction quenching with single-molecule counting can theoretically achieve an assay with a near-0 incubation time without losing linearity. (B) Schematic and photo image of the PEdELISA system, which comprises a disposable microfluidic chip (inset), an automated fluidic dispensing and mixing module (left), and a 2-dimensional inverted fluorescence scanning module (right). (C) Two-step ultrafast, multiplex PEdELISA process for the pre-equilibrated assay system, including 5-minute magnetic bead incubation for the formation of antibody-antigen-antibody immune-complexes (step 1), buffer exchange, 1-minute avidin-HRP labeling (step 2), and 5-minute continuous washing using the automated fluidic dispensing module. The PEdELISA chip has 8 circular biosensor patterns formed by a cluster of 66 724 arrayed microwells. Fluorescence color-encoded magnetic beads coated with different capture antibodies (nonfluorescent and Alexa Fluor 488 [AF 488]) are pre-deposited into each physically separated biosensor pattern. This arrangement can permit multiplex analyte detection with 2 colors × 8 patterns = 16 plexes. Each chip can quantify up to 16 samples simultaneously per batch run. (D) Digital readout process, which involves loading of HRP fluorescence substrate (QuantaRed), sealing of beads with fluorocarbon oil, and signal reading based on automated fluorescence scanning to count fluorescently activated “on”-state microwells. Data analysis is then performed by a convolutional neural network–guided image-processing algorithm for high throughput and accurate single-molecule counting.](https://ash.silverchair-cdn.com/ash/content_public/journal/blood/137/12/10.1182_blood.2019004399/2/m_bloodbld2019004399f1.png?Expires=1769955343&Signature=rWEFNTvF~tU9vHWJYTqAJsA4trPp0YnyAQeLrVh3A8wnVe2KIJAley84y78c-56HEufWGHxa53TfkOHF4LoG0yLMOoXWtSyRe-LUBVotLKtQTszm1L~HhF5ZJXeBXABVNuUKw~smxm3f33owIlNUKce25LS5gyEtDxf9YS40O65szIT7MfoHFQw24WSLKsobSbL-8O5EH6k6rzoHuxmQT~WgkHt3NRyLFd6SSKyhu4Mev5PuibeqRt0zzsS~5TOHVHnNQ4eC~TftODnj9Y2qQtZDoaeXeKpvdRV~t-Uk1ovRj~QJ6kXesEXgt4mNAD~HCqy01xeFIvss5IENRz~ORw__&Key-Pair-Id=APKAIE5G5CRDK6RD3PGA)
PEdELISA assay platform for monitoring CAR T-therapy associated CRS. (A) Concept of the instantaneous single-molecule binary counting of pre-equilibrium protein-binding events. The combination of pre-equilibrium reaction quenching with single-molecule counting can theoretically achieve an assay with a near-0 incubation time without losing linearity. (B) Schematic and photo image of the PEdELISA system, which comprises a disposable microfluidic chip (inset), an automated fluidic dispensing and mixing module (left), and a 2-dimensional inverted fluorescence scanning module (right). (C) Two-step ultrafast, multiplex PEdELISA process for the pre-equilibrated assay system, including 5-minute magnetic bead incubation for the formation of antibody-antigen-antibody immune-complexes (step 1), buffer exchange, 1-minute avidin-HRP labeling (step 2), and 5-minute continuous washing using the automated fluidic dispensing module. The PEdELISA chip has 8 circular biosensor patterns formed by a cluster of 66 724 arrayed microwells. Fluorescence color-encoded magnetic beads coated with different capture antibodies (nonfluorescent and Alexa Fluor 488 [AF 488]) are pre-deposited into each physically separated biosensor pattern. This arrangement can permit multiplex analyte detection with 2 colors × 8 patterns = 16 plexes. Each chip can quantify up to 16 samples simultaneously per batch run. (D) Digital readout process, which involves loading of HRP fluorescence substrate (QuantaRed), sealing of beads with fluorocarbon oil, and signal reading based on automated fluorescence scanning to count fluorescently activated “on”-state microwells. Data analysis is then performed by a convolutional neural network–guided image-processing algorithm for high throughput and accurate single-molecule counting.
PEdELISA assay platform for monitoring CAR T-therapy associated CRS. (A) Concept of the instantaneous single-molecule binary counting of pre-equilibrium protein-binding events. The combination of pre-equilibrium reaction quenching with single-molecule counting can theoretically achieve an assay with a near-0 incubation time without losing linearity. (B) Schematic and photo image of the PEdELISA system, which comprises a disposable microfluidic chip (inset), an automated fluidic dispensing and mixing module (left), and a 2-dimensional inverted fluorescence scanning module (right). (C) Two-step ultrafast, multiplex PEdELISA process for the pre-equilibrated assay system, including 5-minute magnetic bead incubation for the formation of antibody-antigen-antibody immune-complexes (step 1), buffer exchange, 1-minute avidin-HRP labeling (step 2), and 5-minute continuous washing using the automated fluidic dispensing module. The PEdELISA chip has 8 circular biosensor patterns formed by a cluster of 66 724 arrayed microwells. Fluorescence color-encoded magnetic beads coated with different capture antibodies (nonfluorescent and Alexa Fluor 488 [AF 488]) are pre-deposited into each physically separated biosensor pattern. This arrangement can permit multiplex analyte detection with 2 colors × 8 patterns = 16 plexes. Each chip can quantify up to 16 samples simultaneously per batch run. (D) Digital readout process, which involves loading of HRP fluorescence substrate (QuantaRed), sealing of beads with fluorocarbon oil, and signal reading based on automated fluorescence scanning to count fluorescently activated “on”-state microwells. Data analysis is then performed by a convolutional neural network–guided image-processing algorithm for high throughput and accurate single-molecule counting.
Materials and methods
Materials
We purchased human interleukin-6 (IL-6), tumor necrosis factor-α (TNF-α), IL-1β, IL-8, IL-10, IL-12, IL-17A, interferon-γ (INF-γ), monocyte chemoattractant protein-1 (MCP-1) capture, and biotinylated detection antibody pairs from BioLegend and human IL-2 antibody pairs from Invitrogen. The corresponding ELISA kit and LEGENDplex Human Inflammation Panel 1 bead-based immunoassays were purchased from BioLegend and the IL-2 ELISA kit from Thermo Fisher Scientific. Dynabeads (2.8 μm diameter carboxylic acid and epoxy-linked superparamagnetic beads), QuantaRed (an enhanced chemifluorescent horseradish peroxidase [HRP] substrate), Alexa Fluor 488 Hydrazide, EDC [1-ethyl-3-(3-dimethylaminopropyl) carbodiimide hydrochloride], Sulfo-NHS (sulfo-N-hydroxysulfosuccinimide), MES [2-(N-morpholino)ethanesulfonic acid] buffered saline, TBS StartingBlock T20 blocking buffer, and SuperBlock (PBS) blocking buffer were obtained from Thermo Fisher Scientific.
Patient blood sample collection and preparation
Subjects undergoing CAR-T therapy were recruited, and samples were collected with informed consent for each subject under the University of Michigan institutional review board protocol HUM00115179/UMCC 2016.051. Control samples were obtained from healthy volunteers with informed consent under the University of Michigan institutional review board protocol HUM00092161. All blood samples were collected on-site at the University of Michigan Hospital (Michigan Medicine). Venous blood was collected for serum into a vacutainer containing no anticoagulant. Blood samples were then transported to the laboratory, allowed to clot for ≥30 minutes, and processed for serum isolation. Samples were centrifuged at 1200g for 15 minutes at room temperature. The serum was then removed by pipette and portioned in 2-mL aliquots into screw-cap tubes. Serum aliquots were then transported fresh on wet ice for the PEdELISA assay or banked at −80°C.
Statistical analysis
All experiments were performed ≥3 times to obtain the error bar. Either duplicate or triplicate PEdELISA measurements were performed for the CAR T-patient samples at a single time point of the longitudinal cytokine profile monitoring test. Conventional ELISA and LEGENDplex multiplex assays were conducted in duplicate for banked serum samples collected at 20 selected time points. Pearson’s R2 value was used to quantify the PEdELISA to ELISA/LEGENDplex correlations. Group differences were tested by using an unpaired, 2-tailed Student t test with equal variance. A value of P < .05 was considered to be statistically significant. A standard score (z score) for the parameter x was given as z = (x – μ)/SD, where μ is the mean and SD is the standard deviation.
Results
PEdELISA platform
Figure 1B shows the schematic and photo image of the PEdELISA system incorporating a microarray biosensor design into the microfluidic chip for multiplex analysis (additional details are provided in supplemental Figures 1 and 2, available on the Blood Web site). We streamlined the PEdELISA reaction process to a 2-step format so that it only involves: (1) loading and mixing the analyte and detection antibody solution on the capture antibody-coated magnetic beads array to form the capture antibody-antigen-detection antibody complex (step 1); and (2) labeling with enzyme HRP (step 2) (Figure 1C). To ensure accurate single-molecule counting at a wide range (10 fM to 1 nM), which is relevant to clinical diagnosis, the process was designed to keep the population of fully labeled immune-complex molecules <1 per bead despite the original abundance of analyte molecules in each sample partition. In PEdELISA, this single-molecule counting condition is achieved by intentionally stopping the immunologic reaction with a washing buffer in its pre-equilibrium state (definition is provided in supplemental Figure 3).
The reaction process was followed by a digital signal detection process (Figure 1D), which includes loading a fluorescent substrate (QuantaRed) and confining the HRP catalyzed fluorophores to the tiny femtoliter-sized volumes by oil seal. This significantly amplified the readout signal up to single-molecule sensitivity for the immune-complex formation detection. The wells with activated fluorescence were imaged by using an inexpensive custom-designed 2-dimensional scanning system (supplemental Figure 4), and the data were analyzed by using an in-house image processing algorithm (supplemental Materials). We estimate that the average cost for reagents and device fabrication is $0.69 per test and that the component cost for the fluorescence imaging module is less than $5000 (supplemental Table 1). The 2-step assay format incorporated the conventional enzyme-labeling strategy using biotin–avidin linkages, which makes PEdELISA compatible with any commercially available ELISA reagents. We anticipate that the PEdELISA assay manifests cost advantages over the current commercial ELISA ($2 to $5 per test) or Luminex ($30 per test) technologies and their associated instrumentation.
Theoretical prediction of “quench-and-snapshot” measurement
We theoretically predicted outcomes of PEdELISA by accounting for mass transport and surface reaction for a theoretical “reaction volume” with a bead placed in its center (Figure 2A). We first modeled the simultaneous molecular interactions between the analyte molecules, the capture antibodies immobilized on the bead surface, and the detection antibodies freely floating in the reaction volume using the mass transport and Langmuir adsorption equations (Figure 2B; supplemental Materials). For simplicity, we assumed the same affinity for the capture and detection antibody molecules. The enzymatic labeling process was then modeled for a biotin–avidin linkage with an affinity37 of kon= 5.5 × 10⁸ M–1 s−1 and koff = 3.1 × 10⁻⁵ s−1 (Figure 2C).
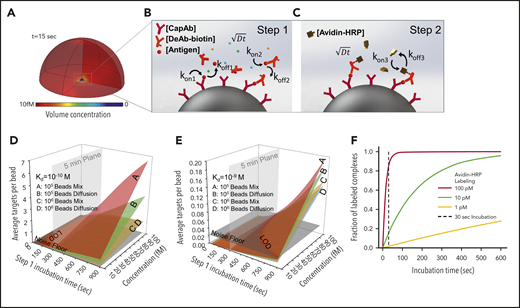
Finite element analysis of biomolecular interactions in the 2-step PEdELISA process. (A) Schematic of the theoretical sphere, namely the “reaction volume,” used for modeling work, whose quantity is equal to the total sample volume divided by the number of beads, assuming that the beads are evenly distributed in the buffer/sample solution. Reagent mass transport and binding kinetics are considered at the surface of a single magnetic bead placed in its center for one-half of the geometry due to symmetry. (B) Step 1: immune-complex formation process involving the conjugation between target antigen molecules, capture antibodies immobilized on the bead surface, and detection antibodies freely floating in the reaction volume. (C) Step 2: avidin-HRP labeling process involving the conjugation of avidin-HRP with the biotinylated detection antibodies. The average number of targets (ie, capture antibody-antigen-detection antibody immune-complexes) formed per bead, λ, is calculated as a function of the step 1 incubation time and the analyte concentration at Kd = 10−10 M (D) and Kd = 10−9 M (E). The model predicts that the PEdELISA readout linearly increases with the analyte concentration when λ is small (<0.1). By accounting for the experimentally obtained noise floor, the LOD value can be theoretically determined for a given value of the step 1 incubation time. (F) Predicted kinetics of the second step of the PEdELISA process. The fraction of the formation of HRP enzyme-labeled antibody-antigen-antibody immune-complexes is presented for 3 representative HRP concentrations (1 pM, 10 pM, and 100 pM).
Finite element analysis of biomolecular interactions in the 2-step PEdELISA process. (A) Schematic of the theoretical sphere, namely the “reaction volume,” used for modeling work, whose quantity is equal to the total sample volume divided by the number of beads, assuming that the beads are evenly distributed in the buffer/sample solution. Reagent mass transport and binding kinetics are considered at the surface of a single magnetic bead placed in its center for one-half of the geometry due to symmetry. (B) Step 1: immune-complex formation process involving the conjugation between target antigen molecules, capture antibodies immobilized on the bead surface, and detection antibodies freely floating in the reaction volume. (C) Step 2: avidin-HRP labeling process involving the conjugation of avidin-HRP with the biotinylated detection antibodies. The average number of targets (ie, capture antibody-antigen-detection antibody immune-complexes) formed per bead, λ, is calculated as a function of the step 1 incubation time and the analyte concentration at Kd = 10−10 M (D) and Kd = 10−9 M (E). The model predicts that the PEdELISA readout linearly increases with the analyte concentration when λ is small (<0.1). By accounting for the experimentally obtained noise floor, the LOD value can be theoretically determined for a given value of the step 1 incubation time. (F) Predicted kinetics of the second step of the PEdELISA process. The fraction of the formation of HRP enzyme-labeled antibody-antigen-antibody immune-complexes is presented for 3 representative HRP concentrations (1 pM, 10 pM, and 100 pM).
Using the key model parameters listed in supplemental Table 2, we predicted the kinetics of the antibody-antigen-antibody immune-complex formation process in step 1 of PEdELISA for the affinity value (Kd = 10−10 − 10−9 M) of typical commercially available antibodies. We plotted the average number of immune-complexes formed on a single bead surface, λ, as a function of the incubation time for the immune-complex formation process (step 1 incubation time) and the analyte concentration (Figure 2D-E). Here, the model shows that the kinetics of the immune-complex formation on the bead surface is nonlinear with time due to the simultaneous interactions of the target analyte to both the capture and detection antibody molecules. Nonetheless, the model predicts a linear increase in the quantity of the formed immune-complexes with the analyte concentration independent of time, the analyte mass transfer type (forced advection or passive diffusion), and the number of beads. This linear relationship allows the digital readout of PEdELISA to increase linearly with the analyte concentration even for a very short assay incubation time. This finding provides the theoretical foundation for securing both high sensitivity and a large linear dynamic range in our pre-equilibrium quenching approach.
This model allowed us to optimize the assay conditions accounting for the total number of beads per assay (supplemental Figure 5). The PEdELISA assay uniquely provides the means to shorten the assay time for a reaction rate-limited weak-affinity system (Kd = 10−9 M) (Figure 2E), in which other existing ultrafast immunoassay methods primarily driven by mass transport enhancement through active mixing or surface-to-volume ratio enhancement fail to achieve this. Figure 2F shows the kinetics of the labeling process for 3 representative avidin-HRP concentrations and suggests that the concentration of 100 pM is sufficiently large to complete the process with the incubation time (step 2 incubation time) of 30 seconds.
Analytical validation of the assay
Here, we developed a multiplex assay of 10 representative cytokine biomarkers (IL-6, TNF-α, IL-2, MCP-1, IL-1β, IL-8, IL-10, IL-12, IL-17A, and IFN-γ) that are involved in the progression of CRS, a significant complication of CAR-T therapy that can affect morbidity and mortality.38,39 To experimentally characterize the PEdELISA assay performance, we selected 4 (IL-6, TNF-α, IL-2, and MCP-1) and spiked 100 pg/mL of each cytokine into different types of buffers: the 1× ELISA diluent (1% bovine serum albumin, 0.05% Tween 20) and 10%, 25%, and 50% fetal bovine serum (FBS). We examined the impact of the different levels of background protein on the digital immunoassay signal pertaining to these fluids (supplemental Figure 6A-D). The signal-to-noise ratio was calculated, which is defined as the measured signal divided by the average blank signal + 3σ. In general, a larger surface blocking effect, perhaps owing to the presence of albumin, was observed for serum media, which resulted in a slightly lower spike-in signal and background noise compared with the ELISA buffer. However, there was no significant difference in the signal-to-noise ratio value between the different media groups (P > .1, n = 5-8; 1-way analysis of variance) (supplemental Figure 6E). We therefore selected 50% FBS as the assay buffer for recombinant protein dilutions to mimic the serum detection background.
Figure 3A-D shows standard curves for the 4 cytokines (IL-6, MCP-1, TNF-α, and IL-2) ranging from 0.32 pg/mL to 5 ng/mL in 25% FBS, with the step 1 incubation time varying from 60 to 300 seconds; the step 2 incubation time was fixed at 30 seconds. To push the limit of measurement speed, the assay was also tested with 15-second (step 1) and 30-second (step 2) incubation times by simply mixing all 3 reagents (detection antibody, avidin-HRP, and antigen) with magnetic beads (1-step assay format). As theoretically predicted, the digital readout (the ratio of fluorescence-activated “on” beads to all beads) is highly time dependent and, in general, linearly proportional to the analyte concentration. A variation was observed in the signal output depending on the cytokine species. This is likely due to the difference in the antibody pair affinity across the different cytokines. Notably, the linearity of the assay was confirmed over a three-order-of-magnitude concentration range regardless of the analyte type and well maintained even for the 15-second ultrafast PEdELISA assay of IL-6 (the primary mediator in CRS). Thus, quenching the extremely pre-equilibrated reaction does not compromise our measurement resolution.
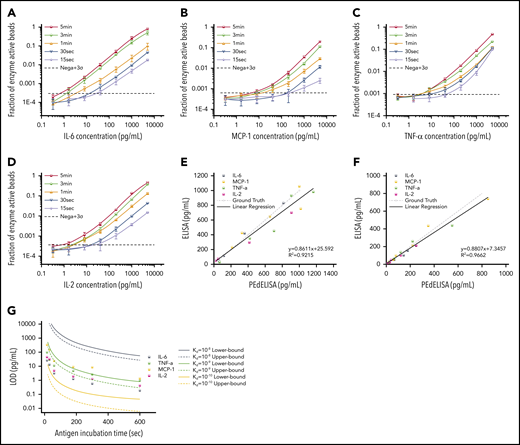
Characterization and optimization of PEdELISA assay. PEdELISA standard curves for the 4 cytokines: IL-6 (A), MCP-1 (B), TNF-α (C), and IL-2 (D). The step 1 incubation time varied from 60 to 300 seconds, and the step 2 incubation time was fixed at 30 seconds. Due to the extreme underlabeled nature of the assay, the 15- and 30-second assays were performed by merging the step 1 and step 2 process into a single step by mixing all required reagents. The LOD was determined by concentration from the reagent blank’s signal + 3σ (dotted line). Correlation between PEdELISA and conventional sandwich ELISA tests for the 4 cytokines using spike-in recombinant proteins in 25% fetal bovine serum: (E) 15-second PEdELISA incubation time (R2 = 0.92); and (F) 300-second PEdELISA incubation time (R2 = 0.97). The ground truth is plotted with a dotted line with scattered predetermined spike-in concentrations. (G) Theoretical (line) and experimental (scatter) LOD of PEdELISA as a function of the step 1 incubation time for 4 cytokines.
Characterization and optimization of PEdELISA assay. PEdELISA standard curves for the 4 cytokines: IL-6 (A), MCP-1 (B), TNF-α (C), and IL-2 (D). The step 1 incubation time varied from 60 to 300 seconds, and the step 2 incubation time was fixed at 30 seconds. Due to the extreme underlabeled nature of the assay, the 15- and 30-second assays were performed by merging the step 1 and step 2 process into a single step by mixing all required reagents. The LOD was determined by concentration from the reagent blank’s signal + 3σ (dotted line). Correlation between PEdELISA and conventional sandwich ELISA tests for the 4 cytokines using spike-in recombinant proteins in 25% fetal bovine serum: (E) 15-second PEdELISA incubation time (R2 = 0.92); and (F) 300-second PEdELISA incubation time (R2 = 0.97). The ground truth is plotted with a dotted line with scattered predetermined spike-in concentrations. (G) Theoretical (line) and experimental (scatter) LOD of PEdELISA as a function of the step 1 incubation time for 4 cytokines.
We further validated the assay by comparing measurement results for spiked-in FBS samples between the conventional 3-step sandwich ELISA and PEdELISA with the step 1 incubation time of 15 seconds (Figure 3E) and 300 seconds (Figure 3F). The ground truth (spike-in) value of the analyte concentration was set between 40 pg/mL (2 pg/mL) and 1000 pg/mL for the 15-second (300-second) assay. Good agreement was found between the 2 methods for both the 15-second (R2 = 0.92) and 300-second (R2 = 0.96) assays. Considering the noise floor of our experimental setup, we theoretically predicted the minimum incubation time for a given target value of limit of detection (LOD) using our model and compared it vs our experimental data (Figure 3G). An excellent match was found between the experimental data and the theoretical curves with the assumption of typical antibody affinities ranging from 10−9 to 10−10 M. We observed and established a tradeoff relationship between the LOD and incubation time of the digital assay. With an incubation time <60 seconds, it becomes difficult to precisely control the assay timing, which tends to cause more error to the measurement. We therefore selected a 300-second incubation time for the later clinical study to maintain high sensitivity and reliability. The standard curves for the other cytokines are provided in supplemental Figure 7. We also verified the assay’s specificity by quantifying the different antibody pair’s cross-reactivity (supplemental Figure 8). The assay LODs and the root mean square coefficient of variance accumulated over the titration experiments for the 10 cytokines are summarized in supplemental Table 3.
Multiplexed cytokine monitoring of CAR T-cell therapy–associated CRS
We applied PEdELISA to monitor the cytokine profiles of patients with hematologic cancer exhibiting different levels of CRS symptoms after CAR T-cell therapy following a preapproved sample collection protocol (discussed in “Materials and methods”). CRS or cytokine storm frequently accompanies various diseases, including cancer immunotherapy,7 macrophage activation syndrome in autoimmune disease,40 severe sepsis,41 or the recent global outbreak of the novel coronavirus pneumonia (ie, COVID-19).42,43 It can rapidly evolve (ie, within 24-48 hours) from manageable constitutional symptoms (grade 1) to more severe forms (grade 2-4),36,44 for which rapid and sensitive serum cytokine measurements could direct urgent interventions.43,45-47 Here, for one of the patients with the most severe CRS (patient 06), a near-real-time cytokine profile analysis was performed within 2 hours after blood samples were freshly drawn, with a sample-to-answer time of ∼30 minutes (Figure 4A). To ensure the highest accuracy and sensitivity for these clinical measurements, we chose the total incubation time to be 300 seconds (step 1) + 60 seconds (step 2) in the 2-step assay format.
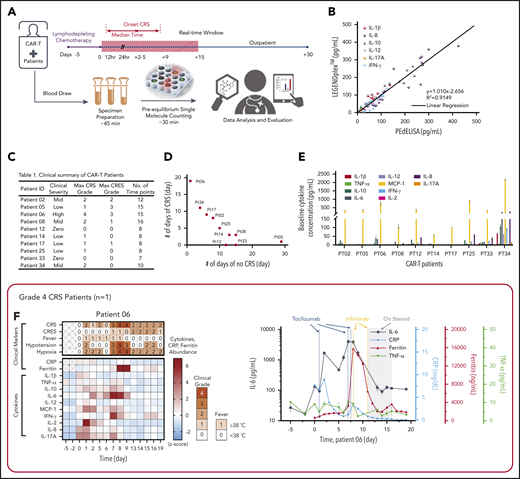

Rapid longitudinal cytokine profile monitoring of patients with hematologic cancer undergoing CAR T-cell therapy. (A) Representative timeline of cytokine profile monitoring. Daily blood draw in general started 5 days before the infusion for baseline collection until the patient was discharged. In the near-real-time monitoring test, the sample was first processed within 45 minutes of blood draw to extract serum and then tested by using the PEdELISA assay within 1 hour. The data typically became available for clinicians within 2 to 3 hours from the initial point of patient blood collection. (B) Good agreement (R2 = 0.915) between the PEdELISA and LEGENDplex assays found in measurements of 20 CAR T-patient samples at time points randomly chosen for 6 cytokines. (C) Clinical summary of 10 CAR-T patients that includes the maximum CRS score/CRES grade and the number of measurement time points. (D) Distribution of CRS and non-CRS periods (days) during the entire inpatient duration for 10 CAR-T patients. (E) Baseline cytokine levels of CAR-T patients before CAR T-cell infusion. (F-O) Heatmaps showing the clinical severity quantified according to CRS and CRES grading, the standard scores (z scores) of CRP and ferritin levels, and the standard scores (z scores) of serum cytokine profiles obtained by PEdELISA for 10 CAR-T patients. The grading of CRS, CRES, hypotension, and hypoxia was based on the American Society for Transplantation and Cellular Therapy Consensus Grading.36 Here, each standard score (z score) was calculated based on triplicate measurements of each analyte concentration value. Day 0 represents the day of CAR T-cell infusion; data before day 0 represent the baseline. The patients were grouped according to the severity of CRS or neurotoxicity. (F) Data of patient 06 (grade 4 severe CRS). (G-I) Data of patients 02, 08, and 34 (grade 2 mid-CRS). (J) Data of patient 05 (grade 3 neurotoxicity). (K-O) Data of patients 12, 14, 17, 25, and 33 (grade 0-1 mild or no CRS). Time plots of concentration are additionally shown for IL-6 and TNF-α to provide information on the outcomes of the treatments with tocilizumab (anti–IL-6R) and infliximab (anti–TNF-α). The green/yellow dotted vertical lines represent the time points of tocilizumab/infliximab dosing. The shadow region in panels F and J represents the period in which the patients received dexamethasone.
Rapid longitudinal cytokine profile monitoring of patients with hematologic cancer undergoing CAR T-cell therapy. (A) Representative timeline of cytokine profile monitoring. Daily blood draw in general started 5 days before the infusion for baseline collection until the patient was discharged. In the near-real-time monitoring test, the sample was first processed within 45 minutes of blood draw to extract serum and then tested by using the PEdELISA assay within 1 hour. The data typically became available for clinicians within 2 to 3 hours from the initial point of patient blood collection. (B) Good agreement (R2 = 0.915) between the PEdELISA and LEGENDplex assays found in measurements of 20 CAR T-patient samples at time points randomly chosen for 6 cytokines. (C) Clinical summary of 10 CAR-T patients that includes the maximum CRS score/CRES grade and the number of measurement time points. (D) Distribution of CRS and non-CRS periods (days) during the entire inpatient duration for 10 CAR-T patients. (E) Baseline cytokine levels of CAR-T patients before CAR T-cell infusion. (F-O) Heatmaps showing the clinical severity quantified according to CRS and CRES grading, the standard scores (z scores) of CRP and ferritin levels, and the standard scores (z scores) of serum cytokine profiles obtained by PEdELISA for 10 CAR-T patients. The grading of CRS, CRES, hypotension, and hypoxia was based on the American Society for Transplantation and Cellular Therapy Consensus Grading.36 Here, each standard score (z score) was calculated based on triplicate measurements of each analyte concentration value. Day 0 represents the day of CAR T-cell infusion; data before day 0 represent the baseline. The patients were grouped according to the severity of CRS or neurotoxicity. (F) Data of patient 06 (grade 4 severe CRS). (G-I) Data of patients 02, 08, and 34 (grade 2 mid-CRS). (J) Data of patient 05 (grade 3 neurotoxicity). (K-O) Data of patients 12, 14, 17, 25, and 33 (grade 0-1 mild or no CRS). Time plots of concentration are additionally shown for IL-6 and TNF-α to provide information on the outcomes of the treatments with tocilizumab (anti–IL-6R) and infliximab (anti–TNF-α). The green/yellow dotted vertical lines represent the time points of tocilizumab/infliximab dosing. The shadow region in panels F and J represents the period in which the patients received dexamethasone.
In addition to spike-in tests of known analytes (Figure 3E-F), we assayed 20 banked serum samples from 3 different patients with unknown concentrations of IL-1β, IL-8, IL-10, IL-12, IL-17A, and IFN-γ using both PEdELISA and a commercial multiplex assay, LEGENDplex (BioLegend). The results of these 2 assay methods showed a strong linear correlation (R2 = 0.915), providing additional validation of the 2-step PEdELISA assay for multiplex cytokine detection (Figure 4B).
The patients studied exhibited a range of CRS severity, including high-grade (patient 06), mid-grade (patients 02, 08, and 34), and low-grade (patients 05, 14, 17, and 25), as well as no CRS (patients 12 and 33), after CAR T-cell infusion (Figure 4C-D). Patients exhibited heterogeneous cytokine profiles immediately before CAR T-cell infusion (Figure 4E; supplemental Table 4 provides details on the clinical background of patients). To capture the patients’ dynamic immune responses to CAR T-cell therapy and immunomodulatory interventions, blood samples were collected and processed for serum daily except for weekends (Saturdays and Sundays). Figure 4F-O presents the heatmaps of longitudinal cytokine profiles for the patients together with clinical indicators (CRS, CAR T-cell–related encephalopathy syndrome [CRES] grade, fever, hypotension, and hypoxia) and clinical inflammatory markers (C-reactive protein [CRP] and ferritin). Here, each marker’s concentration values are normalized by the z score (discussed in “Materials and methods”), and the data are grouped according to the severity of the patients’ CRS conditions. For the patients receiving immunomodulatory treatments, Figure 4F-J provides longitudinal plots of the quantitative values of selected cytokines with higher relevance to the treatments next to the heatmaps. These plots show the effects of anti-inflammatory drugs, including tocilizumab (anti–IL-6R) and infliximab (anti–TNF-α), and corticosteroid (dexamethasone) on cytokine profiles. The treatments for these patients (supplemental Table 5) were chosen solely based on clinical criteria (eg, CRS grades), not on serum cytokine data.
For patient 06, who initially had a high disease burden, the time to initial onset of CRS was as short as 13.5 hours. Levels of several biomarkers, such as MCP-1, IL-1β, IL-2, and IL-8, rose rapidly and reached peak values within 24 hours after CAR-T infusion: MCP-1 = 2947 pg/mL, IL-1β = 75.3 pg/mL, IL-2 = 39.72 pg/mL, and IL-8 = 415 pg/mL. These values correlated with the patient’s grade 2 CRS, accompanying a fever (39.3°C) on day 1 (Figure 4F). We also observed a continuous rise of IL-6 transiently after the first tocilizumab administration (day 1) from 89.9 pg/mL (day 1) to its peak level of 1676 pg/mL through day 2. Patient 06 later developed grade 3 to 4 life-threatening CRS on days 6 to 9 and was readmitted to the ICU. During this period, IL-6 and IFN-γ approached extremely high levels (IL-6 = 4383 pg/mL; IFN-γ = 224.7 pg/mL), as indicated by the red colors on the heatmap. Several other cytokines, such as MCP-1, IL-1β, IL-8, IL-10, and IL-17A, also exhibited second peaks, despite administration of multiple immunosuppressive agents (supplemental Table 5). Interestingly, we did not see a significant rise in TNF-α and IL-2 during the second CRS peak. On day 11, the patient was diagnosed with grade 3 CRES and treated with steroids (dexamethasone). Overall, the cytokine levels significantly decreased after these treatments.
Regarding patients with grade 2 CRS, patient 02 exhibited a temporarily large increase in IL-6 level after tocilizumab administration (Figure 4G). The patient received the first dose on day 2 with grade 1 CRS, and a peak (1546 pg/mL) was detected for IL-6 on day 3. Similarly, patient 08 (Figure 4H) received tocilizumab on day 8 with grade 2 CRS, and a peak (228.5 pg/mL) was detected for IL-6 on day 9. Patient 34 did not receive tocilizumab, and the level of IL-6 consistently stayed in the narrow range between 300 and 500 pg/mL, with no dynamic changes throughout the CRS period for this patient.
Patient 05 did not develop CRS after the CAR T-cell infusion, although a slight elevation of all 4 cytokines was observed on days 0 and 1 (Figure 4J). However, patient 05 developed prolonged neurotoxicity starting from day 8 and was treated with steroids from day 9 to day 33. During this period, all 10 cytokines stayed at low levels. After steroids were discontinued, the IL-6 and MCP-1 levels of patient 05 rose from day 35 to day 50, and grade 1 neurotoxicity relapsed.
Figure 4K-O summarizes the data for those patients who developed mild CRS (grade 1) or no CRS symptoms. Overall, the cytokine levels were low relative to those of patients from the other groups. The heatmaps of these patients generally exhibited small fluctuations in cytokine levels, although some minor peaks were observed in the first few days after the CAR T-cell infusion. Notably, the red scale of the heatmap of patient 33 represents absolute values of TNF-α and IL-2 levels as small as 23.6 pg/mL and 13.3 pg/mL, respectively (supplemental Figure 9).
Figure 5 presents the longitudinal cytokine data from Figure 4, all combined for the 10 patients with CAR T, sorted into non-CRS and CRS (grade 1 or higher) groups. A statistically significant difference was seen between the 2 groups for IL-6 (P < .0001), IL-8 (P < .05), IL-10 (P < .01), MCP-1 (P < .001), IFN-γ (P < .01), and CRP (P < .001), including data at time points when patients with CRS were treated with steroids or other immunosuppressive agents.
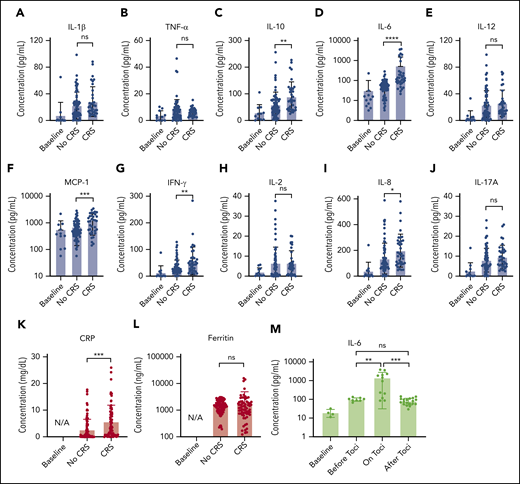
Statistical analysis of biomarker data. Comparison of average cytokine levels across all CAR-T patients on days of CRS (ie, grade ≥1) vs days of no CRS (ie, grade 0) for IL-1β (Α), TNF-α (B), IL-10 (C), IL-6 (D), IL-12 (E), MCP-1 (F), INF-γ (G), IL-2 (H), IL-8 (I), IL-17A (J), CRP (K), and ferritin (L). Each error band indicates the mean with standard deviation. “Baseline” represents data from measurement time points before CAR T-cell infusion. Note that the data includes those obtained from the time points at which patients experiencing CRS were put on steroids or immunosuppressive agents (tocilizumab, infliximab), which could affect cytokine biomarker concentrations. (M) IL-6 variations over 4 different phases of tocilizumab treatment combined for 3 CAR-T patients who received the treatment. “on toci” represents 0 to 3 days after the tocilizumab administration, and “after toci” represents >3 days after the tocilizumab administration. Statistically significant elevations of IL-6 in serum were temporarily observed in the “on toci” phase (P < .01). *P < .05; **P < .01; ***P < .001; ****P < .0001. ns, P ≥ .05.
Statistical analysis of biomarker data. Comparison of average cytokine levels across all CAR-T patients on days of CRS (ie, grade ≥1) vs days of no CRS (ie, grade 0) for IL-1β (Α), TNF-α (B), IL-10 (C), IL-6 (D), IL-12 (E), MCP-1 (F), INF-γ (G), IL-2 (H), IL-8 (I), IL-17A (J), CRP (K), and ferritin (L). Each error band indicates the mean with standard deviation. “Baseline” represents data from measurement time points before CAR T-cell infusion. Note that the data includes those obtained from the time points at which patients experiencing CRS were put on steroids or immunosuppressive agents (tocilizumab, infliximab), which could affect cytokine biomarker concentrations. (M) IL-6 variations over 4 different phases of tocilizumab treatment combined for 3 CAR-T patients who received the treatment. “on toci” represents 0 to 3 days after the tocilizumab administration, and “after toci” represents >3 days after the tocilizumab administration. Statistically significant elevations of IL-6 in serum were temporarily observed in the “on toci” phase (P < .01). *P < .05; **P < .01; ***P < .001; ****P < .0001. ns, P ≥ .05.
We also analyzed IL-6 data for the 3 patients who received tocilizumab treatment (Figure 5M). “on toci” represents 0 to 3 days after tocilizumab administration, and “after toci” represents >3 days after tocilizumab administration. Significant elevations in IL-6 were observed shortly after treatment with tocilizumab (P < .01).
The responsiveness of each biomarker to the time evolution of CRS is depicted in Figure 4F. Figure 6 shows the longitudinal variations of the time rate of biomarker concentration change (Δc/Δt), the time rate of CRS score change (ΔCRS/Δt), and the CRS score for patient 06 (grade 4 CRS). For the cytokines exhibiting significant elevations upon CRS in Figure 5 (IL-6, MCP-1, IFN-γ, IL-10, and IL-8), their time plots of Δc/Δt follow a similar trend to the time plot of ΔCRS/Δt Furthermore, the peaks in the Δc/Δt plots for MCP-1, IFN-γ, IL-8, and IL-10 synchronously appeared with the peaks in the ΔCRS/Δt plot. Notably, we observed that the sharp increase in IFN-γ represented by the second large peak in the Δc/Δt plot for IFN-γ accompanied a life-threatening complication for this patient. Conversely, we noticed that the Δc/Δt plots for the current clinical inflammatory surrogate markers, CRP and ferritin, yielded no peak or a peak with a time (∼1 day) delay in response to the appearance of a peak of ΔCRS/Δt. A peak in the ΔCRS/Δt plot always preceded a significant deterioration of the CRS condition, represented by an increase in the CRS score.
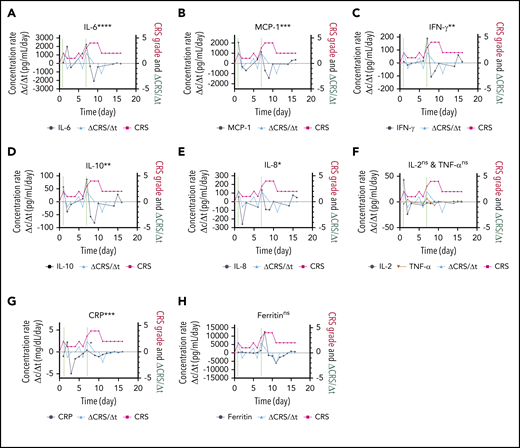
Biomarker responsiveness to the CRS score variation of patient 06 (grade 4 CRS). Longitudinal plots of the time rate of change of biomarker concentration (Δc/Δt) in black, the CRS score in light red, and the time rate of change of the CRS score (ΔCRS/Δt in light blue for IL-6 (A), MCP-1 (B), INF-γ (C), IL-10 (D), IL-8 (E), IL-2 and TNF-α (F), CRP (G), and ferritin (H). Typically, the time interval was set as Δt = 1 day. Δc was calculated by using the concentration at a given time point minus the concentration at 1 previous time point. The vertical dotted lines represent the time points at which an “onset” or an abrupt worsening of the CRS symptom was observed for the patient. ****P < .0001; ***P < .001; **P < .01; *P < .05; ns, P ≥ .05.
Biomarker responsiveness to the CRS score variation of patient 06 (grade 4 CRS). Longitudinal plots of the time rate of change of biomarker concentration (Δc/Δt) in black, the CRS score in light red, and the time rate of change of the CRS score (ΔCRS/Δt in light blue for IL-6 (A), MCP-1 (B), INF-γ (C), IL-10 (D), IL-8 (E), IL-2 and TNF-α (F), CRP (G), and ferritin (H). Typically, the time interval was set as Δt = 1 day. Δc was calculated by using the concentration at a given time point minus the concentration at 1 previous time point. The vertical dotted lines represent the time points at which an “onset” or an abrupt worsening of the CRS symptom was observed for the patient. ****P < .0001; ***P < .001; **P < .01; *P < .05; ns, P ≥ .05.
Discussion
Although precision medicine approaches for cancer and genetic diseases have been remarkably successful,1,2,48 the area of clinical care of acute, severe systemic immune disorders has seen highly limited benefits, owing in part to the lack of sufficiently accurate, sensitive, and clinically practical biomarker measurement technology.3,4 Real-time monitoring of acute immune responses in patients over time poses significant technical challenges. In addition to a need for high speed and sensitivity, it requires the ability to capture temporal cytokine profiles varying over a wide concentration range between 10 fM and 1 nM for various cytokines. Meeting such stringent requirements, PEdELISA shows promise to enable early detection and intervention of the inflammatory response accompanying CRS. Unlike conventional ultrafast immunoassay approaches, PEdELISA achieves high speed by applying single-molecule counting for an antibody-antigen-antibody immune-complex formation quenched at an early pre-equilibrium state. As a result, the total assay incubation time has been shortened from a few hours to a few minutes while achieving high sensitivity and linearity at a clinically relevant dynamic range. Our multiphysics finite element analysis modeling evaluation validated that the 2-step transient assay format of PEdELISA can maintain a linear relationship between the analyte concentration and the assay readout regardless of the snapshot acquisition timing. In addition, the modeling successfully predicted the minimum required incubation time for the desired detection limit, which guided the digital assay design. For IL-6, which is the primary mediator of CRS, we experimentally showed that the entire assay incubation time can be as short as 15 seconds with a LOD of 25.9 pg/mL while maintaining a 4-order dynamic range up to 10 ng/mL.
Using the PEdELISA platform, we successfully described the application of rapid, high-sensitivity, near-real-time multiplex monitoring of CRS-relevant circulating cytokines for 10 patients with hematologic cancer exhibiting severe and moderate CRS symptoms after CAR-T cell therapy. With conventional ELISA or Luminex methods, time-course biomarker measurement is only achieved by retrospective tests using banked samples. In contrast, we showed that PEdELISA can continuously provide real-time data for blood samples freshly collected from human patients, with a high time resolution limited principally by blood sampling frequency (<24 hours over most of the course of our studies).
The longitudinal PEdELISA test for human patients (Figure 4) captured the cytokine response to the CAR T-cell infusion and the CRS peaks, especially the 2 peaks for patient 06 with severe CRS who had a high tumor burden. The significantly elevated IL-6, IFN-γ, IL-8, IL-10, and MCP-1 levels appearing at the second peak were associated with the severe, grade 4 CRS experienced by the patient. We also evaluated the cytokine response to the anticykotine treatment (tocilizumab and infliximab) and corticosteroids (dexamethasone). Specifically, upon the first administration of tocilizumab (anti–IL-6R), a temporary increase and then an eventual decline in serum IL-6 level for patients 02, 06, and 08 were observed. Interestingly, no elevation was observed for either TNF-α or IL-2 in patient 06 during the second CRS peak. The reason remains unknown, although it could be partially attributed to the heavy dose of the corticosteroids administered during this period. The mismatch between the detected low level of TNF-α and the clinical timing of infliximab treatment (anti–TNF-α) creates the possibility of biomarker-guided therapy to administer the correct targeted therapy at the optimal time.
By evaluating the temporal responsiveness of each biomarker to the dynamic CRS score variation for patient 06 (Figure 6), we observed a significant increase in IFN-γ and MCP-1 that synchronously followed an increase in the CRS score over time. The time rate of change signifies the trajectory of the parameter of interest. Our observation here suggests that the temporal behavior of IFN-γ and MCP-1, in addition to their absolute concentration values, could potentially serve as a promising predictive signature of the host’s CRS condition. Although we will need to extend the analysis to a larger number of subjects to achieve statistical confidence, our observation matches previous results in the literature indicating that IFN-γ and MCP-1 are good predictors of severe CRS.39 However, the current clinical standard surrogate markers, such as CRP and ferritin (Figure 6G-H), seem to lack the ability to respond in a timely manner to a dynamic CRS score change. This scenario further confirms the need for rapid, direct cytokine measurement, as shown by using PEdELISA, to facilitate timely interventions of CRS before the illness worsens.
Moving forward, further development of several aspects of our pre-equilibrium digital assay technology will be important for enabling direct implementation in a near-bedside clinical setting. First, all the processes of our test, from the initial blood draw to the end result delivery, currently take up to 2 hours, including sample preparation and transportation. Our future work will integrate a finger-pricked inlet, an on-chip plasma separation unit with a more automated and precisely volume/time-controlled sample/reagent handling system into the PEdELISA platform for near-bedside operation. This would allow the whole test to be completed with a blood draw-to-answer time of <30 minutes and truly enable “real-time” biomarker detection. Second, the panel of biomarkers must be refined to those with responsiveness to early CRS and clinical deterioration to realize biomarker-guided therapy for systemic illnesses caused by CAR-T infusion. Another next step is to apply data science methods to data collected from a much larger patient population to establish a solid understanding of the temporal behavior of target biomarkers, together with other genetic markers (eg, transcriptomes) over the course of illness.
All relevant data are available within the article file or supplemental Information, or available from the authors on reasonable request.
The online version of this article contains a data supplement.
The publication costs of this article were defrayed in part by page charge payment. Therefore, and solely to indicate this fact, this article is hereby marked “advertisement” in accordance with 18 USC section 1734.
Acknowledgments
The authors acknowledge the generous clinical support from the Hematology/Oncology Division and from Chandan Bhambhani and Christopher Flora in the Department of Internal Medicine and from David Frame in the Department of Clinical Pharmacy, University of Michigan. The authors are grateful to the CAR T-therapy patients who took part in this study. Device fabrication was performed at the University of Michigan Robert H. Lurie Nanofabrication Facility.
This study was supported by the National Science Foundation (ECCS 1708706 and CBET 1931905, K.K.), the University of Michigan Precision Health Scholars Grant (Y.S.), the A. Alfred Taubman Medical Research Institute (M.T. and S.W.C.), the Joint Institute of University of Michigan and Peking University Health Science Center (grant U068874, Y.L.), and the Cancer Research Institute (AWD012546, M.T., S.W.C., and K.K.).
Authorship
Contribution: K.K., S.W.C., M.T., Y.L., H.B.A., B.H.S., and M.G. conceived of the project; Y.S., Y.Y., and S.-H.S. designed and built the automated PEdELISA platform and the compact reader; Y.S., Y.T., Q.Y., A.G.K., and T.C. designed the experiments and performed the immunoassay; Y.S. and M.T.C. designed and fabricated the sensor device; Y.S. performed the multi-physics simulations and analyzed the data; M.G. and M.R. facilitated access to CAR-T patient samples and data and provided guidance on the clinical context; R.L. and A.G. coordinated the patient studies; E.S. coordinated blood specimen processing, banking, and tracking; J.B. and M.O. processed the day-by-day blood samples; K.K., S.W.C., M.T., Y.L., B.H.S., and M.G. directed the research; and all authors contributed to the writing and revision of the manuscript.
Conflict-of-interest disclosure: A US provisional patent was filed for the assay technology reported in the paper under Application No. 63/016 753 on 28 April 2020. The authors declare no competing financial interests.
Correspondence: Katsuo Kurabayashi, 2350 Hayward St, Ann Arbor, MI 48109-2125; e-mail: katsuo@umich.edu.

This feature is available to Subscribers Only
Sign In or Create an Account Close Modal