

Key Points
Xenotropic and polytropic retrovirus receptor 1 (XPR1) is a major phosphate exporter in platelets.
Inhibiting XPR1 in platelets increases procoagulant polyphosphate levels and augments arterial and venous thrombosis in mice.

Abstract
Polyphosphate is a procoagulant inorganic polymer of linear-linked orthophosphate residues. Multiple investigations have established the importance of platelet polyphosphate in blood coagulation; however, the mechanistic details of polyphosphate homeostasis in mammalian species remain largely undefined. In this study, xenotropic and polytropic retrovirus receptor 1 (XPR1) regulated polyphosphate in platelets and was implicated in thrombosis in vivo. We used bioinformatic analyses of omics data to identify XPR1 as a major phosphate transporter in platelets. XPR1 messenger RNA and protein expression inversely correlated with intracellular polyphosphate content and release. Pharmacological interference with XPR1 activity increased polyphosphate stores, led to enhanced platelet-driven coagulation, and amplified thrombus formation under flow via the polyphosphate/factor XII pathway. Conditional gene deletion of Xpr1 in platelets resulted in polyphosphate accumulation, accelerated arterial thrombosis, and augmented activated platelet-driven pulmonary embolism without increasing bleeding in mice. These data identify platelet XPR1 as an integral regulator of platelet polyphosphate metabolism and reveal a fundamental role for phosphate homeostasis in thrombosis.
Introduction
Inorganic polyphosphate (polyP) is a linear polymer of tens to hundreds of phosphate residues linked via high-energy phosphoanhydride bonds. This evolutionary ancient polyanion is ubiquitous in nature, in bacterial, fungal, plant, animal, and human cells.1 Despite its structural simplicity, polyP regulates several distinct, intracellular activities. The polymer contributes to energy homeostasis and functions as a storage pool for inorganic phosphate (Pi).2-4
Regulation of polyP has remained poorly understood in metazoans but has been characterized in detail, in prokaryotes and yeast. Saccharomyces cerevisiae express 4 distinct Pi transporters (Pho84, Pho87, Pho90, and Pho89)5 that mediate uptake of extracellular Pi into the cytosol; deficiency in individual Pi transporters reduces polyP formation.6 Genetic analyses in yeast have confirmed a correlation between intracellular Pi levels and polyP content: strains with low imported Pi also exhibit reduced intracellular polyP,7 and, vice versa, polyP levels are reduced when budding S cerevisiae are switched from Pi-rich to Pi-starved medium.8,9 Some bacteria such as Acinetobacter johnsonii and the parasite Trypanosoma cruzi (the etiologic agent of Chagas disease) accumulate up to 30% of their dry cell weight as intracellular granules referred to as acidocalcisomes, which are calcium- and polyP-rich organelles.10, In some mammalian cells, polyP is stored in organelles that function similarly to acidocalcisomes, including mast cell and basophil granules,12 astrocyte vesicles,13 and platelet-dense granules14 that allow for rapid release of preformed polyP into the interstitial and vascular spaces. However, only small amounts of soluble short-chain polymers are found in the supernatant of activated platelets, whereas most is retained on the plasma membrane as insoluble, calcium-rich nanoparticles.15,16 Platelet polyP has been recognized as a procoagulant mediator with a multitude of functions in the coagulation system that include activation of factor XII (FXII), which in turn triggers the “intrinsic” pathway of coagulation.15,17-21 The sum of polyP-mediated procoagulant activities leads to enhanced clotting in human plasma and increased thrombosis in animal models.22,23
Xenotropic and polytropic retrovirus receptor 1 (XPR1) is an 8-pass transmembrane molecule of 696 amino acids that was initially recognized as a cell surface receptor for xenotropic and polytropic murine leukemia retroviruses (X- and P-MLV).24 Recent work in mammalian cells revealed that XPR1 is involved in Pi export and leads to the depletion of intracellular Pi.25,26 In yeast and excavate eukaryotes, XPR1 expression has been linked to polyP metabolism. T cruzi expresses an XPR1 homologous protein, TcPho91, and modulation of TcPho91 activity influences intracellular polyP levels.27 Deficiency in the XPR1 homolog Pho91 in yeast consistently increases intracellular Pi and polyP levels.6
Despite its fundamental functions, polyP regulation in mammalian cells has remained largely undefined. In this study, we tested the hypothesis that polyP levels are regulated in response to Pi homeostasis. Using omics data resources, we identified XPR1 as a major Pi transporter in platelets. Pharmacologic and genetic interference with XPR1 led to intracellular polyP accumulation. Similarly, targeting XPR1 in platelets increased polyP content, augmented activated platelet-driven coagulation, and led to thrombus formation under flow in an FXII-dependent manner. Conditional ablation of Xpr1 in platelets accelerated vascular occlusion in murine models of venous and arterial thrombosis without affecting hemostasis. Taken together, the experimental results of the present study provide evidence that XPR1 is a key regulator of platelet polyP and reveal an unidentified role of Pi homeostasis in thromboembolic disease.
Methods
Detailed description of antibodies, reagents, and additional methods can be found in the supplemental Methods (available on the Blood Web site).
Platelet Xpr1-deficient mouse strains
Xpr1fl/fl mice carrying loxP sites on either side of Xpr1 exon 2 have been described.28 Xpr1fl/fl mice were bred with Pf4-Cre transgenic animals to delete Xpr1, specifically in the megakaryocyte/platelet lineage. All mice were treated according to national guidelines for animal care at the animal facilities of University Medical Center Hamburg-Eppendorf, and the protocol was approved by local authorities (no. 76/16). For animal experiments, 8- to 14-week-old mice of either sex (1:1 ratio) were used. All animal procedures were conducted in accordance with the 3R (replacement, reduction, refinement) regulations.
PolyP extraction and quantification
Anion-exchange columns were used to isolate PolyP from HEK293 or MEG-01 cells.29 In brief, cells were incubated with sodium chloride (4 M) for 5 minutes, diluted with 50 mM Tris (pH 8.1), incubated with DNase I (200 U/mL) and proteinase K (750 μg/mL; Sigma-Aldrich) for 1 hour at 37°C, and centrifuged at 14 000g for 8 minutes to remove debris. Lysates were diluted in buffer QG (Qiagen) and applied to QIAquick Spin Columns (Qiagen). Columns were washed twice with washing buffer, and polyP was eluted in 50 mM Tris buffer. Isolated material was subjected to a 1-hour incubation with 10 μg/mL recombinant Escherichia coli exopolyphosphatase (PPX) at 37°C, which ablated purified polyP procoagulant activity.30 Released orthophosphate was estimated by using a Phosphate Assay Kit (Abcam, Cambridge, United Kingdom), according to the manufacturer’s instructions. Pi concentrations attributed to polyP were quantified by calculating the difference between PPX-treated and untreated samples.
Soluble and membrane-associated insoluble polyP measurements
Washed human platelets were incubated with XVDL and/or PVDL for up to 24 hours before polyP measurements. Flow cytometry analyses probing for surface expression of P-selectin (CD62P, 1:100 dilution; clone Psel.KO.2.7; Bio-Rad) indicated that platelets were not activated during the incubation period. Quantification of soluble and membrane-associated insoluble polyP was performed as previously described.16 In brief, washed human or Xpr1fl/fl, Xpr1fl/+ Pf4-Cre, and Xpr1fl/fl Pf4-Cre mouse platelets were incubated for 20 minutes with Horm collagen (10 μg/mL) in HEPES-Tyrode’s buffer. Supernatants containing soluble polyP were incubated for 2 hours with buffer or PPX (50 μg/mL) at 37°C, and Pi concentrations were determined with a malachite green–based phosphate assay kit (Abcam).30 To measure insoluble, membrane-associated polyP, collagen-stimulated platelets were incubated with 250 mM EDTA for 15 minutes at 37°C, to dissociate membrane-retained Ca2+-polyP nanoparticles,16 followed by PPX digestion.
Results
XPR1 is a major phosphate transporter in platelets
Ten distinct phosphate transporters including XPR1, SLC17A1-4, SLC20A1-2 (PiT-1 and PiT-2), and SLC34A1-3 have been described in eukaryotic systems.25,31 To predict Pi transporter expression in platelets, we sourced RNA sequencing (RNAseq) data from unfractionated human bone marrow, generated as part of the Human Protein Atlas project (https://www.proteinatlas.org/). XPR1, SLC20A1, and SLC20A2 were the only Pi transporters with detectable messenger RNA (mRNA) expression in the bone marrow (Figure 1A). To confirm transporter expression in circulating cells in an independent data set, RNAseq data from unfractionated human whole-blood samples (n = 407) was downloaded from GTEx Analysis V7 (https://gtexportal.org/home/). In all samples, XPR1, SLC20A1, and SLC20A2 mRNA was detected (mean fragments per kilobase of exon model per million reads mapped [FPKM], 2.6, 25.7, and 1.74, respectively). We next examined which of those transporters are expressed in platelets by using the Platelet Web database (http://plateletweb.bioapps.biozentrum.uni-wuerzburg.de/plateletweb.php).32 XPR1 expression was detected in human platelets, on both the mRNA33 and protein levels,34 but SLC20A1 and SLC20A2 were not. To validate our findings, we probed for XPR1 protein in membrane fractions of human and murine platelets. Antibodies against the N and C termini of XPR1 detected a single band in human (Figure 1B) and mouse (Figure 1C) platelet membrane fractions, migrating at an apparent molecular weight of ∼65 kDa (supplemental Figure 1A-D). Recombinant human XPR1 expressed in HEK293 cells migrated with a similar apparent molecular weight and served as the control. Consistent with cell surface localization of XPR1 in adherent cells,26 immunofluorescence microscopy visualized XPR1 at the plasma membrane in nonpermeabilized human platelets (Figure 1D). To assess the subcellular localization of platelet XPR1 on an ultrastructural level, the platelets were analyzed by transmission electron microscopy. Immunogold labeling showed that XPR1 was enriched at the plasma membrane (Figure 1E). These data indicate that XPR1 is a major phosphate transporter in platelets.

XPR1 is a major phosphate transporter on platelets. (A) Data from the Human Protein Atlas project and GTEx Analysis V7 (https://gtexportal.org) were used to determine the expression of transcripts encoding for the 10 reported phosphate transporters in bone marrow and whole blood. Platelet Web (http://plateletweb.bioapps.biozentrum.uni-wuerzburg.de/plateletweb.php) and PubMed were used to establish whether protein expression on platelets had been described. TPM, transcripts per million. Cell membranes from the indicated number of human (B) or mouse (C) platelets were analyzed by western blot, using antibodies directed against the XPR1 N- or C-terminal portions. Lysed HEK293 cells transiently transfected with a pCHIX-XPR1–coding plasmid were loaded as a positive control (XPR1). (D) Bright-field image (left), confocal laser scanning image (middle; green) of XPR1 staining in nonpermeabilized resting human platelets, and merged image (right). Scale bar, 1 µm. (E) Transmission electron microscopy of immunogold-stained (10-nm particles) XPR1 on human platelets. Open canalicular system (OCS), dense tubular system (DTS), and α-granules are shown. Arrows indicate XPR1; scale bar, 100 nm.
XPR1 is a major phosphate transporter on platelets. (A) Data from the Human Protein Atlas project and GTEx Analysis V7 (https://gtexportal.org) were used to determine the expression of transcripts encoding for the 10 reported phosphate transporters in bone marrow and whole blood. Platelet Web (http://plateletweb.bioapps.biozentrum.uni-wuerzburg.de/plateletweb.php) and PubMed were used to establish whether protein expression on platelets had been described. TPM, transcripts per million. Cell membranes from the indicated number of human (B) or mouse (C) platelets were analyzed by western blot, using antibodies directed against the XPR1 N- or C-terminal portions. Lysed HEK293 cells transiently transfected with a pCHIX-XPR1–coding plasmid were loaded as a positive control (XPR1). (D) Bright-field image (left), confocal laser scanning image (middle; green) of XPR1 staining in nonpermeabilized resting human platelets, and merged image (right). Scale bar, 1 µm. (E) Transmission electron microscopy of immunogold-stained (10-nm particles) XPR1 on human platelets. Open canalicular system (OCS), dense tubular system (DTS), and α-granules are shown. Arrows indicate XPR1; scale bar, 100 nm.
XPR1 expression inversely correlates with polyP levels
In inframammalian systems, The XPR1 homologous proteins TcPho91 and Pho91 regulate polyP levels.6,27 We hypothesized that XPR1 similarly controls polyP in platelets and examined whether there is a correlation between XPR1 expression and intracellular polyP levels in human cells. Transient overexpression of XPR1 in HEK293 cells (Figure 2A) and MEG-01 megakaryocytes (Figure 2B) increased XPR1 signal intensity in western blots by 8- and 45-fold, respectively, compared with the mock control. The increased XPR1 expression dose-dependently reduced total polyP content to 65% ± 3% and 58% ± 9%, respectively, compared with levels in mock vector–transfected HEK293 (Figure 2C) and MEG-01 (Figure 2D) cells (set to 100% each). In contrast, interference with XPR1 expression using siRNA-mediated knockdown decreased XPR1 mRNA, leading to increased polyP levels in HEK293 (up to 138% ± 3%; Figure 2E) and MEG-01 cells (up to 129% ± 5%; Figure 2F). Small interfering RNA (siRNA) treatment did not affect cell morphology or levels of the housekeeping vasodilator-stimulated phosphoprotein (not shown). The chain length of polyP molecules ranged from 50 to 400 and from 40 to 200 Pi moieties in control-treated HEK293 and MEG-01 cells, respectively (Figure 2G-H). XPR1 overexpression in those cell types only slightly reduced polyP size (50-150 and 40-140 mers; Figure 2G). Accordingly, XPR1 knockdown had only a minor impact on average polyP size or degree of dispersion in HEK293 and MEG-01 cells on day 3 (Figure 2H). We used PPX, an enzyme that specifically degrades polyP,30,35 and confirmed that the cell-purified material was indeed polyP. Together, the data showed that polyP content is inversely proportional to XPR1 expression levels.
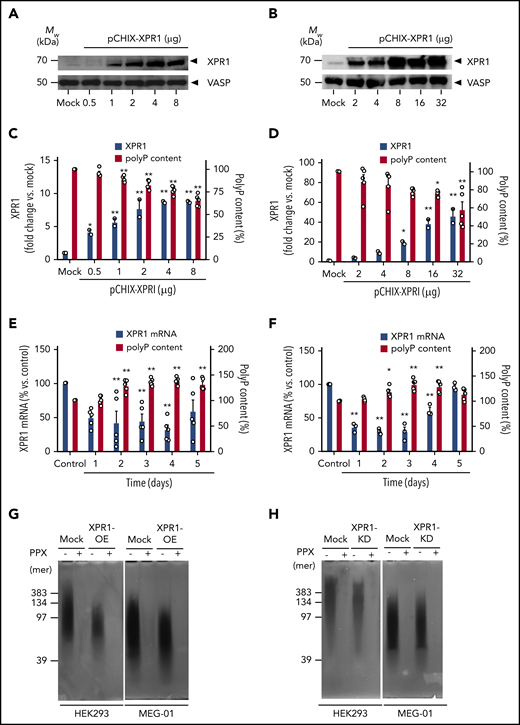
XPR1 expression levels inversely correlate with polyP content in cells. HEK293 cells and MEG-01 megakaryocytes were transiently transfected with the indicated amounts of pCHIX-XPR1 or empty (Mock) vector. HEK293 (A) and MEG-01 (B) cells were analyzed by western blot with anti-XPR1 antibodies (top) after 24 and 48 hours, respectively. The cytoskeleton protein vasodilator-stimulated phosphoprotein (VASP) served as the loading control (bottom). XPR1 and polyP levels in XPR1-overexpressing HEK293 (C) and MEG-01 (D) cells. HEK293 (E) and MEG-01 (F) cells were transfected with 250 nM XPR1 siRNA and XPR1 mRNA expression and polyP were analyzed every 24 hours for 5 days. The expression of XPR1 mRNA was normalized to 18S rRNA signal and plotted, as a percentage of XPR1 expression at day 0 after control siRNA treatment (100%). Data are expressed as the mean ± standard error of the mean, by 1-way analysis of variance and Tukey’s multiple comparison test. *P < .05; **P < .01. PolyP from XPR1-overexpressing (OE) (G) or siRNA-treated XPR1 knockdown (KD) (H) cells was extracted, and equal amounts (10 ng per lane) of polyP were loaded, separated on polyacrylamide/urea gel, and visualized by negative DAPI staining. For the control, purified polyP was loaded before (−) or after (+) incubation with PPX (10 μg/ml for 1 hour).
XPR1 expression levels inversely correlate with polyP content in cells. HEK293 cells and MEG-01 megakaryocytes were transiently transfected with the indicated amounts of pCHIX-XPR1 or empty (Mock) vector. HEK293 (A) and MEG-01 (B) cells were analyzed by western blot with anti-XPR1 antibodies (top) after 24 and 48 hours, respectively. The cytoskeleton protein vasodilator-stimulated phosphoprotein (VASP) served as the loading control (bottom). XPR1 and polyP levels in XPR1-overexpressing HEK293 (C) and MEG-01 (D) cells. HEK293 (E) and MEG-01 (F) cells were transfected with 250 nM XPR1 siRNA and XPR1 mRNA expression and polyP were analyzed every 24 hours for 5 days. The expression of XPR1 mRNA was normalized to 18S rRNA signal and plotted, as a percentage of XPR1 expression at day 0 after control siRNA treatment (100%). Data are expressed as the mean ± standard error of the mean, by 1-way analysis of variance and Tukey’s multiple comparison test. *P < .05; **P < .01. PolyP from XPR1-overexpressing (OE) (G) or siRNA-treated XPR1 knockdown (KD) (H) cells was extracted, and equal amounts (10 ng per lane) of polyP were loaded, separated on polyacrylamide/urea gel, and visualized by negative DAPI staining. For the control, purified polyP was loaded before (−) or after (+) incubation with PPX (10 μg/ml for 1 hour).
Inhibition of platelet XPR1 increases intracellular polyP content
XPR1 is the entry receptor for X-MLV36,37 and an XPR1 ligand derived from the X-MLV envelope receptor-binding domain XVDL inhibits the export of XPR1-mediated Pi, leading to increased Pi in adherent cells.26 To pharmacologically target XPR1 activity, we cloned and expressed in E coli XVDL and the corresponding P-MLV envelope ligand (PVDL, negative control; schematically shown in supplemental Figure 2A-B). Although X- and P-MLV differ in their activities, they share high sequence homology.26,38 Coomassie brilliant blue–stained polyacrylamide gels and immunoblot analyses confirmed the purity of recombinant XVDL and PVDL ligands (supplemental Figure 2C-D).
Washed human platelets were incubated with increasing concentrations (2-200 μg/mL) of XVDL or PVDL for up to 24 hours. Virus-derived ligands did not activate platelets (data not shown). PolyP was subsequently isolated from treated cells at various time points by anion-exchange chromatography and was quantified as monophosphate units after PPX digestion by a malachite green–based colorimetric assay.30 XVDL treatment dose dependently and significantly increased platelet polyP content (up to 134% ± 7% polymer level) compared with buffer-incubated controls (set at 100%; Figure 3A). PolyP levels increased after 4 hours of incubation with XVDL and remained elevated for 24 hours. PVDL was inactive in altering platelet polyP (Figure 3B). X- and P-MLV compete with each other for binding to XPR1.39 We tested PVDL for its interference with an XVDL-mediated increase in polyP. PVDL competed with an XVDL-induced increase in platelet polyP in a dose-dependent manner. PVDL levels as high as 600 μg/mL completely abolished the effects of XVDL (200 μg/mL) and restored polyP content to baseline levels (Figure 3C). Platelets contain soluble short-chain polyP that, upon cell activation, is released into the supernatant, as well as long(er) chain polyP that is insoluble and retained on the plasma membrane of procoagulant platelets as calcium-rich nanoparticles.16,21 We examined the impact on each of these distinct polyP pools through XPR1 inhibition. Platelets were preincubated for 4 hours (sufficient for inducing maximum polyP increase) in solution with XVDL, PVDL, or buffer before activation with Horm collagen. Collagen treatment activates platelets and potently leads to polyP release.16,30,40 Pretreating platelets with XVDL, dose dependently increased soluble polyP in the cell supernatant by threefold over polyP levels isolated in supernatant from buffer-treated platelets (1.8 ± 0.2 vs 0.6 ± 0.1 nmol Pi per 108 platelets; Figure 3D); PVDL pretreatment did not influence soluble polyP levels (Figure 3E). Divalent cations mediate the formation and membrane association of insoluble polyP nanoparticles. EDTA (a chelator of divalent ions) disrupts polyP nanoparticles and allows for specific analysis of membrane-associated polyP.16 Preincubation of platelets with XVDL dose dependently increased membrane-associated insoluble polyP by more than twofold (6.3 ± 0.4 vs 2.6 ± 0.1 nmol per 108 platelets) compared with buffer-pretreated platelets (Figure 3F). In contrast, even at maximum PVDL concentrations, no effect was noted in the amount of cell surface–exposed polyP (Figure 3G).
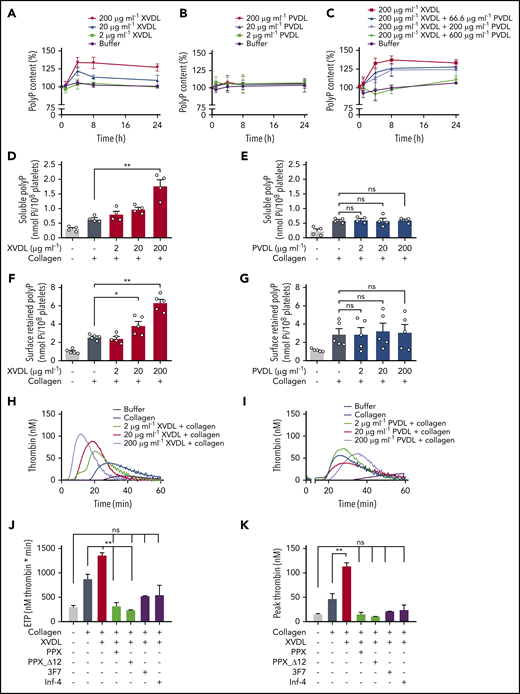
Interference with XPR1 increases platelet polyP and promotes activated platelet-driven coagulation via the polyP/FXII pathway. (A-B) Washed human platelets were preincubated with XVDL (A), PVDL (B), or XVDL (200 μg/ml) and increasing PVDL concentrations (0-600 μg/ml) (C) for 1, 4, 8, or 24 hours. PolyP was measured as monophosphate with a malachite green assay. PolyP content before treatment was set to 100%. Analysis of released soluble polyP in the supernatant (D-E) and insoluble platelet membrane–associated polyP in collagen-stimulated (10 μg/ml) platelets (F-G) after a 4-hour incubation with XVDL and PVDL, respectively. PolyP was measured as in panel C. (H-I) Real-time thrombin formation in collagen-stimulated human PRP that was preincubated for 4 hours with XVDL or PVDL (2-200 μg/ml). Results are representative of 5 experiments. Endogenous thrombin potential (ETP) (J) and maximum (peak) thrombin (K) triggered in collagen-stimulated human PRP preincubated for 4 hours with XVDL (200 μg/ml) in the presence of PPX (500 μg/ml), PPX_Δ12 (500 μg/ml), 3F7 (650 nM), or infestin-4 (500 μg/ml). Data are expressed as the mean ± standard error of the mean; n = 3; *P < .05; **P < .01; n.s. nonsignificant.
Interference with XPR1 increases platelet polyP and promotes activated platelet-driven coagulation via the polyP/FXII pathway. (A-B) Washed human platelets were preincubated with XVDL (A), PVDL (B), or XVDL (200 μg/ml) and increasing PVDL concentrations (0-600 μg/ml) (C) for 1, 4, 8, or 24 hours. PolyP was measured as monophosphate with a malachite green assay. PolyP content before treatment was set to 100%. Analysis of released soluble polyP in the supernatant (D-E) and insoluble platelet membrane–associated polyP in collagen-stimulated (10 μg/ml) platelets (F-G) after a 4-hour incubation with XVDL and PVDL, respectively. PolyP was measured as in panel C. (H-I) Real-time thrombin formation in collagen-stimulated human PRP that was preincubated for 4 hours with XVDL or PVDL (2-200 μg/ml). Results are representative of 5 experiments. Endogenous thrombin potential (ETP) (J) and maximum (peak) thrombin (K) triggered in collagen-stimulated human PRP preincubated for 4 hours with XVDL (200 μg/ml) in the presence of PPX (500 μg/ml), PPX_Δ12 (500 μg/ml), 3F7 (650 nM), or infestin-4 (500 μg/ml). Data are expressed as the mean ± standard error of the mean; n = 3; *P < .05; **P < .01; n.s. nonsignificant.
Inhibition of XPR1 amplifies platelet-triggered coagulation via the polyP/FXII pathway
We next used real-time thrombin generation assays to examine whether XPR1 increases platelet reactivity in human platelet-rich plasma (PRP; Figure 3H-K). Consistent with previous data,41,42 collagen-stimulated platelets initiated thrombin formation (Figure 3H-I). Preincubation with XVDL (Figure 3H), but not PVDL (Figure 3I), dose dependently increased collagen-induced platelet procoagulant activity, as seen by the increase in total and maximum (peak) thrombin generation by 56% and 143%, respectively, compared with buffer-preincubated activated platelets (875 ± 95 to 1361 ± 49 nM per minute and 47 ± 11 to 114 ± 6 nM at 200 μg/mL XVDL; Figure 3J-K). Targeting XPR1 also consistently shortened the lag time (11.3 ± 1.0 vs 9.1 ± 0.8 minutes) and time to peak (20.3 ± 1.3 vs 14.7 ± 1.1 minutes) thrombin formation, compared with the buffer control (supplemental Figure 3). To confirm that an increase in platelet polyP rather than other XPR1-mediated events underlies the increase in platelet procoagulant activity, we targeted released polyP in XVDL-pretreated platelets by using 2 strategies: (1) recombinant E coli PPX, which specifically degrades polyP, but not other naturally occurring polymers,30 and (2) an enzymatically inactive PPX mutant lacking domains 1 and 2 (PPX_Δ12) that interferes with polyP procoagulant activities without degrading it.30 Both PPX and PPX_Δ12 reduced the thrombin generation induced by synthetic and platelet-derived polyP, but did not interfere with tissue factor- or nucleic acid–driven thrombin formation.30 Addition of PPX and PPX_Δ12 (500 μg/mL each) to XPR1-inhibited platelets abolished platelet hyperreactivity, and thrombin formation triggered by collagen activation was similar to that of unstimulated controls (total, 319 ± 71 and 239 ± 6 vs 299 ± 31 nM per minute. Peak thrombin, 15 ± 4 and 11 ± 1 nM vs 15 ± 1 nM). PolyP initiates coagulation in plasma via contact activation of FXII.15,43 3F7 (650 nM),44 a neutralizing antibody to activated FXII (FXIIa) and rHA-infestin-4 (500 μg/mL),45 a recombinant FXIIa inhibitor, both blocked the increased procoagulant activity of XVDL/collagen–stimulated platelets. Neutralizing FXIIa and targeting polyP similarly interfered with excess thrombin generation in XVDL/collagen-treated cells (total, 527 ± 5 and 547 ± 197 nM per minute; peak thrombin, 22 ± 1 and 25 ± 9 nM; Figure 3J-K). Combining 3F7 and PPX did not result in further reduction of procoagulant platelet activity (total, 522 ± 129 nM per minute; peak thrombin, 23 ± 7 nM). Together, the data show that XVDL-treated, activated platelets trigger excess coagulation by increased polyP/FXII activity in plasma.
Inhibition of XPR1 increases platelet polyP and thrombus formation under flow
At sites of vascular injury, collagen is exposed from the subendothelial matrix, resulting in platelet activation and subsequent thrombus formation in an FXII-dependent manner.46 Therefore, we next investigated whether interference with XPR1 augments thrombus formation on collagen-coated surfaces under flow (Figure 4). Citrate-anticoagulated human whole blood preincubated with increasing doses of XVDL (2-200 μg/mL), was recalcified before being perfused at arterial (Figure 4A) and venous (Figure 4B) shear rates of 1000 and 100 per second, respectively. Consistent with earlier data,44,46 in the absence of XVDL platelets adhering to collagen fibers, aggregation and thrombus formation were observed within 4 minutes of the time of perfusion (16.5% ± 1.9% and 9.3% ± 0.8% surface coverage by thrombi at arterial and venous shear, respectively). Preincubation with XVDL dose dependently increased thrombus formation by >50%, compared with the untreated control (26.4% ± 2.5% and 17.0% ± 2.5%, respectively). In contrast, targeting polyP with PPX almost completely abolished thrombosis, at both arterial (<5%) and venous (<2%) shear rates. Immunofluorescence microscopy of formed thrombi confirmed the polyP-mediated procoagulant activity of XVDL. Fibrin deposition assessed by the fibrin-specific antibody 59D847 and platelet accumulation increased in thrombi after XPR1 inhibition (Figure 4C-D). To confirm that XVDL treatment led to increased polyP in platelets, we used fluorescently labeled PPX_Δ12 as a polyP-specific probe.48 FITC-PPX_Δ12 signal intensity was >70% higher in thrombi produced by XPR1-inhibited platelets vs buffer control (10.8 ± 0.2 vs 18.5 ± 1.0 reflectance units at 1000 per second and 7.0 ± 0.3 vs 12.2 ± 0.7 reflectance units at 100 per second; Figure 4E-F).

Targeting XPR1 promotes thrombus formation in blood under flow. Citrated human whole-blood preincubated with XVDL (2-200 μg/ml; 4 hours) or PPX (2 mg/ml; 30 minutes) was readjusted to physiological Ca2+ and Mg2+ concentrations and perfused for 4 minutes over a collagen-coated surface at an arterial (1000 per second) (A) or venous (100 per second) (B) shear rate. Representative phase-contrast images (top) of thrombi formed during perfusion after incubation with the indicated XVDL concentrations. Scale bars, 10 µm. Bar graphs indicate the percentage of surface area covered by thrombi. Mean ± SD; n = 3. Comparisons were performed using 1-way analysis of variance and Tukey’s multiple comparison test; *P < .05, **P < .01. (C-D) Representative bright-field and immunofluorescence images of thrombi formed at t = 4 minutes under arterial (C) or venous (D) flow. Staining for fibrin (59D8; green) and platelets (GPIb; red) and merged images are shown. Scale bars, 10 μm. (E-F) Bright-field and immunofluorescence images of thrombi formed at t = 4 minutes under arterial (E) or venous (F) flow. Representative images of 6 individual experiments. Scale bars, 10 μm. PolyP signal (PPX_Δ12, green) was quantified from 4 randomly selected high-power images by ImageJ. **P < .01, by Student t test. RU, reflectance units.
Targeting XPR1 promotes thrombus formation in blood under flow. Citrated human whole-blood preincubated with XVDL (2-200 μg/ml; 4 hours) or PPX (2 mg/ml; 30 minutes) was readjusted to physiological Ca2+ and Mg2+ concentrations and perfused for 4 minutes over a collagen-coated surface at an arterial (1000 per second) (A) or venous (100 per second) (B) shear rate. Representative phase-contrast images (top) of thrombi formed during perfusion after incubation with the indicated XVDL concentrations. Scale bars, 10 µm. Bar graphs indicate the percentage of surface area covered by thrombi. Mean ± SD; n = 3. Comparisons were performed using 1-way analysis of variance and Tukey’s multiple comparison test; *P < .05, **P < .01. (C-D) Representative bright-field and immunofluorescence images of thrombi formed at t = 4 minutes under arterial (C) or venous (D) flow. Staining for fibrin (59D8; green) and platelets (GPIb; red) and merged images are shown. Scale bars, 10 μm. (E-F) Bright-field and immunofluorescence images of thrombi formed at t = 4 minutes under arterial (E) or venous (F) flow. Representative images of 6 individual experiments. Scale bars, 10 μm. PolyP signal (PPX_Δ12, green) was quantified from 4 randomly selected high-power images by ImageJ. **P < .01, by Student t test. RU, reflectance units.
XPR1-deficient platelets have increased polyP content
To characterize the functions of XPR1 in platelets, we targeted its expression selectively in the megakaryocytic/platelet lineage by breeding Xpr1fl/fl to Pf4-Cre transgenic mice. As littermate controls for homozygous conditional Xpr1 deficiency (Xpr1fl/fl Pf4-Cre), we used Xpr1fl/fl animals that lacked Cre expression. In addition, we produced heterozygous Xpr1fl/+ Pf4-Cre mice having only a single Xpr1 allele in platelets. Polymerase chain reaction confirmed each genotype (Figure 5A). Xpr1 expression in megakaryocytes prepared from a primary bone marrow cell culture of Xpr1fl/fl Pf4-Cre mice, was reduced to 45.7% ± 7.9% of levels seen in Xpr1fl/fl mice (Figure 5B). Furthermore, flow cytometry and western blot analysis confirmed XPR1 protein reduction to 38.2% ± 7.8% and 55.2% ± 7.9%, respectively, in Xpr1fl/fl Pf4-Cre megakaryocyte preparations (Figure 5C). In line with these data, Xpr1 expression was virtually absent in Xpr1fl/fl Pf4-Cre mouse platelets (7.4% ± 1.8% of Xpr1fl/fl platelets; Figure 5D). XPR1 protein level in platelets from Xpr1fl/fl Pf4-Cre mice was reduced to 12.0% ± 5.1% as compared with Xpr1fl/fl controls (Figure 5E), and flow cytometry confirmed the loss of XPR1 in Xpr1fl/fl Pf4-Cre mouse platelets (supplemental Figure 4). We next asked whether reduced platelet XPR1 alone can affect polyP content. In platelets from Xpr1fl/fl Pf4-Cre mice, total polyP level was increased by >75% over controls (2.60 ± 0.57 vs 1.42 ± 0.34 nmol per 108 platelets), whereas a single Xpr1 allele in Xpr1fl/+ Pf4-Cre mice was sufficient to maintain polyP close to baseline levels (1.41 ± 0.48 nmol per 108 platelets; Figure 5F). PolyP-specific, negative 4′,6-diamidino-2-phenylindole (DAPI) staining confirmed increased polyP content in isolated platelets of Xpr1fl/fl Pf4-Cre mice (not shown). Collagen-activated platelets from Xpr1fl/fl Pf4-Cre mice released slightly more soluble polyP into the supernatant, compared with platelets from mice with intact or heterozygous XPR1 expression (0.77 ± 0.07 nmol vs 0.66 ± 0.02 and 0.66 ± 0.03 nmol polyP per 108 platelets; Figure 5G), although the differences did not reach significance. Quantification of membrane-associated nanoparticle polyP showed that activated platelets of Xpr1fl/fl Pf4-Cre mice, exposed ∼70% more polyP on their cell surface than did animals with heterozygous or normal XPR1 expression (1.91 ± 0.09 vs 1.12 ± 0.10 nmol or 1.09 ± 0.10 nmol polyP per 108 platelets; Figure 5H). Hematologic analysis of peripheral blood from Xpr1fl/fl Pf4-Cre, Xpr1fl/+ Pf4-Cre, and Xpr1fl/fl mice did not reveal significant differences in platelet counts, platelet morphology (size and volume), production, and life span when assessed by platelet distribution width or percentage of platelets among other circulating cells (plateletcrit). Similarly, total leukocyte, leukocyte subpopulation, and red blood cell counts and morphology did not differ among Xpr1fl/fl Pf4-Cre, Xpr1fl/+ Pf4-Cre, and Xpr1fl/fl mouse lines (Table 1). To confirm the specificity of XPR1 toward polyP as the driver of increased platelet procoagulant activity, we characterized platelets from Xpr1fl/fl and Xpr1fl/fl Pf4-Cre mice. Luminescence assays revealed that intracellular ATP levels were indistinguishable in platelets from Xpr1fl/fl and Xpr1fl/fl Pf4-Cre mice (not shown). Real-time thrombin formation assays and conversion of thrombin substrate S2238 indicated that activated FX-triggered thrombin generation was indistinguishable in PRP from Xpr1fl/fl and Xpr1fl/fl Pf4-Cre mice (not shown). Moreover, annexin V-staining in flow cytometry showed comparable phosphatidylserine exposure on Xpr1fl/fl Pf4-Cre and Xpr1fl/fl mouse platelets upon activation with thrombin and collagen-related peptide (supplemental Figure 5A). CD31, CD41, and CD42b expression also remained unchanged (supplemental Figure 5B-D). These studies indicate that polyP-independent platelet functions and platelet surface properties were not different between Xpr1fl/fl and Xpr1fl/fl Pf4-Cre mice. Furthermore, in vitro studies demonstrated that aggregation in response to ristocetin (71.7% ± 3.1% vs 69.3% ± 1.4%; P = .45; Figure 5I) and low (71.0% ± 5.0% vs 77.0% ± 3.2%; P = .32; Figure 5J) or high concentrations of collagen (87.0% ± 2.1% vs 86.5% ± 2.1%; P = .89; Figure 5K) were similar in Xpr1fl/fl and Xpr1fl/fl Pf4-Cre platelets. Consistent with XPR1 inhibition in human platelets (Figure 4), thrombus formation on collagen-coated surfaces under arterial and venous shear rates was increased in blood from Xpr1fl/fl Pf4-Cre mice vs that in blood from Xpr1fl/+ Pf4-Cre and Xpr1fl/fl animals (supplemental Figure 6).
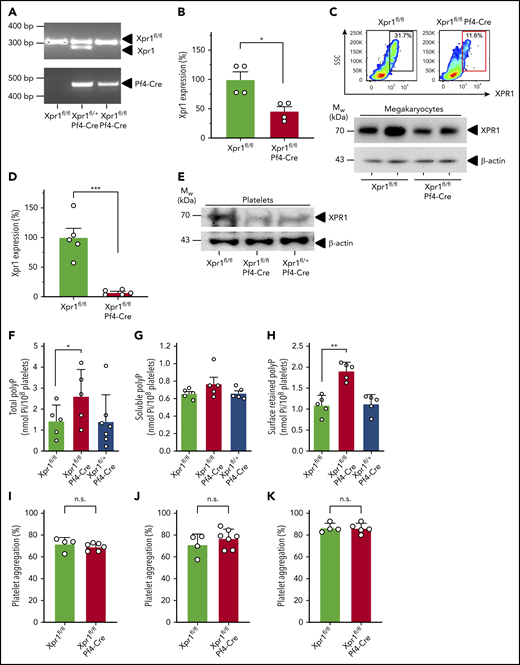
PolyP is increased in platelet-specific XPR1-deficient mice. (A) Genotyping results of Xpr1fl/fl, Xpr1fl/+ Pf4-Cre, and Xpr1fl/fl Pf4-Cre mice. (B) Relative Xpr1 mRNA expression levels in megakaryocytes enriched from cultured bone marrow cells of Xpr1fl/fl and Xpr1fl/fl Pf4-Cre mice. (C) XPR1 signal in megakaryocyte-enriched bone marrow cell cultures of Xpr1fl/fl and Xpr1fl/fl Pf4-Cre mice measured by flow cytometry. SSC, side scatter. Percentages in the top right corner show the portion of gated cells. Megakaryocyte preparations derived from 2 (Xpr1fl/fl and Xpr1fl/fl Pf4-Cre) mice each analyzed for XPR1 content by western blot. β-Actin served as loading control (bottom). (D) Xpr1 mRNA expression in platelets of Xpr1fl/fl and Xpr1fl/fl Pf4-Cre mice. Xpr1 expression in Xpr1fl/fl platelets was set to 100%. (E) Plasma membranes isolated from 109 platelets of Xpr1fl/fl, Xpr1fl/fl Pf4-Cre, or Xpr1fl/+ Pf4-Cre mice were analyzed by western blot antibodies directed against the XPR1 N terminus. β-Actin served as the loading control. (F) Total polyP in platelets of Xpr1fl/fl, Xpr1fl/fl Pf4-Cre, or Xpr1fl/+ Pf4-Cre mice. Soluble polyP (G) and membrane-associated polyP (H) released by collagen-stimulated platelets measured as monophosphate in PPX-treated (50 μg/ml; 1 hour) platelet supernatants. Symbols represent individual mice. *P < .05, **P < .01, by 1-way analysis of variance and Tukey’s multiple comparison test. Platelet aggregation following activation by 1.5 µg/ml ristocetin (I) and 5 (J) or 10 (K) µg/ml collagen at 10 minutes. Transmission of suspended resting platelets is 0% and buffer, 100%. Student t test. n.s. nonsignificant.
PolyP is increased in platelet-specific XPR1-deficient mice. (A) Genotyping results of Xpr1fl/fl, Xpr1fl/+ Pf4-Cre, and Xpr1fl/fl Pf4-Cre mice. (B) Relative Xpr1 mRNA expression levels in megakaryocytes enriched from cultured bone marrow cells of Xpr1fl/fl and Xpr1fl/fl Pf4-Cre mice. (C) XPR1 signal in megakaryocyte-enriched bone marrow cell cultures of Xpr1fl/fl and Xpr1fl/fl Pf4-Cre mice measured by flow cytometry. SSC, side scatter. Percentages in the top right corner show the portion of gated cells. Megakaryocyte preparations derived from 2 (Xpr1fl/fl and Xpr1fl/fl Pf4-Cre) mice each analyzed for XPR1 content by western blot. β-Actin served as loading control (bottom). (D) Xpr1 mRNA expression in platelets of Xpr1fl/fl and Xpr1fl/fl Pf4-Cre mice. Xpr1 expression in Xpr1fl/fl platelets was set to 100%. (E) Plasma membranes isolated from 109 platelets of Xpr1fl/fl, Xpr1fl/fl Pf4-Cre, or Xpr1fl/+ Pf4-Cre mice were analyzed by western blot antibodies directed against the XPR1 N terminus. β-Actin served as the loading control. (F) Total polyP in platelets of Xpr1fl/fl, Xpr1fl/fl Pf4-Cre, or Xpr1fl/+ Pf4-Cre mice. Soluble polyP (G) and membrane-associated polyP (H) released by collagen-stimulated platelets measured as monophosphate in PPX-treated (50 μg/ml; 1 hour) platelet supernatants. Symbols represent individual mice. *P < .05, **P < .01, by 1-way analysis of variance and Tukey’s multiple comparison test. Platelet aggregation following activation by 1.5 µg/ml ristocetin (I) and 5 (J) or 10 (K) µg/ml collagen at 10 minutes. Transmission of suspended resting platelets is 0% and buffer, 100%. Student t test. n.s. nonsignificant.
Blood counts in Xpr1fl/fl, Xpr1fl/fl Pf4-Cre, and Xpr1fl/+ Pf4-Cre murine blood samples
| Xpr1fl/fl (n = 9) | Xpr1fl/fl Pf4-Cre (n = 11) | Xpr1fl/+ Pf4-Cre (n = 18) | P | |
|---|---|---|---|---|
| RBC (×106/μL) | 9.40 ± 1.17 | 9.73 ± 0.61 | 9.31 ± 0.93 | .43 |
| Hgb (g/dL) | 14.24 ± 1.69 | 14.61 ± 0.75 | 13.81 ± 1.09 | .53 |
| HCT (%) | 47.66 ± 7.03 | 49.33 ± 3.45 | 46.86 ± 5.36 | .50 |
| MCV (fL) | 50.55 ± 01.87 | 50.71 ± 1.70 | 50.30 ± 1.68 | .85 |
| MCH (pg) | 15.18 ± 0.49 | 15.04 ± 0.40 | 14.88 ± 0.47 | .48 |
| MCHC (g/dL) | 30.03 ± 1.32 | 29.67 ± 1.19 | 29.61 ± 0.47 | .53 |
| RDW-SD (fL) | 29.62 ± 2.22 | 29.10 ± 1.74 | 30.24 ± 1.89 | .55 |
| RDW-CV (%) | 22.76 ± 2.08 | 23.02 ± 1.19 | 23.07 ± 1.63 | .72 |
| RET (×103/μL) | 379.41 ± 111.22 | 386.60 ± 97.83 | 355.38 ± 82.14 | .88 |
| RET (%) | 4.01 ± 0.93 | 3.97 ± 0.97 | 3.82 ± 0.80 | .92 |
| PLT (×103/μL) | 607.67 ± 266.56 | 717.54 ± 347.24 | 757.17 ± 300.98 | .44 |
| PDW (fL) | 7.21 ± 0.80 | 7.20 ± 0.40 | 6.96 ± 0.86 | .97 |
| MPV (fL) | 6.36 ± 0.43 | 6.23 ± 0.38 | 6.05 ± 0.52 | .49 |
| P-LCR (%) | 5.03 ± 2.39 | 3.59 ± 1.11 | 3.55 ± 2.14 | .09 |
| PCT (%) | 0.37 ± 0.19 | 0.45 ± 0.22 | 0.46 ± 0.18 | .38 |
| WBC (×103/μL) | 6.22 ± 4.71 | 6.96 ± 3.53 | 6.73 ± 4.11 | .69 |
| NEUT (×103/μL) | 0.86 ± 0.90 | 1.18 ± 0.91 | 0.95 ± 1.02 | .44 |
| LYMPH (×103/μL) | 5.14 ± 3.96 | 5.56 ± 3.06 | 5.56 ± 3.25 | .79 |
| MONO (×103/μL) | 0.11 ± 0.13 | 0.12 ± 0.06 | 0.09 ± 0.05 | .80 |
| EO (×103/μL) | 0.11 ± 0.08 | 0.09 ± 0.08 | 0.12 ± 0.12 | .50 |
| BASO (×103/μL) | 0.00 ± 0.00 | 0.01 ± 0.01 | 0.00 ± 0.01 | N/A |
| NEUT (%) | 13.8 ± 10.1 | 17.0 ± 12.4 | 12.8 ± 7.0 | .54 |
| LYMPH (%) | 82.7 ± 11.0 | 79.9 ± 12.3 | 83.8 ± 7.4 | .60 |
| MONO (%) | 1.7 ± 0.9 | 2.0 ± 1.1 | 1.7 ± 1.4 | .54 |
| EO (%) | 1.87 ± 0.79 | 1.08 ± 0.61 | 1.69 ± 1.03 | .2 |
| BASO (%) | 0.01 ± 0.03 | 0.07 ± 0.10 | 0.07 ± 0.15 | N/A |
Data are expressed as the mean ± standard deviation. P values represent Xpr1fl/fl Pf4-Cre vs Xpr1fl/fl murine blood counts.
BASO, basophil; EO, eosinophil; HCT, hematocrit; Hgb, hemoglobin; LYMPH, lymphocyte; MCH, mean corpuscular hemoglobin, MCHC, mean corpuscular hemoglobin concentration; MCV, mean corpuscular volume; MPV, mean platelet volume; MONO, monocyte; N/A, not applicable, because the absolute number of events counted was too low to perform statistical analysis; NEUT, neutrophil; PCT, plateletcrit; PDW, platelet distribution width; P-LCR, platelet large-cell ratio; PLT, platelet; RBC, red blood cell; RDW-SD, red cell distribution width standard deviation; RDW-CV, red cell distribution coefficient of variation; RET, reticulocyte; WBC, white blood cell.
Platelet-specific XPR1-deficient mice are prothrombotic
To determine whether platelet XPR1 contributes to thrombosis in vivo, we challenged platelet-specific XPR1-deficient mice in models of arterial and venous thrombosis. Thrombosis in the carotid artery was induced by topical application of 5% ferric chloride (FeCl3), a well-established model of platelet-driven thrombus formation.49 Platelet polyP-induced thrombosis is defective in FXII deficient (F12−/−) mice30,42,45,50-52 and consistent with the previous reports, F12−/− mice were protected from arterial thrombosis, as seen by the lack of occlusive thrombi after FeCl3 challenge. Vessel occlusion times were significantly shortened in Xpr1fl/fl Pf4-Cre mice compared with times in Xpr1fl/fl controls (320 ± 34 vs 473 ± 52 seconds), whereas occlusion times in heterozygous Xpr1fl/+ Pf4-Cre mice were almost identical to those in control mice (472 ± 50 seconds; Figure 6A-B). To study venous thrombosis, we used a model of platelet-driven lethal pulmonary thromboembolism (PTE). In this assay, platelets were activated by IV infusion of collagen and epinephrine, and mice that survived >30 minutes were considered survivors (Figure 6C; bottom). In line with earlier data,42,52 F12−/− mice were largely protected from precipitate disease in this PTE model (3 of 4 animals survived). However, all Xpr1fl/fl Pf4-Cre mice (5 of 5) universally succumbed within the first 3 minutes after challenge, with an average survival time of only 1.1 ± 0.2 minutes. Similarly, all Xpr1fl/fl control mice (5 of 5) did not survive the collagen/epinephrine challenge but their survival was prolonged by ninefold (9.8 ± 1.7 minutes). Survival times of heterozygous mice were similar to those in control mice (9.8 ± 3.7 minutes) and 3 of 7 mice died within the first 5 minutes of the challenge. To confirm PTE formation, lung perfusion was studied in all challenged mice by using IV administration of Evans blue dye. Perfused lung areas turned blue, whereas occluded parts remained their natural pink color. The collagen/epinephrine challenge resulted in almost complete vascular thrombotic occlusion in Xpr1fl/fl Pf4-Cre mice, visualized by disturbed perfusion of the dye. Heterozygous Xpr1fl/+ Pf4-Cre and control mice showed incomplete perfusion of the dye, indicating partial vessel occlusion. In contrast, lungs of F12−/− mice presented with uniform distribution of the dye, consistent with preserved vessel perfusion (Figure 6C; top). Histologic sections from challenged mice showed a significantly higher number of large occlusive thrombi per field of view in the lungs of Xpr1fl/fl Pf4-Cre mice compared with the number in Xpr1fl/+ Pf4-Cre and Xpr1fl/fl mice. Virtually no thrombi were found in challenged F12−/− mice (Figure 6D).

Increased arterial and venous thrombosis but normal hemostasis in platelet XPR1-deficient mice. (A) Thrombus formation was induced in the left carotid artery by topical application of 5% FeCl3 for 3 minutes in F12−/−, Xpr1fl/fl, Xpr1fl/+ Pf4-Cre, and Xpr1fl/fl Pf4-Cre mice. Artery patency was monitored by a flow probe until complete occlusion occurred, and 0 flow was recorded for >10 minutes. Representative curves for 5 to 8 mice per genotype. (B) Time to complete carotid artery occlusion in the Xpr1fl/fl, Xpr1fl/fl Pf4-Cre, and Xpr1fl/+ Pf4-Cre mice from panel A. (C) PTE was induced by IV infusion of collagen and epinephrine in Xpr1fl/fl, Xpr1fl/fl Pf4-Cre, Xpr1fl/+ Pf4-Cre, and F12−/− mice. Shortly after the onset of respiratory arrest or at 30 minutes in mice that survived collagen-epinephrine treatment, Evans blue was infused IV while the heart was still beating. Occluded parts of the lungs remained their natural pinkish color. Lungs were excised, and perfusion defects were analyzed by impaired distribution of the dye in lung tissue (top), and survival time was assessed (bottom). Scale bar, 5 mm. (D) Hematoxylin and eosin–stained sections of lungs from Xpr1fl/fl, Xpr1fl/fl Pf4-Cre, Xpr1fl/+ Pf4-Cre, and F12−/− mice 30 minutes after collagen-epinephrine challenge (top). Green asterisks mark thrombi. Original magnification, ×10. The number of thrombi per visual field was counted in 6 mice (bottom). Data represent the mean ± standard deviation of 10 fields each. Scale bar, 100 µm. Bleeding times and blood loss from clipped tails assessed the hemostatic capacity of Xpr1fl/fl, Xpr1fl/fl Pf4-Cre, and Xpr1fl/+ Pf4-Cre mice. Bleeding time (E) and total hemoglobin loss (F), as determined by absorbance of hemoglobin in 37°C phosphate-buffered saline at λ = 575 nm. (G) Tail bleeding times were analyzed by gently adsorbing blood with a filter paper. Each symbol represents 1 animal; *P < .05; **P < .01; n.s. nonsignificant, by 1-way ANOVA and Tukey’s multiple comparison test.
Increased arterial and venous thrombosis but normal hemostasis in platelet XPR1-deficient mice. (A) Thrombus formation was induced in the left carotid artery by topical application of 5% FeCl3 for 3 minutes in F12−/−, Xpr1fl/fl, Xpr1fl/+ Pf4-Cre, and Xpr1fl/fl Pf4-Cre mice. Artery patency was monitored by a flow probe until complete occlusion occurred, and 0 flow was recorded for >10 minutes. Representative curves for 5 to 8 mice per genotype. (B) Time to complete carotid artery occlusion in the Xpr1fl/fl, Xpr1fl/fl Pf4-Cre, and Xpr1fl/+ Pf4-Cre mice from panel A. (C) PTE was induced by IV infusion of collagen and epinephrine in Xpr1fl/fl, Xpr1fl/fl Pf4-Cre, Xpr1fl/+ Pf4-Cre, and F12−/− mice. Shortly after the onset of respiratory arrest or at 30 minutes in mice that survived collagen-epinephrine treatment, Evans blue was infused IV while the heart was still beating. Occluded parts of the lungs remained their natural pinkish color. Lungs were excised, and perfusion defects were analyzed by impaired distribution of the dye in lung tissue (top), and survival time was assessed (bottom). Scale bar, 5 mm. (D) Hematoxylin and eosin–stained sections of lungs from Xpr1fl/fl, Xpr1fl/fl Pf4-Cre, Xpr1fl/+ Pf4-Cre, and F12−/− mice 30 minutes after collagen-epinephrine challenge (top). Green asterisks mark thrombi. Original magnification, ×10. The number of thrombi per visual field was counted in 6 mice (bottom). Data represent the mean ± standard deviation of 10 fields each. Scale bar, 100 µm. Bleeding times and blood loss from clipped tails assessed the hemostatic capacity of Xpr1fl/fl, Xpr1fl/fl Pf4-Cre, and Xpr1fl/+ Pf4-Cre mice. Bleeding time (E) and total hemoglobin loss (F), as determined by absorbance of hemoglobin in 37°C phosphate-buffered saline at λ = 575 nm. (G) Tail bleeding times were analyzed by gently adsorbing blood with a filter paper. Each symbol represents 1 animal; *P < .05; **P < .01; n.s. nonsignificant, by 1-way ANOVA and Tukey’s multiple comparison test.
To test whether increased platelet polyP content alters hemostasis, we examined bleeding times and blood loss in Xpr1fl/fl, Xpr1fl/fl Pf4-Cre, and Xpr1fl/+ Pf4-Cre mice. Time to cessation of bleeding after tail clipping was similar in all 3 groups (90 ± 15 vs 93 ± 17 and 128 ± 17 seconds; Figure 6E). The amount of blood loss, as measured by hemoglobin concentration, was also unaltered among the respective groups (0.16 ± 0.05 vs 0.11 ± 0.03 and 0.25 ± 0.06; Figure 6F). In an independent experimental approach, we monitored bleeding from a tail injury site by gently adsorbing blood on a filter paper without touching the wound. Bleeding times of Xpr1fl/fl, Xpr1fl/fl Pf4-Cre, and Xpr1fl/+ Pf4-Cre mice were recorded in 5-second intervals and were similar (368 ± 8, 364 ± 6, and 372 ± 11 seconds; Figure 6G; supplemental Figure 7). In summary, these studies indicate that XPR1 deficiency in platelets leads to accumulation of polyP that results in increased thrombosis, but has no impact on hemostasis.
Discussion
Our study identified XPR1 as an instrumental contributor to procoagulant polyP homeostasis in mammalian systems and, by extension, as a key regulator of thrombosis. Specifically, XPR1 was the most abundant phosphate exporter in platelets and its expression correlated inversely with polyP content. Increasing intracellular Pi levels by interfering with platelet XPR1 activity led to polyP accumulation, which increased thrombosis risk in vitro and in vivo, without affecting hemostasis.
Seminal studies have revealed that activated platelets trigger coagulation in an FXII-dependent manner41,53-55 and work during the past decade identified platelet polyP as an FXII contact activator in human plasma in vivo.15 An array of experimental thrombosis models in mice and baboons confirmed that polyP/FXII–mediated coagulation plays a critical role in arterial and venous thrombo-occlusive diseases.30,52,56-59 Recently, polyP release and deposition as calcium-rich nanoparticles on the surface of activated platelets has been visualized.16,60 Consistent with these findings,21,61 pharmacologic and genetic targeting of platelet XPR1 increased polyP stores and release, increased fibrin formation, and accelerated thrombus development under arterial and venous shear rates in human blood (Figure 4) and in vivo in mice (Figure 6). Conversely, mice deficient in inositol-hexakisphosphate kinase 1 (IP6K1), a key enzyme implicated in diphosphoinositol pentakisphosphate (an abundant inositol pyrophosphate) biosynthesis, displayed lower polyP levels in platelets, lengthened clotting times, altered clot architecture, and were protected against PTE.57 However, gene disruption of murine IP6K1 also increased insulin sensitivity, reduced spermatogenesis, and, in contrast to platelet XPR1 deficiency (Figure 6), compromised hemostasis, indicating that the kinase is involved in a multitude of pathways across various tissues.57 Patients with Hermansky-Pudlak syndrome also have reduced platelet polyP,62 and, similar to their murine counterparts, FXII-dependent clotting is defective in PRP.15 In contrast, targeted inhibition of XPR1 led to platelet polyP accumulation and promoted thrombosis (Figure 3). Potent agents that neutralize polyP have been developed, including cationic polyethylenimine and polyamidoamine dendrimers,56 crown ether–based universal heparin reversal agents,59 and exopolyphosphatase mutants that either degrade (PPX) or bind (PPX_Δ12) the polymer.30 These polyP inhibitors interfere with platelet-driven arterial and venous thrombosis, but they spare hemostasis, as evidenced by their limited impact on bleeding.30,59 This selective role of polyP inhibitors on thrombosis is in line with our findings that polyP accumulation in XPR1-defective platelets differentially contributes to thrombosis while sparing platelet hemostatic functions (Figures 3,4, and 6). Thromboprotection in the absence of bleeding conferred by various polyP inhibitors also supports the notion that platelet polyP contributes to coagulation in vivo, in large part through FXII activation. In contrast to other potential polyP targets, including coagulation factors V and XI, tissue factor pathway inhibitor, von Willebrand factor or fibrinolytic pathway components,17-20,22,63,64 FXII has no role in hemostatic coagulation mechanisms and thus interference with its activation does not increase bleeding.
PolyP is an evolutionary ancient molecule that serves as a storage form of Pi. The role of Pi in polyP synthesis and the function of Pi export in the regulation of polyP is evolutionarily conserved from prokaryotes to eukaryotes.27 In prokaryotes, the conversion of Pi to polyP contributes to reducing intracellular osmotic pressure1 ; however, it is unknown whether this function is preserved in higher eukaryotic cells. Pi transporters help maintain intracellular Pi concentration at significantly higher levels than extracellular Pi (60-100 vs 1 mM). Disturbance of Pi levels affects polyP content in HEK293 cells and similarly, influences the XPR1-regulated Pi/polyP equilibrium in megakaryocytes and platelets (Figures 2 and 5). XPR1 expression in Xpr1fl/fl Pf4-Cre mouse platelets was below residual XPR1 levels in cultured megakaryocytes from these mice. These higher XPR1 levels may be related to XPR1-expressing cells in the primary megakaryocyte preparation and incomplete Cre-mediated Xpr1 ablation (Figure 5). Pi transporter activity controls Pi/polyP levels in bacteria and yeast.6,8,27,65 Although an association of Pi accumulation and storage as polyP seems to be conserved from prokaryotes to metazoans, regulation of polyP metabolism in mammalians has remained enigmatic.1 XPR1 activity is regulated by the phosphate-sensing domain SPX which responds to Pi levels.66 Moreover, XPR1 trafficking to distinct subcellular compartments (Figure 1E)67 restricts its impact on intracellular polyP content to specific locations and pools within cells.16,30 Indeed, targeting IP6K1 reduces platelet polyP levels by ∼50%,57 supporting that polyP accumulation occurs in specific sites within cells and in an orderly, regulated manner.
Beyond its role in platelets, impaired XPR1 function caused by missense mutations in humans has been linked to an adult-onset neurodegenerative disease, primary familial brain calcification. Although it is a rare disorder characterized by calcium-(poly)phosphate deposits in the basal ganglia and other brain regions,68,69 its clinical phenotype highlights the impact of Pi/polyP regulation in health and disease. The number of missense variants in the human XPR1 gene is consistently far below the number of expected variants, with a significantly increased z score of 3.23 (https://gnomad.broadinstitute.org/) further confirming its vital role in homeostasis.
In summary, our data indicate that the ancient link between intracellular Pi and polyP levels are conserved in mammals. Consistent with their functions in prokaryotes, Pi transporters also regulate polyP homeostasis in platelets and influence thrombosis.
Original data and experimental tools are available upon request to the corresponding author (thomas@renne.net).
The online version of this article contains a data supplement.
The publication costs of this article were defrayed in part by page charge payment. Therefore, and solely to indicate this fact, this article is hereby marked “advertisement” in accordance with 18 USC section 1734.
Acknowledgments
The authors thank Clément Naudin for critically reading the manuscript, and Anne Jämsä for valuable technical assistance.
This work was supported by Deutsche Forschungsgemeinschaft (DFG, German Research Foundation) grants A11/SFB 877, B8/SFB 841, and P6/KFO306 (T.R.); and the Federal Ministry of Education and Research (BMBF) (A.S.).
Authorship
Contribution: S.G., E.X.S., C.M., and T.R. conceived and/or designed the study; L.M.B. and J.O. provided the bioinformatics; R.K.M., M.A., G.P., and M.H. performed the in vitro experiments; R.K.M. performed the in vivo experiments; M.S. performed the transmission electron microscope analyses; D.F. provided the in vivo model; C.D., A.S., T.B.H., M.F., M.G., S.R.-J., S.B., and C.K. collected and discussed the data; R.K.M., M.A, E.X.S., and T.R. wrote the manuscript; and all authors edited the manuscript.
Conflict-of-interest disclosure: The authors declare no competing financial interests.
Correspondence: Thomas Renné, University Medical Center Hamburg-Eppendorf, Institute of Clinical Chemistry and Laboratory Medicine (O26), Martinistrasse 52, D-20246 Hamburg, Germany; e-mail: thomas@renne.net.

This feature is available to Subscribers Only
Sign In or Create an Account Close Modal