

Key Points
Day-19 MRD between 0.001% and <0.01% is associated with high relapse rates in low-risk ALL managed with reduced-intensity therapy.
Survival approached 95% among children with low-risk ALL and day-19 MRD <0.01% who were treated with reduced-intensity therapy.

Abstract
Legacy data show that ∼40% of children with acute lymphoblastic leukemia (ALL) were cured with limited antimetabolite-based chemotherapy regimens. However, identifying patients with very-low-risk (VLR) ALL remains imprecise. Patients selected based on a combination of presenting features and a minimal residual disease (MRD) level <0.01% on day 19 of induction therapy had excellent outcomes with low-intensity treatment. We investigated the impact of MRD levels between 0.001% and <0.01% early in remission induction on the outcome of VLR ALL treated with a low-intensity regimen. Between October of 2011 and September of 2015, 200 consecutive patients with B-precursor ALL with favorable clinicopathologic features and MRD levels <0.01%, as assessed by flow cytometry in the bone marrow on day 19 and at the end of induction therapy, received reduced-intensity therapy. The 5-year event-free survival was 89.5% (± 2.2% standard error [SE]), and the overall survival was 95.5% (± 1.5% SE). The 5-year cumulative incidence of relapse (CIR) was 7% (95% confidence interval, 4-11%). MRD levels were between 0.001% and <0.01% on day 19 in 29 patients. These patients had a 5-year CIR that was significantly higher than that of patients with undetectable residual leukemia (17.2% ± 7.2% vs 5.3% ± 1.7%, respectively; P = .02). Our study shows that children with VLR ALL can be treated successfully with decreased-intensity therapy, and it suggests that the classification criteria for VLR can be further refined by using a more sensitive MRD assay.
Introduction
The overall survival (OS) rates for children with acute lymphoblastic leukemia (ALL) receiving contemporary therapy now exceed 90%.1,2 This is attributable to the adoption of risk-adapted intensification of chemotherapy in conjunction with improved supportive care.3 The presenting clinical and laboratory features, in conjunction with the response to therapy, as evaluated by different methodologies, are predictive of relapse and have emerged as useful indicators for identifying patients at high risk for leukemia relapse.4 Further intensification of therapy has resulted in improved survival of patients with high-risk ALL.5 However, long-term follow-up of adult survivors of childhood cancer, including survivors of ALL, has revealed a range of treatment-related late effects in this population.6 These observations have stimulated the development of strategies to prevent or mitigate late effects of childhood cancer treatment. Analysis of legacy clinical trials conducted in the 1980s and 1990s shows that ∼40% to 50% of all children and adolescents with ALL were cured with much less intensive antimetabolite-based chemotherapy regimens.7-9 Furthermore, long-term survival ∼ 90% was observed in a subset of the patients with favorable clinical and laboratory features.10,11
Currently, the intensity of protocols used to treat patients without high-risk disease features varies. The regimens are generally much more intensive than those used historically, suggesting that many children with ALL are overtreated, but there has been a paucity of studies identifying patients with ALL who could be cured with reduced-intensity chemotherapy regimens.12 Recently, the long-term results of a study of a dramatically reduced–intensity therapy conducted in Recife, Brazil were reported.13 The study participants included children with progenitor B-cell ALL without high-risk features who exhibited early rapid and profound leukemia clearance, as measured by a simplified assay (sensitivity, 0.01%) on induction day 19.14 We have treated 200 consecutive children with progenitor B-cell ALL at Children’s Cancer Hospital Egypt (CCHE), following the guidelines of the Recife protocol. We obtained data on the early clearance of leukemia cells by using a more sensitive assay (sensitivity, 0.001%). Herein, we describe the outcomes of this study and the impact of minimal residual disease (MRD) levels between 0.001% and <0.01% early in induction remission on the outcomes of patients receiving reduced-intensity therapy.
Patients and methods
Patients and risk classification
From October of 2011 to September of 2015, 200 of 879 pediatric patients with B-precursor ALL who were consecutively admitted to CCHE were enrolled on the Egypt VLR ALL 2011 protocol. The risk groups were defined based on the presenting features and early response to treatment (Table 1). Patients meeting the criteria of low risk and bone marrow MRD <0.01% on day 19 and at the time of complete remission (CR) were classified as very low risk (VLR) and were eligible for enrollment in the VLR protocol. Patients with MRD ≥ 0.01% on day 19 or at the end of induction were treated with a separate CCHE institutional standard treatment protocol based on the St Jude Total Therapy XV protocol.15 The VLR protocol was approved by the CCHE institutional review board. Informed consent was obtained from parents or guardians of all participants.
Provisional classification of patients in the low-risk group (at diagnosis)
| Feature | Type/value/definition |
|---|---|
| Lineage | B-precursor ALL |
| Age, y | 1.0 to 9.9 |
| Leukocyte count, ×109/L | <50 |
| CNS involvement | CNS 1 or 2 |
| Testicular involvement | No |
| DNA index | >0.95 |
| Genotype | Excluded: t(9;22)/BCR-ABL, t(1;19)/TCF3-PBX1, t(17;19)/TCF3/HLF, KMT2A rearrangement, and iAMP21 |
Diagnosis and MRD measurement
The diagnosis of ALL and involvement of the central nervous system (CNS) were based on morphologic, immunophenotypic, karyotypic, and genotypic features of leukemia cells, as described previously.14,15 MRD was measured by flow cytometry, as described previously.16,17 Briefly, bone marrow mononucleated cells were isolated by density gradient centrifugation (using Lymphoprep density gradient medium; Alere Technologies) and labeled with a panel of anti-CD20/CD34/CD45/CD10/CD19 antibodies. For risk definition at day 19, only the reactivity data of anti-CD19 conjugated with allophycocyanin, anti-CD10 conjugated with phycoerythrin-cyanin 7), anti-CD20 conjugated with fluorescein isothiocyanate (all from Beckman Coulter, Brea, CA), anti-CD34 conjugated with phycoerythrin (BD Biosciences, San Jose, CA), and anti-CD45 conjugated with phycoerythrin Texas Red-X (Beckman Coulter) (for the simplified flow cytometric assay) were considered. MRD was also measured on day 19 and at the end of induction by a standard flow cytometric assay.18 Cell staining was analyzed with a Navios 6-color flow cytometer and Kaluza software (Beckman Coulter). At least 100 000 viable mononucleated cells were analyzed for each sample. The day-19 MRD measurement was performed at CCHE, and the results were reviewed by the Immunopathology and Cell Therapy Division of the Department of Pediatrics at the National University of Singapore.
Treatment outline
Remission induction therapy (4 weeks)
Remission induction therapy was initiated, with prednisone (40 mg/m2 per day) administered orally on days 1-28; vincristine (1.5 mg/m2; maximum, 2 mg) administered IV on days 5, 12, 19, and 26; doxorubicin (25 mg/m2) administered IV on days 5 and 12; and Escherichia coli L-asparaginase (10 000 U/m2 per dose) administered intramuscularly (3 times weekly) between days 6 through 16. Age-dependent triple intrathecal chemotherapy with hydrocortisone, methotrexate, and cytarabine was given on days 5 and 19 to patients with CNS 1 disease (lymphoblasts are not detected by cytocentrifuge preparation analysis [CNS negative]). An extra dose of intrathecal therapy was given on day 12 to those patients with CNS 2 disease (total nucleated cell count <5/mL and lymphoblasts are detected by cytocentrifuge preparation analysis) or traumatic taps. Intrathecal injections were followed 24 and 30 hours later by leucovorin, 5 mg/m2 orally. A bone marrow aspirate was obtained on day 28 to assess remission status.
Consolidation therapy (8 weeks)
Patients received 4 courses of high-dose methotrexate (HDMTX), 2.5 g/m2 IV, administered over 4 hours, as well as triple intrathecal therapy on days 1, 15, 29, and 43 in combination with mercaptopurine, 50 mg/m2 per day orally, over 2 months. Serum levels of methotrexate were measured after 42 hours and then daily until undetectable. Leucovorin rescue, 10 mg/m2 IV, was initiated 36 hours after beginning HDMTX; it was given every 6 hours, and the dose was adjusted according to the serum levels of methotrexate.
Continuation therapy (104 weeks)
Treatment began 2 weeks after course 4 of HDMTX if there was adequate recovery from mucositis and/or marrow suppression. Continuation therapy after consolidation consisted of (1) an antimetabolite backbone of mercaptopurine, 75 mg/m2/day by mouth at night, combined with methotrexate, 40 mg/m2/week IV/intramuscularly; (2) dexamethasone, 6 mg/m2 orally daily × 7 days, and vincristine, 1.5 mg/m2 (maximum, 2 mg) IV pulses, every 4 weeks during the first year of maintenance therapy; and (3) triple intrathecal therapy every 4 weeks from weeks 3 to 15 and every 8 weeks from weeks 15 to 52 (for a total of 7 doses during continuation therapy). During the second year of maintenance therapy, only mercaptopurine and methotrexate were administered, with the exception of patients with CNS 2 disease and those with traumatic taps at diagnosis, who received longer intrathecal therapy (at weeks 60, 68, 76, 84, 92, and 100, for a total of 13 doses during continuation therapy). CNS radiotherapy was not included. Continuation therapy was given for 104 weeks to all patients.
Reinduction therapy (weeks 7-12)
Reinduction therapy was administered from week 7 to week 12 of continuation treatment for a total of 42 days. It consisted of a 5-drug combination: vincristine, 1.5 mg/m2 (maximum, 2 mg) IV, on days 1, 8, 15, and 22; high-dose E coli L-asparaginase, 25 000 U/m2 per dose, on days 1, 8, 15, and 22; dexamethasone, 6 mg/m2 orally daily (delivered as separate 3 doses), on days 1 through 7 and days 15 through 21; and 1 course of HDMTX, 2.5 g/m2 IV, on day 29 combined with mercaptopurine, 50 mg/m2 per day orally, from day 29 to day 42. Intrathecal therapy was given on days 1 and 29.
Study conduct
Over the 6-year duration of the study, patient enrollment, presenting features, MRD results, treatment response, and tolerance were reviewed by CCHE and St Jude investigators via monthly web conferences.
Statistical analysis
Categorical data were compared using the χ2 test or Fisher’s exact test. All tests were conducted at a significance level of 5%. Analyses were performed using SPSS software package version 20. Event-free survival (EFS) and OS curves were obtained using the Kaplan–Meier method, and standard errors (SEs) were calculated using the Greenwood method. The differences between curves were tested for statistical significance using the log-rank test.19 EFS was defined as the time from diagnosis to the first event (death in induction, relapse, second malignancy, or death in CR) or to the date of last contact. Relapse-free survival (RFS) was defined as the time from CR to relapse or to censoring at the date of last contact. OS was defined as the time from diagnosis to death from any cause or to censoring at the date of last follow-up for surviving patients. The cumulative incidence of relapse (CIR) and the cumulative incidence of toxic death were estimated by adjusting for competing risks of other events, and comparisons were performed using the Gray test and RStudio software.20
Results
Of 879 patients with B-precursor ALL, 509 (57.9%) were provisionally classified as being in the low-risk ALL group according to their clinical and biological presenting features. Of these 509 low-risk patients, 200 (39.3%; 107 males and 93 females) had rapid blast clearance, as reflected by MRD < 0.01% in the bone marrow on day 19 of induction therapy and at the end of induction (day 28). These patients were classified as VLR and were enrolled on the Egypt ALL-VLR 2011 protocol. The median age at diagnosis was 4 years (range, 1.3-9.8), and the median leukocyte count was 5.75 × 10⁹/L (range, 0.3 × 10⁹/L to 48.7 × 10⁹/L). No patient had CNS 2 disease at diagnosis, but 16 patients (8%) had spinal fluid contaminated with ≥10 red cells per milliliter (traumatic tap). A comparison of the presenting characteristics of VLR patients who were eligible for the study and those of provisionally low-risk patients who were ineligible revealed only 1 significant difference: t(12;21) ETV6-RUNX1 was identified in 42.5% of VLR patients but in only 21% of non-VLR patients (P < .001%).
One of the patients with MRD <0.01% on day19 had MRD of 0.08% at the end of induction and was excluded from the study. Day-19 bone marrow samples were reviewed for 359 of the 509 patients with provisional low-risk ALL, including all 200 VLR patients. There were discrepancies in the interpretation of the MRD results for 10 samples (2.8%) resulting from an inadequate number of cells (n = 4), false-positive results (n = 2), or false-negative results (n = 4). These patients were also excluded from the study. The results reported by the National University of Singapore laboratory were used for risk classification (Figure 1). No treatment abandonment was observed.
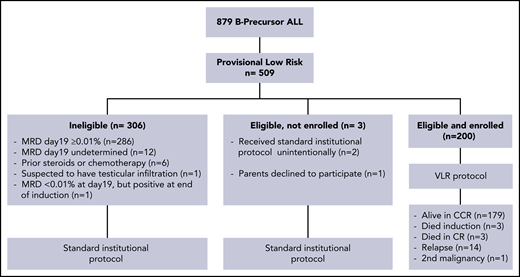
Consort flow-chart diagram of patients with B-progenitor acute lymphoblastic leukemia. CCR, continuous complete remission.
Consort flow-chart diagram of patients with B-progenitor acute lymphoblastic leukemia. CCR, continuous complete remission.
Treatment outcomes
Of the 200 VLR patients, 3 died from infectious complications during induction treatment, and 197 (98.5%) attained CR at a median of 30 days (range, 28-43). A total of 21 adverse events have occurred to date. In addition to 3 early deaths, 14 patients experienced relapse (10 hematologic, 2 isolated CNS, 1 isolated testicular, and 1 combined testicular and hematologic case), 1 patient developed secondary acute myeloid leukemia, and 3 patients died in remission (as a result of infection in 2 cases and a car accident in 1 case). Thus, 179 patients (89.5%) have completed protocol therapy and are alive and in continuous CR at a median follow-up of 76 months (range, 53-99 months).
For the 14 patients whose disease relapsed, the median time to relapse was 38 months from diagnosis (range, 24-53). Relapse occurred after completion of therapy in 13 patients and during therapy in 1 patient. All patients attained a second CR with salvage therapy, and 9 remain in remission.
The 5-year EFS for the 200 VLR patients was 89.5% (± 2.2% SE), and the OS was 95.5% (± 1.5%) (Figure 2). The 5-year CIR was 7% (95% confidence interval [CI], 4-11%) for any relapse and 1% (95% CI, 0.2-3.3%) for isolated CNS relapse.
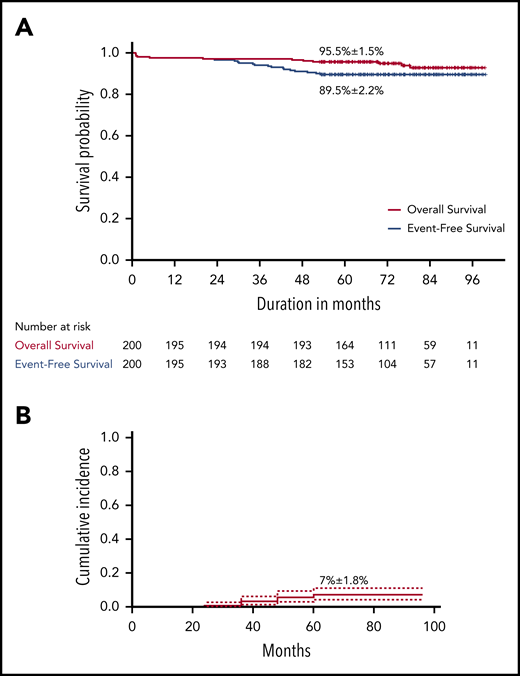
Survival analysis in children with acute lymphoblastic leukemia who received reduced-intensity therapy. (A) Overall and event-free survival. (B) Cumulative incidence of relapse.
Survival analysis in children with acute lymphoblastic leukemia who received reduced-intensity therapy. (A) Overall and event-free survival. (B) Cumulative incidence of relapse.
Prognostic factors
Table 2 summarizes the 5-year EFS and CIR by known presenting prognostic factors for childhood ALL. Twenty-nine of the 200 patients (14.5%) had detectable residual leukemia cells at levels between 0.001% and <0.01% on day 19. The 5-year RFS and CIR were 82.1% ± 7.2% and 17.2% ± 7.2%, respectively, for these patients vs 94.6% ± 1.8% and 5.3% ± 1.7%, respectively, for patients with undetectable leukemia cells, a statistically significant difference (P = .02) (Figure 3). With the exception of detectable MRD <0.01%, there was no significant association with any of the variables analyzed. Patients with traumatic tap had a higher frequency of bone marrow relapse compared with patients with CNS 1 status (18.7% ± 10.1% vs 6% ± 1.7%; P = .051). Similarly, patients with double trisomy of chromosomes 4 and 10 fared better than did those without that feature, but the CIR did not differ significantly between these karyotypic groups (P = .12).
Treatment outcome by prognostic factors
| Prognostic factors | n (%) | 5-year EFS, estimate ± SE, % | P (log-rank test) | CIR at 5 years, estimate ± SE, % | P (Gray’s test) |
|---|---|---|---|---|---|
| Sex | |||||
| Male | 107 (53.5) | 92.5 ± 2.5 | .12 | 6.5 ± 2.4 | .77 |
| Female | 93 (46.5) | 86.0 ± 3.6 | 7.5 ± 2.7 | ||
| Age | |||||
| 1 to <5 years | 133 (66.5) | 88 ± 2.8 | .31 | 7.5 ± 2.3 | .66 |
| ≥5 years | 67 (33.5) | 92.5 ± 3.2 | 5.9 ± 2.9 | ||
| White blood cells, 109/L | |||||
| <10 | 140 (70) | 90.7 ± 2.5 | .39 | 7.1 ± 2.2 | .91 |
| 10-50 | 60 (30) | 86.7 ± 4.4 | 6.7 ± 3.2 | ||
| CNS disease* | |||||
| CNS 1 | 184 (92) | 90.2 ± 2.2 | .26 | 6 ± 1.7 | .051 |
| Traumatic tap | 16 (8) | 81.3 ± 9.8 | 18.7 ± 10.1 | ||
| DNA index | |||||
| ≥1.16 | 61 (30.5) | 95.1 ± 2.8 | .092 | 4.9 ± 2.8 | .46 |
| <1.16 | 139 (69.5) | 87.1 ± 2.8 | 7.9 ± 2.3 | ||
| t(12;21)/ETV6-RUNX1 | |||||
| Present | 85 (42.5) | 87.1 ± 3.6 | .36 | 10.6 ± 3.4 | .09 |
| Absent | 115 (57.5) | 91.3 ± 2.6 | 4.3 ± 1.9 | ||
| Favorable double trisomy† | |||||
| Positive | 49 (24.5) | 95.9 ± 2.8 | .099 | 2.0 ± 2.0 | .12 |
| Negative | 151 (75.5) | 87.4 ± 2.7 | 8.6 ± 2.3 | ||
| MRD at day 19 | |||||
| Undetectable | 171 (85.5) | 91.2 ± 2.2 | .059 | 5.3 ± 1.7 | .02 |
| Detectable, 0.001% to <0.01% | 29 (14.5) | 79.3 ± 7.5 | 17.2 ± 7.2 | ||
| L-asparaginase hypersensitivity | |||||
| No | 155 (77.5) | 88.4 ± 2.6 | .33 | 7.1 ± 2.1 | .91 |
| Yes | 45 (22.5) | 93.3 ± 3.7 | 6.7 ± 3.8 |
No patient had CNS 2 disease at diagnosis.
Trisomy of chromosomes 4 and 10.

Outcomes in children with acute lymphoblastic leukemia who received reduced-intensity therapy. (A) Relapse-free survival according to MRD levels on day 19; (B) cumulative incidence of relapse according to MRD levels on day 19.
Outcomes in children with acute lymphoblastic leukemia who received reduced-intensity therapy. (A) Relapse-free survival according to MRD levels on day 19; (B) cumulative incidence of relapse according to MRD levels on day 19.
Treatment delivery
For most patients, therapy was successfully delivered as planned, usually in an outpatient setting. With regard to induction therapy, 100% of planned doses of prednisone and E coli asparaginase, 99% of planned doses of vincristine, and 84% of planned doses of doxorubicin were delivered. The second dose of doxorubicin on day 12 was omitted if patients were acutely ill and/or had grade 3 or 4 mucositis, a white blood cell (WBC) count <1.0 × 10⁹/L, or a neutrophil count <0.3 × 10⁹/L and no circulating blasts. With regard to consolidation treatment, 100% of HDMTX courses and 93% of mercaptopurine doses were administered. In reinduction therapy, 97% to 99% of planned doses of dexamethasone, vincristine, and E coli asparaginase were delivered, followed by 100% of planned doses of HDMTX and 94% of planned doses of mercaptopurine. In continuation therapy, 95% of methotrexate and mercaptopurine doses were delivered. In pulse therapy, 98% of planned doses of dexamethasone and vincristine were delivered. Only 2 patients (1%) did not receive all of the planned intrathecal doses.
Toxicity
Treatment was generally well tolerated. During induction therapy, all patients developed neutropenia (WBC count <1.0 × 10⁹/L or absolute neutrophil count <0.3 × 10⁹/L). The duration of neutropenia was 1 to 31 days (mean and median, 13.5). Table 3 summarizes relevant events during the induction phase. Fever and/or infection at presentation and/or during early therapy were the most common complications. Three patients died before experiencing CR as a result of multiple infectious complications. The onset of infection in these patients occurred on days 10, 1, and 9, and death occurred on days 29, 32, and 33, respectively, after prolonged periods of neutropenia. The early death rate was 1.5%.
Events during induction therapy
| Event | Patients, n | % |
|---|---|---|
| Fever at presentation | 75 | 37.5 |
| Presumptive site of infection | ||
| Lung (pneumonia) | 10 | 5.0 |
| Skin (cellulitis) | 3 | 1.5 |
| Bone (osteomyelitis) | 1 | 0.5 |
| Viral infection (hepatitis A, varicella) | 2 | 1.0 |
| Gastrointestinal tract (colitis, gastroenteritis) | 3 | 1.5 |
| Fever and/or infection during induction | 135 | 67.5 |
| Presumptive site of infection | ||
| Lung (pneumonia) | 23 | 11.5 |
| Skin (cellulitis) | 9 | 4.5 |
| Central venous catheter | 2 | 1.0 |
| Perianal region | 4 | 2.0 |
| Gastrointestinal tract | 8 | 4.0 |
| Urinary tract | 1 | 0.5 |
| Bacteremia | ||
| At presentation | 11 | 5.5 |
| During induction | 50 | 25.0 |
| Fungal infection (suspected pulmonary and/or sinus) (median time, 16 days; range, 1-30) | 18 | 9.0 |
| Thrombosis | ||
| Cerebral | 2 | 1.0 |
| Deep venous thrombosis | 1 | 0.5 |
| Pancreatitis | 3 | 1.5 |
| Hypertension | 3 | 1.5 |
| Mucositis grade 3 | 5 | 2.5 |
| Seizures | 2 | 1.0 |
| Bleeding (pulmonary, melena, and hematuria) | 5 | 2.5 |
| Mortality (early deaths) | 3 | 1.5 |
A total of 784 courses of HDMTX with leucovorin rescue was delivered during consolidation therapy, and 42-hour high levels of serum methotrexate (range, 2-17 μmol/L; median, 4) were detected in 40 courses (5.1%). Delayed methotrexate clearance (median, 9 days; range, 6-12) was observed in 38 courses (4.8%), 27 of which were the first HDMTX course. Febrile neutropenia was seen in 26 courses (3.3%), and grade 3 or 4 mucositis was seen in 8 courses (1%).
During reinduction therapy, 49 of 196 patients (25%) developed neutropenia, with a median recovery time of 5.5 days (range, 2-10). Pulmonary infections developed in 11 patients (5.6%), and varicella and herpes zoster developed in 2 patients (1%). E coli asparaginase hypersensitivity (local reaction, rash, or fever) occurred in 45 patients (22.9%), but in most cases this was managed by administering steroid premedication to be able to continue asparaginase. One of the 3 patients who died in remission died at home, most likely as a result of septic shock, on day 7 of reinduction therapy.
With the exception of 3 patients (1.5%) who developed neurotoxicity (seizures) during maintenance chemotherapy, the maintenance therapy was well tolerated overall and was not associated with unexpected toxicity. No patient developed symptomatic osteonecrosis. All treatment-related deaths were due to infectious complications (n = 5): 3 during induction, 1 during early remission, and 1 during reinduction therapy. Altogether, the cumulative risk of toxic death was 2.5% (95% CI, 0.9-5.4%), calculated using the competing-risk approach.
There were significantly fewer toxic deaths among the VLR patients in our study than among the 309 patients provisionally classified as low-risk patients who were not eligible for the VLR protocol and who were treated with institutional standard treatment (Total Therapy XV). Toxic death occurred in 9 of the 309 patients (2.9%) during induction and in 14 patients (4.5%) in remission, with a cumulative incidence of 7.6% (95% CI, 5-11%; P = .017).
Discussion
Our study revealed that ∼40% of children provisionally classified as having low-risk B-progenitor ALL had MRD < 0.01% on day 19 of induction therapy and had excellent outcomes when treated with a low-intensity antimetabolite-based chemotherapy protocol. Our results corroborate and expand those of a previous study that used the same stratification criteria and treatment approach.13 The concern that reducing the treatment intensity would increase the relapse rate and offset the potential beneficial effect on survival was not substantiated. CIR, treatment-related mortality, and 5-year survival in our study were comparable to those reported for children treated with contemporary international protocols.21-23
Compared with standard treatment regimens used for low-risk ALL, the regimen used in our study included a lower cumulative dose of anthracyclines and eliminated early intensification (with cyclophosphamide, cytarabine, and mercaptopurine) and the second reinduction (late intensification) (Table 4). For example, the Malaysia-Singapore ALL 2003 regimen omitted anthracycline but substituted dexamethasone for prednisone in induction; it included cyclophosphamide (2000 mg/m2) plus cytarabine and 6-mercaptopurine in early intensification; and it included doxorubicin, cyclophosphamide, cytarabine, and thioguanine in late intensification. Patients who were considered to have low-risk ALL had a 6-year EFS of 93.2% ± 4.1% and a 6-year OS of 95.4% ± 3.3%.21 In the UKALL 2003 trial, patients classified as being in the National Cancer Institute (NCI) standard risk (SR) group and having undetectable MRD or MRD <0.01% at the end of the induction and that became undetectable by week 11 (671/1816 patients; 36.9%) had a 5-year EFS of 94.0%. Half of these low-risk patients were randomized to receive 1 delayed intensification course; there was no difference in EFS according to whether patients did or did not receive the intensification.22 The Dutch Childhood Oncology Group ALL10 study (protocol IV) selected patients with ALL who had negative MRD at the end of induction remission and intensification (protocol IB) to receive an abbreviated reinduction phase. The outcomes of the 198 selected cases (25% of the total) were excellent; however, the intensity of induction and consolidation in this trial was much higher than used in our protocol.23
Outcomes of children with low-risk ALL receiving MRD-guided deintensified therapy
| ALL trial, participating countries | Patients, n | Induction phase | Reinduction phase | Dexamethasone cumulative dose, mg/m2 | Anthracyclines cumulative dose, mg/m2 | Alkylating agents cumulative dose, mg/m2 | HDMTX cumulative dose, g/m2 | Maintenance duration | 5-y EFS/OS, % |
|---|---|---|---|---|---|---|---|---|---|
| UKALL 2003; UK & Ireland22 | 260* | 3 drugs | 1 | 1388 | 75 | 1000 | None | 2-3 years | 94.4/97.9 |
| Egypt VLR ALL 2011; Egypt† | 200 | 4 drugs | 1 | 546 | 50 | None | 12.5 | 104 weeks | 89.5/95.5 |
| Ma-Spore 2003, Malaysia & Singapore21 | 172 | 3 drugs | 2 | 700 | 120 | 3000 | 8.0 | 104 weeks | 93.2/95.4 |
| DCOG ALL 10; The Netherlands23 | 194 | 7 drugs | 1 | 150 | 120 | 2000 | 20.0 | 104 weeks | 93.1/99 |
Data for patients in the treatment arm receiving only 1 course of reinduction.
Current study.
The clearance of leukemia cells has been considered the most important prognostic indicator in ALL.24 Two techniques, polymerase chain reaction amplification of immunoglobulin/T-cell receptor gene rearrangements and flow cytometry, have been commonly used to measure MRD. Although less sensitive, flow cytometry MRD assays are faster, simpler, less expensive, and more broadly available than polymerase chain reaction–based assays. A simplified flow cytometric MRD assay with a sensitivity of 0.01% when performed early in remission induction has been developed,14 and it has been effectively implemented in countries with limited resources.25 The clinical significance of the presence of residual leukemia at different time points during ALL treatment appears to vary. At early time points (induction days 8, 15, and 19), MRD values are associated with long-term survival and can potentially be used to identify patients with a rapid response to therapy who might be treated with limited-intensity therapy. The predictive impact of MRD also varies depending on the leukemia genotype.26 In the St Jude Total XV study, in patients meeting the NCI SR criteria with day-19 MRD < 0.01%, the CIRs were 1.9% for patients with ETV6-RUNX1, 3.8% for those with hyperdiploidy of >50 chromosomes, and 9.5% for those with other NCI SR B-cell ALL.27 The interaction between MRD and genotype is also seen in patients treated with low-intensity chemotherapy. Children’s Oncology Group investigators reported that a subset of 261 of 827 patients (31.6%), defined by meeting the criteria for NCI SR, having double trisomies of chromosomes 4 and 10 or ETV6-RUNX1, and having flow cytometric MRD ≤ 0.01% in day-8 peripheral blood and day-29 bone marrow (COG P9904), had a 5-year EFS of 97% ± 1% when treated with a nonintensive antimetabolite-based therapy.28 Patients with neither of the genetic features but who had the same MRD characteristics had a significantly lower 5-year EFS (92% ± 3%; P < .02). In our study, patients meeting NCI SR criteria, with or without favorable genetic features and day-19 MRD <0.01%, had a 5-year EFS of 89%, an OS of 95%, and a CIR of 7%. Moreover, we revealed that the CIR was significantly higher in patients with MRD levels between 0.001% and <0.01%. Our results expand the evidence that evaluating MRD at early time points can identify patients who are at low risk for relapse after treatment with antimetabolite-based therapy, and they suggest that MRD levels as low as 0.001% are associated with higher relapse rates among children treated with low-intensity therapy. These observations suggest opportunities to refine the stratification of children with ALL who can be cured with low-intensity regimens, along with strategies to integrate alternative less toxic therapies, such as immunotherapy, into nonintensive antimetabolite-based regimens.
The results of our study also have important implications for treating ALL in low- to middle-income countries (LMICs). Intensification of ALL therapy, which is associated with the high cure rates seen in high-income countries (HICs), has had minimal impact on ALL outcomes in LMICs because of treatment-related mortality (TRM).29-33 Many centers in LMICs with adequate infrastructure typically adopt the treatment protocols used in HICs. In the ALL Intercontinental Berlin–Frankfurt–Munster 2002 (IC-BFM 2002) trial34 conducted in 15 middle-income countries, disease control was similar to that in patients in HICs, but TRM was considerably higher. It is also possible that factors that tend to be more prevalent in LMICs than in HICs, such as poverty, lower education levels, and a higher proportion of the population residing in rural vs urban areas, negatively affect ALL treatment. For example, CCHE has diagnostic and treatment capabilities similar to those of most centers in HICs and has managed the treatment of patients with ALL using guidelines based on the St Jude Total XV protocol.15 However, the incidence of early death was 4.4% for CCHE35 vs 0.4% for St Jude Children’s Research Hospital, and the incidence of death during CR was 6.8% and 2.4%, respectively. Another important contribution of our study is the validation of the simplified flow cytometric assay to evaluate MRD after 2.5 weeks of remission-induction therapy.14 Because the flow cytometry laboratory at CCHE is equipped to measure MRD by a standard assay, we were able to compare the results measured by the simplified MRD assay with those measured by the standard flow cytometric MRD assay on day 19 and at the end of induction. Only 1 of the patients with day-19 MRD < 0.01%, as measured by the simplified assay, was found to be MRD positive at the end of induction when their MRD was measured by the standard MRD assay, indicating that day-19 MRD < 0.01% measured by the simplified assay is highly correlated with MRD < 0.01% measured by the standard assay at the end of induction. Limitations of the simplified assay are that it cannot be used to evaluate residual disease after remission induction and that not all samples can be assessed on day 19 because of insufficient cellularity. Finally, detecting residual disease <0.01% requires analytical expertise and alternative validation methods to avoid misinterpretation resulting from variations in the assay and/or sampling. Despite these limitations, monitoring for early response to therapy using the simplified MRD assay is strongly recommended for laboratories in LMICs.
Another important aspect of this study was the constant collegial dialogue between investigators from St Jude’s Children’s Research Hospital and CCHE through Web conferences for each patient enrolled in the treatment protocol, which focused on patient eligibility, early response to therapy, and treatment complications.
In summary, our study expands the evidence that children who have a rapid and profound response to ALL induction chemotherapy at an early time point can be cured with a low-intensity therapy regimen. The approach described herein is an option to consider in settings in which TRM hinders cure rates and where effective, but less complex therapy, is needed. Further studies are necessary to address the management of cases with detectable MRD levels <0.01% at early time points.
Data sharing requests should be sent to Raul C. Ribeiro (raul.ribeiro@stjude.org).
The publication costs of this article were defrayed in part by page charge payment. Therefore, and solely to indicate this fact, this article is hereby marked “advertisement” in accordance with 18 USC section 1734.
Acknowledgements
The authors thank Susana Raimondi for reviewing the complex cytogenetic studies, Sima Jeha for leadership efforts at the initiation of the study, and May Amer for assisting with data collection. The authors also thank Vani Shanker and Keith A. Laycock for editing the manuscript.
G.K.R. was funded in part by National Institutes of Health (NIH)/National Cancer Institute (NCI) grant CA21765, the American Lebanese and Syrian Associated Charities, and the Department of Global Pediatric Medicine, St Jude Children’s Research Hospital. R.C.R. was funded in part by NIH/NCI grant CA21765, the American Lebanese and Syrian Associated Charities, and the Department of Oncology, St Jude Children’s Research Hospital.
The content is solely the responsibility of the authors and does not necessarily represent the official views of the NIH.
Authorship
Contribution: G.K.R., R.C.R., I.S., and E.C.-S. conceptualized and developed the study; I.S., K.S., N.A., S.G., S. Salem, S. Soliman, D.Y., and S.H.Y. provided study materials or patients; I.S., S.H.Y., N.A., S.G., W.M.R., M.M., and E.M. collected and assembled data; I.S., G.K.R., R.C.R., E.C.-S., K.S., S.H.Y., N.A., and S.G. analyzed and interpreted data; I.S., G.K.R., and R.C.R. wrote the manuscript; and all authors except K.S. (deceased) revised and gave final approval for the manuscript and are accountable for all aspects of the work.
Conflict-of-interest disclosure: The authors declare no competing financial interests.
Khaled Shabaan died on 18 June 2017.
Correspondence: Raul C. Ribeiro, Departments of Oncology and Global Pediatric Medicine, St Jude Children’s Research Hospital, 262 Danny Thomas Pl, Memphis, TN 38105; e-mail: raul.ribeiro@stjude.org.

This feature is available to Subscribers Only
Sign In or Create an Account Close Modal