

Key Points
Multispecies spatial transcriptomics identify the hematopoietic stem cell supportive molecular landscape of the embryonic aorta.
ADM, RAMP2, and SVEP1 are conserved hematopoietic stem cell regulators in the embryonic aorta.

Abstract
The defined location of a stem cell within a niche regulates its fate, behavior, and molecular identity via a complex extrinsic regulation that is far from being fully elucidated. To explore the molecular characteristics and key components of the aortic microenvironment, where the first hematopoietic stem cells are generated during development, we performed genome-wide RNA tomography sequencing on zebrafish, chicken, mouse, and human embryos. The resulting anterior-posterior and dorsal-ventral transcriptional maps provided a powerful resource for exploring genes and regulatory pathways active in the aortic microenvironment. By performing interspecies comparative RNA sequencing analyses and functional assays, we explored the complexity of the aortic microenvironment landscape and the fine-tuning of various factors interacting to control hematopoietic stem cell generation, both in time and space in vivo, including the ligand-receptor couple ADM-RAMP2 and SVEP1. Understanding the regulatory function of the local environment will pave the way for improved stem cell production in vitro and clinical cell therapy.
Introduction
The constant production of short-lived hematopoietic cells throughout life relies on hematopoietic stem cells (HSCs).1 Defects in HSCs lead to various blood-related disorders and cancers that are partly treated by HSC transplantations. Efforts have been made to generate bona fide HSCs in vitro, to circumvent the limited supply of donor-compatible HSCs for clinical use. Despite progress,2-4 HSC culture protocols are suboptimal in mimicking the HSC surrounding microenvironment or niche, which is needed to induce HSC formation and to preserve HSC properties. A better knowledge of the regulatory factors and pathways involved in HSC formation in vivo is therefore important and is necessary to improve in vitro culture protocols and HSC engineering.5,6
HSCs are initially generated during embryonic development.7-9 They derive from hemogenic endothelial cells, via an endothelial to hematopoietic transition (EHT), in the aorta of the aorta-gonad-mesonephros (AGM) region of vertebrate embryos.10-18 The mechanism of HSC emergence is highly conserved and regulated in both time and space, with few species-specific differences.7 Although HSC generation is polarized and restricted to the ventral side of the aorta in chicken, zebrafish, and human embryos, EHT also occurs in the dorsal part of the aorta in mouse embryos (although to a lesser extent).6,17,19-23 HSCs are generated through the formation of intra-aortic hematopoietic clusters in chicken, mouse, and human embryos, but not in zebrafish where single cells emerge underneath the aorta.17,21,22,24 HSC production is also temporally regulated, starting at ∼26 hours post fertilization (hpf) with a peak at 40 hpf in zebrafish and at embryonic day (E)2.25, with a peak at E3 in the anterior portion of the chicken aorta.16,17,21 Cluster emergence occurs from days 27 to 42 in the middle portion of the aorta in human embryos.6,19,22,25 Similarly, emergence starts at E9.5 in the mouse aorta with cluster number and HSC activity peaking at E10.5 and E11.5, respectively.11,20
The spatiotemporal restriction of hematopoietic emergence clearly indicates the presence of specific molecular cues in the surroundings of the aorta at defined locations and time points, instructing the aortic hemogenic endothelium and driving EHT and HSC production. How the AGM niche regulates these essential processes in vivo is still poorly understood. HSC regulation by extrinsic signals is indeed a complex process that occurs via direct cell-cell contact or long-range distribution of secreted molecules, acting directly or by inducing secondary signals.26 Our knowledge relies on the knockdown of specific ligands/receptors, in vitro experiments (eg, coculture of mouse and human HSCs with AGM-derived stromal cell lines and AGM explant culture with selected growth factors) and transcriptional comparison of supportive and less supportive stromal cell lines.27-29 Several important factors and signaling pathways regulating HSC generation, survival, and/or maturation in the AGM niche have been identified.28,30-36
RNA tomography (tomo‐seq) was developed to provide spatially resolved transcriptomics, meaning information about any gene expressed along a predetermined axis of a whole tissue or embryo and at a precise time point of tissue isolation or embryonic development.37 This powerful approach, which combines cryosectioning and low-input RNA sequencing, enabled generation of a high‐resolution genome‐wide atlas of gene expression patterns in the zebrafish embryo.37 We performed tomo-seq on embryos of the 4 different species classically used to study developmental hematopoiesis (ie, chicken, zebrafish, mouse, and human). Whole embryos and/or transverse sections were collected along the anterior-posterior and/or dorsal-ventral embryo axes at the developmental time points of HSC production. We generated spatial gene expression maps to investigate the molecular regulation of HSC generation in the embryonic aorta. To create a more in-depth analysis between the niche and HSCs, we combined our AGM microenvironment tomo-seq data sets with cluster data sets (from mouse35 and chicken [present study] embryos). This approach led to the identification of the ligand-receptor interactions that are active between the aortic microenvironment and clusters. With our data, we unraveled a novel conserved extrinsic HSC regulator, ADM and its receptor RAMP2, that we functionally validated in vivo. We also identified SVEP1 as the first extrinsic regulator of both cluster cellularity and cluster cell fate toward an HSC fate reported thus far. Overall, our findings emphasize the complexity of the aortic microenvironment landscape at the time of HSC formation and provides insights into the fine-tuning of various factors interacting to control HSC production in both time and space as it occurs in vivo.
Methods
Embryo generation
Human embryos and embryonic tissues were obtained from the Cupedo laboratory (Erasmus MC, Rotterdam, The Netherlands) and Chuva de Sousa Lopes laboratory (Leiden University Medical Center [LUMC], Leiden, The Netherlands). The Medical Ethics Committee of LUMC (P08.087) approved all procedures regarding the collection and use of human embryonic tissue. The gestational age was calculated from the crown-rump length of the fetus (before medical procedure by obstetric ultrasonography). Human fetal tissues were donated for research with informed consent from elective abortions without medical indication. The Medical Ethics Committee of the Erasmus MC approved the use of human embryonic and fetal tissues (fetal liver and bone marrow). Samples were used to titrate human antibodies and in situ hybridization probes. The use of these human tissues was contingent on informed consent in accordance with the Dutch Fetal Tissue Act. Fetal tissues were obtained from elective abortions, and informed consent was obtained after the decision to abort was finalized.
Details for animal housing, procedures, use of laboratory animal approvals, and embryo generation are in supplemental Methods, available on the Blood Web site.
Analyses and procedures
Whole embryo collection, embryo dissection, and embryo slicing
Embryos and embryo slices were prepared, as previously described15,38 (supplemental Methods).
RNA tomography
Sample preparation for tomo-sequencing (tomo-seq) and sequencing libraries preparation were performed as described in Junker et al37 (supplemental Methods).
Sample orientation and cryosection thicknesses are provided in supplemental Table 1.
Filtering strategies
Filtering strategies applied to determine gene expression in chicken, human, mouse, and zebrafish (ventral) aortic environments are detailed in supplemental Methods.
Wholemount embryo, thick embryo slice, and human paraffin-embedded section immunostaining
Whole embryo and thick slices were prepared and stained, as previously described15,20 (supplemental Methods).
Wholemount in situ hybridization
Primers used for partial coding sequence amplification are listed in supplemental Table 2.
Microinjections of morpholinos in zebrafish embryos
Sequences (supplemental Table 3) and concentrations used for each morpholino (MO) and MO knockdown validation are in supplemental Methods.
Quantitative real-time PCR
Protocols and primer sequences are in supplemental Methods and supplemental Table 4, respectively.
Flow cytometry analysis and cell sorting
Chicken cluster cells were stained by injecting phycoerythrin anti-CD45 directly inside the aorta (as described in Boisset et al.15 and supplemental Methods).
Secretomics analysis
The annotation between ligand and receptor was downloaded from FANTOM5 (Functional Annotation of the Mammalian Genome).39 The protein-protein interaction network was visualized by STRING (Search Tool for the Retrieval of Interacting Genes/Proteins; supplemental Methods).
Results
Molecular landscape of the (ventral) aortic microenvironment in human, chicken, mouse, and zebrafish embryos
To study the molecular landscape of the aortic microenvironment where cluster and hematopoietic stem and progenitor cell (HSPC) emergence is spatially restricted, we focused on the 4 species most frequently used to study developmental hematopoiesis: chicken, human, mouse, and zebrafish (Figure 1A-D). For tomo-seq, we collected samples from the different species at the time points of HSC production, (1) E3 chicken embryo slices, (2) 35-day-old human embryo slices, (3) E10.5 and E11.5 mouse embryo slices, and (4) 28- and 40-hpf whole zebrafish embryos and trunks (including the aorta and yolk sac elongation) (supplemental Table 1; supplemental Figure 1A-B). To confirm the presence of cluster cells and HSPCs in the aorta at the indicated time points and location,6,17,19-23 we performed immunostainings on slices that were adjacent to the ones collected for tomo-seq (ventral cluster cells in chicken [MEP21+CD45+RUNX1+; Figure 1E] and human [CD34+CD45+RUNX1+; Figure 1F], ventral and dorsal (arrows) cluster cells in mouse [CD31+KIT+; Figure 1G], and single HSPCs in zebrafish [Kdrl+cd41+; Figure 1H-I] were observed). All thick slices and trunks (Figure 1J-L,N) were cryosectioned along the dorsal-ventral axis, whereas whole embryos (Figure 1M) were cryosectioned along the anterior-posterior axis of the embryo, and all cryosections were then processed for tomo-seq (supplemental Figure 1A-B; supplemental Tables 5-8).
![Tomo-seq allows the identification of specific gene expression patterns restricted to the (ventral) aortic microenvironment. (A-D) Schemes of the embryo species (top panels) and samples (bottom panels) used for tomo-seq analyses. E3 chicken anterior slices (A), 35-day-old human slices (B), E10.5 and E11.5 mouse slices (C), 28- and 40-hpf whole zebrafish embryos (D, left panel), and 28- and 40-hpf zebrafish trunks (D, right panel). The red areas mark the (ventral) aortic region where cluster and HSC emergence occurs. (E-G) Immunostainings of chicken (E), human (F), and mouse (G) embryo slices showing the location of clusters in the aorta. (E) Thick transverse slice of an E3 chicken embryo (slice adjacent to the one used for tomo-seq) stained with anti-MEP21 (red), anti-CD45 (green), and anti-RUNX1 (blue) antibodies. (F) Aorta of human embryo slice 1 stained with anti-CD34 (red), anti-CD45 (green), and anti-RUNX1 (white) antibodies and 4′,6-diamidino-2-phenylindole (blue). (G) Aorta of an E10.5, thick mouse embryo slice stained with anti-CD31 (red) and anti-KIT (green) antibodies. Arrows, dorsal clusters. (H) Global view of a Tg(kdrl:mCherry;cd41:eGFP) reporter zebrafish embryo at 40 hpf; mCherry fluorescence highlights the whole vasculature, GFP fluorescence highlights HSPCs. (I) Trunk region containing the aortic region and yolk sac elongation of the 40-hpf zebrafish embryo shown in panel H (dashed boxed). Single fluorescent pictures (right panels). (J-L) Thick slices from E3 chicken (J), 35 day-old human (K), and E11.5 mouse (L) embryos used for tomo-seq. (M) Whole 40-hpf zebrafish embryo used for tomo-seq. (N) Dissected trunk region of a 40-hpf zebrafish embryo used for tomo-seq. (O) Tomo-seq traces for MPL (red) and SHH (black) along the dorsal-ventral axis of the E3 chicken embryo slice shown in panel J. Colored areas corresponding to the ventral part of the aorta (R1, red) or to the dorsal part of the aorta (R2, blue). The numbers on the x-axes of z-score plots represent sequential individual section numbers (in O,R-S,V,X). (P-Q) ISH for MPL (P) and SHH (Q) on transverse sections of E3 chicken embryo, showing the restricted expression of MPL and SHH to clusters and notochord, respectively. Dashed boxed areas are enlarged in the right panels. (R) Tomo-seq traces for BMP4 (blue), GATA2 (red), and WWP2 (black) along the dorsal-ventral axis of human embryo slice 1, shown in panel K. Colored areas corresponding to the ventral part of the aorta (R1, red) or to the dorsal part of the aorta (R2, blue). (S) Tomo-seq traces for Gata2 (red), Bmp4 (blue), and Shh (black), along the dorsal-ventral axis of the E11.5 mouse embryo slice shown in panel L. Colored areas corresponding to the aortic region (R1, red) or to the regions flanking the aorta (R2 and R3, blue). (T-U) ISH for Bmp4 (T) and Gata2 (U) on E11.5 mouse embryo transverse sections. Dashed boxed areas are enlarged in the right panels. (V) Tomo-seq traces for pax6a (blue), nkx2.1a (green), hoxc11a (black), and apoa1a (red) along the posterior-anterior axis of the 40-hpf zebrafish embryo shown in panel M. (W) WISH showing the expression patterns of pax6a, nkx2.1a, and hoxc11a in 40-hpf zebrafish embryos. (X) Tomo-seq traces for apoa1a (blue), shha (black), and cxcl12b (red) along the dorsal-ventral axis of the 40-hpf zebrafish embryo trunk shown in N. Red area (R1): slices corresponding to the yolk sac elongation region (including the aorta) (V) or the aortic region (X). Blue areas (R2 and R3): slices corresponding to regions flanking the aorta region. (Y) WISH showing the expression patterns of apoa1a, shha, and cxcl12b in 40-hpf zebrafish embryos (left panels). Dashed boxed areas (trunk regions) are enlarged in the middle panels. Embryos were cryosectioned post-ISH to show the expression pattern of apoa1a, shha, and cxcl12b along the dorsal-ventral axis of the embryo trunks (right panels). The total number of embryos analyzed for WISH is indicated on the pictures. A, anterior; Ao, aorta; D, dorsal; Nc, notochord; NT, neural tube; Me, mesonephros; P, posterior; R, region; V, ventral; YS, yolk sac; YSe, yolk sac elongation. Bars represent 50 μm (E-G,Y [right panels]), 100 μm (J,P-Q), 150 μm (L,T-U), and 200 μm (H,K,M,W,Y [left panels]).](https://ash.silverchair-cdn.com/ash/content_public/journal/blood/136/7/10.1182_blood.2019004446/3/m_bloodbld2019004446f1.png?Expires=1764998765&Signature=MneXkoOQeohOvUCd7jDtiYkYt30UNZEUEi-aTnmRg5nplH4imtsR3hLXfL-8dYlldrCFPabvh6KkjUEHfTxLAd05ELHQ8b9RJAyYxwnppotjj4GESeRUjeuQrICiFjpv4iiNYsqzccKug625GHo99IM~LJT4Z-a4xjF4dD5eKMTX9prVDsO4gFJTACt41huW22VaZ5WWqvPm~ILBUjZc~ek3rTzBKcgog4tNvc3lzJUvgn4Dyga10IVKbu9bXzBM~TYrKIRVF9kwtu-8lv5Ov1uHaHyU7FTBKc3J1vVf9dBaDqV0xwOSgpeOis5cbwZaALGhScR8ubYOHZCwZwGttA__&Key-Pair-Id=APKAIE5G5CRDK6RD3PGA)
Tomo-seq allows the identification of specific gene expression patterns restricted to the (ventral) aortic microenvironment. (A-D) Schemes of the embryo species (top panels) and samples (bottom panels) used for tomo-seq analyses. E3 chicken anterior slices (A), 35-day-old human slices (B), E10.5 and E11.5 mouse slices (C), 28- and 40-hpf whole zebrafish embryos (D, left panel), and 28- and 40-hpf zebrafish trunks (D, right panel). The red areas mark the (ventral) aortic region where cluster and HSC emergence occurs. (E-G) Immunostainings of chicken (E), human (F), and mouse (G) embryo slices showing the location of clusters in the aorta. (E) Thick transverse slice of an E3 chicken embryo (slice adjacent to the one used for tomo-seq) stained with anti-MEP21 (red), anti-CD45 (green), and anti-RUNX1 (blue) antibodies. (F) Aorta of human embryo slice 1 stained with anti-CD34 (red), anti-CD45 (green), and anti-RUNX1 (white) antibodies and 4′,6-diamidino-2-phenylindole (blue). (G) Aorta of an E10.5, thick mouse embryo slice stained with anti-CD31 (red) and anti-KIT (green) antibodies. Arrows, dorsal clusters. (H) Global view of a Tg(kdrl:mCherry;cd41:eGFP) reporter zebrafish embryo at 40 hpf; mCherry fluorescence highlights the whole vasculature, GFP fluorescence highlights HSPCs. (I) Trunk region containing the aortic region and yolk sac elongation of the 40-hpf zebrafish embryo shown in panel H (dashed boxed). Single fluorescent pictures (right panels). (J-L) Thick slices from E3 chicken (J), 35 day-old human (K), and E11.5 mouse (L) embryos used for tomo-seq. (M) Whole 40-hpf zebrafish embryo used for tomo-seq. (N) Dissected trunk region of a 40-hpf zebrafish embryo used for tomo-seq. (O) Tomo-seq traces for MPL (red) and SHH (black) along the dorsal-ventral axis of the E3 chicken embryo slice shown in panel J. Colored areas corresponding to the ventral part of the aorta (R1, red) or to the dorsal part of the aorta (R2, blue). The numbers on the x-axes of z-score plots represent sequential individual section numbers (in O,R-S,V,X). (P-Q) ISH for MPL (P) and SHH (Q) on transverse sections of E3 chicken embryo, showing the restricted expression of MPL and SHH to clusters and notochord, respectively. Dashed boxed areas are enlarged in the right panels. (R) Tomo-seq traces for BMP4 (blue), GATA2 (red), and WWP2 (black) along the dorsal-ventral axis of human embryo slice 1, shown in panel K. Colored areas corresponding to the ventral part of the aorta (R1, red) or to the dorsal part of the aorta (R2, blue). (S) Tomo-seq traces for Gata2 (red), Bmp4 (blue), and Shh (black), along the dorsal-ventral axis of the E11.5 mouse embryo slice shown in panel L. Colored areas corresponding to the aortic region (R1, red) or to the regions flanking the aorta (R2 and R3, blue). (T-U) ISH for Bmp4 (T) and Gata2 (U) on E11.5 mouse embryo transverse sections. Dashed boxed areas are enlarged in the right panels. (V) Tomo-seq traces for pax6a (blue), nkx2.1a (green), hoxc11a (black), and apoa1a (red) along the posterior-anterior axis of the 40-hpf zebrafish embryo shown in panel M. (W) WISH showing the expression patterns of pax6a, nkx2.1a, and hoxc11a in 40-hpf zebrafish embryos. (X) Tomo-seq traces for apoa1a (blue), shha (black), and cxcl12b (red) along the dorsal-ventral axis of the 40-hpf zebrafish embryo trunk shown in N. Red area (R1): slices corresponding to the yolk sac elongation region (including the aorta) (V) or the aortic region (X). Blue areas (R2 and R3): slices corresponding to regions flanking the aorta region. (Y) WISH showing the expression patterns of apoa1a, shha, and cxcl12b in 40-hpf zebrafish embryos (left panels). Dashed boxed areas (trunk regions) are enlarged in the middle panels. Embryos were cryosectioned post-ISH to show the expression pattern of apoa1a, shha, and cxcl12b along the dorsal-ventral axis of the embryo trunks (right panels). The total number of embryos analyzed for WISH is indicated on the pictures. A, anterior; Ao, aorta; D, dorsal; Nc, notochord; NT, neural tube; Me, mesonephros; P, posterior; R, region; V, ventral; YS, yolk sac; YSe, yolk sac elongation. Bars represent 50 μm (E-G,Y [right panels]), 100 μm (J,P-Q), 150 μm (L,T-U), and 200 μm (H,K,M,W,Y [left panels]).
Tomo-seq allows the identification of specific gene expression patterns restricted to the (ventral) aortic microenvironment. (A-D) Schemes of the embryo species (top panels) and samples (bottom panels) used for tomo-seq analyses. E3 chicken anterior slices (A), 35-day-old human slices (B), E10.5 and E11.5 mouse slices (C), 28- and 40-hpf whole zebrafish embryos (D, left panel), and 28- and 40-hpf zebrafish trunks (D, right panel). The red areas mark the (ventral) aortic region where cluster and HSC emergence occurs. (E-G) Immunostainings of chicken (E), human (F), and mouse (G) embryo slices showing the location of clusters in the aorta. (E) Thick transverse slice of an E3 chicken embryo (slice adjacent to the one used for tomo-seq) stained with anti-MEP21 (red), anti-CD45 (green), and anti-RUNX1 (blue) antibodies. (F) Aorta of human embryo slice 1 stained with anti-CD34 (red), anti-CD45 (green), and anti-RUNX1 (white) antibodies and 4′,6-diamidino-2-phenylindole (blue). (G) Aorta of an E10.5, thick mouse embryo slice stained with anti-CD31 (red) and anti-KIT (green) antibodies. Arrows, dorsal clusters. (H) Global view of a Tg(kdrl:mCherry;cd41:eGFP) reporter zebrafish embryo at 40 hpf; mCherry fluorescence highlights the whole vasculature, GFP fluorescence highlights HSPCs. (I) Trunk region containing the aortic region and yolk sac elongation of the 40-hpf zebrafish embryo shown in panel H (dashed boxed). Single fluorescent pictures (right panels). (J-L) Thick slices from E3 chicken (J), 35 day-old human (K), and E11.5 mouse (L) embryos used for tomo-seq. (M) Whole 40-hpf zebrafish embryo used for tomo-seq. (N) Dissected trunk region of a 40-hpf zebrafish embryo used for tomo-seq. (O) Tomo-seq traces for MPL (red) and SHH (black) along the dorsal-ventral axis of the E3 chicken embryo slice shown in panel J. Colored areas corresponding to the ventral part of the aorta (R1, red) or to the dorsal part of the aorta (R2, blue). The numbers on the x-axes of z-score plots represent sequential individual section numbers (in O,R-S,V,X). (P-Q) ISH for MPL (P) and SHH (Q) on transverse sections of E3 chicken embryo, showing the restricted expression of MPL and SHH to clusters and notochord, respectively. Dashed boxed areas are enlarged in the right panels. (R) Tomo-seq traces for BMP4 (blue), GATA2 (red), and WWP2 (black) along the dorsal-ventral axis of human embryo slice 1, shown in panel K. Colored areas corresponding to the ventral part of the aorta (R1, red) or to the dorsal part of the aorta (R2, blue). (S) Tomo-seq traces for Gata2 (red), Bmp4 (blue), and Shh (black), along the dorsal-ventral axis of the E11.5 mouse embryo slice shown in panel L. Colored areas corresponding to the aortic region (R1, red) or to the regions flanking the aorta (R2 and R3, blue). (T-U) ISH for Bmp4 (T) and Gata2 (U) on E11.5 mouse embryo transverse sections. Dashed boxed areas are enlarged in the right panels. (V) Tomo-seq traces for pax6a (blue), nkx2.1a (green), hoxc11a (black), and apoa1a (red) along the posterior-anterior axis of the 40-hpf zebrafish embryo shown in panel M. (W) WISH showing the expression patterns of pax6a, nkx2.1a, and hoxc11a in 40-hpf zebrafish embryos. (X) Tomo-seq traces for apoa1a (blue), shha (black), and cxcl12b (red) along the dorsal-ventral axis of the 40-hpf zebrafish embryo trunk shown in N. Red area (R1): slices corresponding to the yolk sac elongation region (including the aorta) (V) or the aortic region (X). Blue areas (R2 and R3): slices corresponding to regions flanking the aorta region. (Y) WISH showing the expression patterns of apoa1a, shha, and cxcl12b in 40-hpf zebrafish embryos (left panels). Dashed boxed areas (trunk regions) are enlarged in the middle panels. Embryos were cryosectioned post-ISH to show the expression pattern of apoa1a, shha, and cxcl12b along the dorsal-ventral axis of the embryo trunks (right panels). The total number of embryos analyzed for WISH is indicated on the pictures. A, anterior; Ao, aorta; D, dorsal; Nc, notochord; NT, neural tube; Me, mesonephros; P, posterior; R, region; V, ventral; YS, yolk sac; YSe, yolk sac elongation. Bars represent 50 μm (E-G,Y [right panels]), 100 μm (J,P-Q), 150 μm (L,T-U), and 200 μm (H,K,M,W,Y [left panels]).
To define our regions of interest within the tomo-seq data, we used the expression of genes restricted to specific tissues or cells. In chicken, the tomo-seq trace of MPL, whose expression is restricted to the cluster cells, precisely demarcated the ventral aortic region (Figure 1O, red area [R1] and Figure 1P). As expected, MPL transcripts were not detected in the dorsal region of the aorta where clusters were absent, a region delimited by SHH expression (Figure 1O, blue area [R2] and Figure 1Q; SHH is expressed by the notochord and floor plate). For the human, we processed 2 slices for tomo-seq (slice 1, Figure 1K; and slices 1 and 2, supplemental Figure 2A-B). Hierarchical clustering of gene expression traces validated the reproducibility of the tomo-seq technique because 3 similar clusters (I-III), with expression maximal along the dorsal-ventral axis, were observed in both slices (supplemental Figure 2C-D). Of note, an extra cluster (IV) was observed in slice 2, corresponding to the gut tissue that remained attached to this slice (supplemental Figure 2B-D). BMP4 and GATA2 traces were used to demarcate the ventral aortic region (Figure 1R; supplemental Figure 2E; red area [R1]). The WWP2 trace detected in the cryosections containing the notochord/sclerotome area delimited the dorsal region of the aorta (Figure 1R; supplemental Figure 2E; blue area [R2]). The traces of Bmp4 and Gata2 were also used for E10.5 and E11.5 mouse slices, where they were expressed in the middle part of the slices (Figure 1S-U; supplemental Figure 2F-G; red area [R1]). Since clusters are present in both dorsal and ventral sides of the aorta, we chose a larger region around the entire aorta to prevent the exclusion of any positive HSC regulators that could also be present in the dorsal side of the aorta. In zebrafish, we used specific gene expression patterns that clearly mark the different parts of the embryo, at both 28 and 40 hpf (Figure 1V,X; supplemental Figure 2H-L). For example, traces of pax6a/nkx2.1a, apoa1a, and hoxc11a indicated the cryosections containing the head, yolk sac, and tail in the whole embryo, respectively (Figure 1V-W; supplemental Figure 2K). Shha, cxcl12b, and apoa1a indicated the cryosections containing the dorsal (including notochord), middle (aorta), and ventral (yolk sac elongation) regions of the trunks, respectively (Figure 1X-Y; supplemental Figure 2L).
Our initial goal was to identify, with highest confidence, the genes expressed in the microenvironment and involved in HSPC emergence. To this end, we applied the most stringent filtering strategy possible to extract genes that were more highly expressed in the (ventral) aortic region (red region R1) than in the dorsal aortic region and/or the rest of the embryo (blue regions R2 and R3; Figure 1O,R-S,V,X; supplemental Figure 2E,G,K-L; see “Methods” for strategy details). We identified 990 genes and 1249 genes specifically upregulated in the ventral side of the chicken and human aorta, respectively (supplemental Tables 5 and 6; “ventral selection” sheets), and 229 and 448 genes in the mouse aortic region at E10.5 and E11.5, respectively (supplemental Table 7; “selection” sheet). Finally, we identified 645 and 276 genes for 28- and 40-hpf whole zebrafish embryos, and 147 and 199 genes for 28- and 40-hpf trunks, respectively (supplemental Table 8; “AP selection” and “DV selection” sheets). By using a comparative tomo-seq approach on 4 species, we were thus able to identify the genes that are expressed in the (ventral) aortic region of chicken, human, mouse, and zebrafish embryos (supplemental Tables 5-8, respectively). Further comparative molecular analysis of the selective genes is now possible to unravel exclusive or conserved regulators of HSPC emergence.
Species-restricted and interspecies gene expression, biological processes, and pathways in the aortic HSC supportive microenvironment
Comparative data analysis identified genes that were species restricted or common to 2 or more species (Figure 2A; supplemental Table 9). The goal of this strategy was to identify the genes most likely involved in HSC regulation and not to provide a complete account of all genes present in the aortic microenvironment. Consequently, only 3 genes (Podxl, Aldh1a2, and Ppargc1a) were found conserved among the 4 species, but strikingly, all of them had been reported as HSPC regulators.40-42 However, it is important to note that, because of potential false negatives caused by, for example, species-dependent differences in expression levels, we cannot rule out that the real overlap between the species is higher. These genes that nicely displayed tomo-seq traces in R1 (Figure 2B-F) were indeed expressed in the aortic region of all species. Podxl was expressed mainly in the mesonephros and ventral epithelium; Aldh1a2 was expressed on the lateral sides of the aorta, close to the cardinal veins and in the lateral epithelium; and Ppargc1a was detected weakly in the (ventral) aortic region (Figure 2G-J). Pathway analyses of genes that were at least common to more than 2 species revealed their involvement in cell proliferation, transcription, muscle, and mesonephros development (Figure 2K; supplemental Figure 3A). Some of these genes (Figure 2A) were either previously reported as being more highly expressed in HSPC embryonic supportive cell lines compared with non- or less-supportive stromal cell lines (in bold), connected to HSPC formation and/or regulation (in italics), connected to leukemia (marked with an asterisk), and/or involved in HSC generation and regulation in the embryonic aorta (underlined).28,36,43-46 In accordance, Kyoto Encyclopedia of Genes and Genomes (KEGG) pathway analysis highighted different pathways known to be important for EHT and/or HSC formation, such as WNT and TGF-β47,48 (Figure 2L; supplemental Figure 3B). Interestingly, the analysis of the Gene Ontology (GO) database biological process or KEGG pathways of each species revealed a high degree of similarity, particularly between chicken and human species (supplemental Figure 4 and 5). Overall, through a stringent filtering strategy, we identified the aortic gene landscape specific or common to multiple species that is most likely involved in the formation of the first HSCs during embryonic development.
![Comparative analysis of tomo-seq data sets identifies species-restricted and interspecies-conserved gene expression in the aortic HSC supportive microenvironment. (A) Venn diagram showing shared and distinct ventrally expressed genes between chicken, human, mouse, and zebrafish tomo-seq data sets. Genes in bold: upregulated (messenger RNA level) in HSPC supportive stromal cell line UG26.1B6 compared with the non-/less supportive stromal cell line UG26.3B5 isolated from the embryonic AGM (according to http://stemniche.snv.jussieu.fr/29); underlined: known HSPC regulators in the embryonic aorta. Italic denotes connected to hematopoiesis. *Connected to leukemia. (B-F) Tomo-seq traces for PODXL (blue), ALDH1A2 (green), and PPARGC1A (orange) in the (ventral) aortic region (R1) of an E3 chicken slice (B), a 35-day-old human slice (C), an E10.5 mouse slice (D), a 28-hpf whole zebrafish (E), and a 40-hpf zebrafish trunk (F). (G-J) ISH showing the specific expression patterns of PODXL, ALDH1A2, and PPARGC1A in the (ventral) aortic region (R1) of an E3 chicken anterior slice (G), a 35-day-old human slice (H), an E10.5 mouse slice (I), a 40-hpf whole zebrafish embryo (J, left panel), and a zebrafish trunk slice (J, right panel). The number of embryos analyzed for WISH is indicated on the pictures. (K-L) Ten of the top biological process GO terms (K) and most relevant KEGG pathways (L) enriched in at least 2 species tomo-seq data sets (ie, 2, 3, and 4 species data sets). Bars represent 150 μm (G,I-J [left panels]), 200 μm (H), and 50 μm (J [right panels]).](https://ash.silverchair-cdn.com/ash/content_public/journal/blood/136/7/10.1182_blood.2019004446/3/m_bloodbld2019004446f2.png?Expires=1764998765&Signature=ulBi1byTfjxef~iAENUCQnoa-Xlk-caqDsDf62vmE5P40F-SD~nydNJp3STdjff40rMrragmM-DPKK37d0YAssEAsJg5xbVLOsg9Pu~Do2lSvtXXtzzZzdsKrXZfU1SLoRdE43GVhgS5rCHF-u5pgRynHaIO8tRaCMShA7FU-F8RMpLolOvqfLSbqfAXsekccl5VhGD0P~mmEnsZGl1RSkP0ypSGqD4TXEfXoa~3zSMsPsJSJZx7Gb5ND4SmV7of16EhyFiT7Pi0KaRHnuM9EminpfnwmxgRKwZRGGmkZFKZLEBFIoy1EQl8ms5vmv7qOGUkPV7XqIoJSaLnG71ejg__&Key-Pair-Id=APKAIE5G5CRDK6RD3PGA)
Comparative analysis of tomo-seq data sets identifies species-restricted and interspecies-conserved gene expression in the aortic HSC supportive microenvironment. (A) Venn diagram showing shared and distinct ventrally expressed genes between chicken, human, mouse, and zebrafish tomo-seq data sets. Genes in bold: upregulated (messenger RNA level) in HSPC supportive stromal cell line UG26.1B6 compared with the non-/less supportive stromal cell line UG26.3B5 isolated from the embryonic AGM (according to http://stemniche.snv.jussieu.fr/29 ); underlined: known HSPC regulators in the embryonic aorta. Italic denotes connected to hematopoiesis. *Connected to leukemia. (B-F) Tomo-seq traces for PODXL (blue), ALDH1A2 (green), and PPARGC1A (orange) in the (ventral) aortic region (R1) of an E3 chicken slice (B), a 35-day-old human slice (C), an E10.5 mouse slice (D), a 28-hpf whole zebrafish (E), and a 40-hpf zebrafish trunk (F). (G-J) ISH showing the specific expression patterns of PODXL, ALDH1A2, and PPARGC1A in the (ventral) aortic region (R1) of an E3 chicken anterior slice (G), a 35-day-old human slice (H), an E10.5 mouse slice (I), a 40-hpf whole zebrafish embryo (J, left panel), and a zebrafish trunk slice (J, right panel). The number of embryos analyzed for WISH is indicated on the pictures. (K-L) Ten of the top biological process GO terms (K) and most relevant KEGG pathways (L) enriched in at least 2 species tomo-seq data sets (ie, 2, 3, and 4 species data sets). Bars represent 150 μm (G,I-J [left panels]), 200 μm (H), and 50 μm (J [right panels]).
Comparative analysis of tomo-seq data sets identifies species-restricted and interspecies-conserved gene expression in the aortic HSC supportive microenvironment. (A) Venn diagram showing shared and distinct ventrally expressed genes between chicken, human, mouse, and zebrafish tomo-seq data sets. Genes in bold: upregulated (messenger RNA level) in HSPC supportive stromal cell line UG26.1B6 compared with the non-/less supportive stromal cell line UG26.3B5 isolated from the embryonic AGM (according to http://stemniche.snv.jussieu.fr/29 ); underlined: known HSPC regulators in the embryonic aorta. Italic denotes connected to hematopoiesis. *Connected to leukemia. (B-F) Tomo-seq traces for PODXL (blue), ALDH1A2 (green), and PPARGC1A (orange) in the (ventral) aortic region (R1) of an E3 chicken slice (B), a 35-day-old human slice (C), an E10.5 mouse slice (D), a 28-hpf whole zebrafish (E), and a 40-hpf zebrafish trunk (F). (G-J) ISH showing the specific expression patterns of PODXL, ALDH1A2, and PPARGC1A in the (ventral) aortic region (R1) of an E3 chicken anterior slice (G), a 35-day-old human slice (H), an E10.5 mouse slice (I), a 40-hpf whole zebrafish embryo (J, left panel), and a zebrafish trunk slice (J, right panel). The number of embryos analyzed for WISH is indicated on the pictures. (K-L) Ten of the top biological process GO terms (K) and most relevant KEGG pathways (L) enriched in at least 2 species tomo-seq data sets (ie, 2, 3, and 4 species data sets). Bars represent 150 μm (G,I-J [left panels]), 200 μm (H), and 50 μm (J [right panels]).
Ligand-receptor cross talk between the microenvironment and HSCs
Cross talk between the aortic microenvironment and clusters can occur through direct cell-cell contact mediated through ligand-receptor signaling. We therefore examined our data sets to identify spatial interactions of signaling pathways and secretory proteins-receptors (based on genes encoding annotated ligands-receptors; see “Methods”). We used our previously published mouse cluster data set,35 which we complemented with a chicken cluster data set. This set was generated by FACS identification of CD45+ cluster cells from E3 chicken embryos after specific intra-aortic staining with anti-CD45 antibodies38 and sequenced in bulk, using the CEL-seq (Cell Expression by Linear amplification and Sequencing) protocol49,50 (supplemental Figure 6; supplemental Table 10). We first compared the mouse35 and chicken cluster data sets and then compared them with the microenvironment data set common to at least 2 species (supplemental Table 9). This approach resulted in an insightful map of potential ligand-receptor interactions occurring between the aortic microenvironment and cluster cells (Figure 3A). Through pathway analysis, we found that these ligands-receptors were mainly involved in processes such as EHT and HSPC survival, attachment, maturation, and/or expansion, including integrin (ITG), WNT, BMP, and FGF. Several partners were also connected to important HSPC regulators and pathways, such as BMP and NOTCH signaling (ACVR1, GREM1, APP, CDH1, and ITGB3), catecholamines (ADRA2A), and inflammation (ANXA1, CXCL12, and SELP; Figure 3A). Protein-protein interaction network visualized by STRING and k-means clustering revealed intricate nodes of query proteins and the first shell of interactors (Figure 3B). The analysis of the GO biological process and KEGG pathways emphasized a role of these molecules forming the major interconnected nodes in the extracellular matrix organization (ie, collagens, integrins, and laminins), hematopoietic cell lineage (KIT, KITL, and KDR), cell migration/adhesion (ephrins, FN1, GPR56, and PECAM1) and cytoskeleton rearrangement (TEK; Figure 3C-D). The ligand-receptor partners were also involved in various cellular processes (protein phosphorylation, intracellular protein transduction, and ERK and MAPK cascades) and specific pathways (Pi3K-AKT, MAPK, ERK, RAP1, and RAS; Figure 3C-D). Overall, our comparative analysis of the multispecies microenvironment and cluster data sets revealed common ligands and receptors present in the microenvironment of the aorta or cluster cells at the time of HSPC emergence and therefore potentially involved in EHT, cluster cell survival, maturation, adhesion, and/or migration.

Ligand-receptor interactions, biological processes, and pathways active during the cross talk between the cluster cells and the aortic microenvironment. (A) Distribution of the ligands and their corresponding receptors in the aortic microenvironment and clusters based on the microenvironment data set (common to at least 2 species, supplemental Table 9), the chicken cluster data set (supplemental Table 10), and a mouse cluster data set.35 (B) Secretomics analysis using the microenvironment data set (common to at least 2 species) and the chicken/mouse cluster data sets. Of note, not all molecules are linked, because we used stringent active interaction sources (experiments and database) for better readability of the k-means clustering network. (B′) Enlarged view of the blue node shown in the box in panel B. (C-D) Ten first biological processes in GO terms (C) and most relevant KEGG pathways (D) enriched in the ligand-receptor data sets.
Ligand-receptor interactions, biological processes, and pathways active during the cross talk between the cluster cells and the aortic microenvironment. (A) Distribution of the ligands and their corresponding receptors in the aortic microenvironment and clusters based on the microenvironment data set (common to at least 2 species, supplemental Table 9), the chicken cluster data set (supplemental Table 10), and a mouse cluster data set.35 (B) Secretomics analysis using the microenvironment data set (common to at least 2 species) and the chicken/mouse cluster data sets. Of note, not all molecules are linked, because we used stringent active interaction sources (experiments and database) for better readability of the k-means clustering network. (B′) Enlarged view of the blue node shown in the box in panel B. (C-D) Ten first biological processes in GO terms (C) and most relevant KEGG pathways (D) enriched in the ligand-receptor data sets.
ADM and its receptor RAMP2 regulate HSPC production
To further explore and validate our ligand-receptor data, we focused on 2 candidates with a thus far unknown hematopoietic role (ie, ADM and its receptor RAMP2; adrenomedullin-receptor activity modifying protein 2; Figure 2A [in red]; Figure 3A [arrows]; Figure 3B-B′ [blue node]). Our tomo-seq data and cluster data (from chicken [present study] and mouse35 ) predicted that ADM is expressed in the (ventral) aortic microenvironment, whereas RAMP2 is expressed by the ventral aortic endothelium and cluster cells/HSPCs. We confirmed these expression patterns for ADM in human, mouse, and zebrafish embryos (Figure 4A) and for RAMP2 in mouse (Figure 4B1), chicken (Figure 4B2), and zebrafish embryos (Figure 4B, bottom panel), by performing immunostaining and wholemount ISH (WISH) experiments. To determine whether ADM and RAMP2 play a role in HSPC production in vivo, we performed MO oligonucleotide knockdown in zebrafish embryos. ATG (MO_ATG) and splice blocking (MO_SB) MOs were injected in 1-cell stage embryos. For controls, embryos were either not injected or were injected with a mismatch MO. After validation of the MO knockdown (supplemental Figure 7A-B), we determined the effect of each gene knockdown on hematopoietic production by counting the number of runx1+ or cmyb+ cells in the floor of the dorsal aorta by WISH in 40- and 48-hpf zebrafish embryos, respectively (Figure 4C-F). The counts of both runx1+ and cmyb+ cells were significantly decreased in adm (Figure 4C,E) and ramp2 (Figure 4D-F) morphants, compared with controls. In addition, knockdown of adm or ramp2 in Tg(kdrl:mCherry;cd41:eGFP) embryos resulted in a decrease in cd41+ HSPCs (Figure 4G-H). Importantly, the ablation of adm or ramp2 did not result in an obvious vascular defect (kdrl:mCherry+; Figure 4G-H), nor did it affect the arterial specification as visualized by ephrinb2a expression (Figure 4I-J).

ADM and its receptor RAMP2 are novel and conserved HSPC regulators. (A) Top left panel: cryosection of 35-day-old human embryo stained with anti-ADM (green) and anti-CD34 (red) antibodies and 4′,6-diamidino-2-phenylindole (DAPI; blue). (A′) ADM expression in the ventral aortic microenvironment. Top right panels: cryosection of E10.5 mouse embryo stained with anti-ADM (green) and anti-CD31 (red) antibodies and DAPI (blue). (A′′) Enlargement of the boxed area showing immunostaining for ADM in the ventral aortic microenvironment close to budding hematopoietic cells. Bottom panels: WISH showing the expression pattern of adm in 40-hpf zebrafish embryos (left panel). Post-ISH embryos cryosectioned to show the expression pattern of adm along the dorsal-ventral axis of the embryo trunks (right panel). (B) Top left (B1): cryosection of E10.5 mouse embryo stained with anti-RAMP2 (red) and anti-RUNX1 (green) antibodies and DAPI (blue). (B1′,B1′′,B1′′′) Enlargement of boxed areas showing immunostaining for RAMP2 in the ventral endothelium and clusters. (B2) Top right panels: ISH showing the expression pattern of RAMP2 in an E3 chicken embryo cryosection. (B2′,B2′′,B2′′′) Enlargement of boxed areas showing RAMP2 expression in the ventral aortic endothelium and clusters. Bottom panels: WISH showing the expression pattern of ramp2 in 40-hpf zebrafish embryos (left panel). Post-ISH embryos show the expression pattern of ramp2 along the dorsal-ventral axis of the embryo trunks (right panel). The number of embryos analyzed for WISH is indicated on the photos. (C-D) The number of runx1+ HSPC cells was counted per aorta after WISH in noninjected embryos, embryos injected with mismatch MOs (controls), and embryos injected with blocking MOs (ATG and/or SB) for ADM (C, right panels) and Ramp2 (D, right panels). Representative cases of WISH for runx1 expression in controls and adm (C) and ramp2 (D) injected MOs, analyzed at 40 hpf (left panels). Graphs represent the average number (±SEM) of runx1+ cells in the dorsal aorta in each condition (n = 3 independent experiments, n ≈ 50 zebrafish embryos each). (E-F) Number of cmyb+ HSPCs per aorta in embryos not injected or injected with mismatch MOs (MO_MM) or blocking MOs (MO_ATG or MO_SB) for adm (E) and ramp2 (F). Example of WISH for cmyb in controls and adm (E) and ramp2 (F) injected MOs, analyzed at 48-hpf (left panels). Graphs represent the average number (±SEM) of cmyb+ cells in the aorta (n = 3 independent experiments; n ≈ 30 embryos for each condition). (G-H) Number of cd41+ HSPCs per aorta in embryos not injected or injected with mismatch MOs (MO_MM) or blocking MOs (MO_ATG or MO_SB) for adm (G) and ramp2 (H). Fluorescent micrographs of controls and adm (G) and ramp2 (H) injected MOs in the Tg(kdrl:mCherry;cd41:eGFP) fish background, analyzed at 40 hpf (left panels). Graphs represent the average number (±SEM) of cd41+ cells in the aorta (n = 2 independent experiments, 11-18 embryos for each condition). (I-J) WISH for ephrinB2a (arterial marker) in controls and adm (I) and ramp2 (J) injected MOs, analyzed at 40 hpf. (K) Graph represents the percentage of CD45+ hematopoietic cells in E3 chicken trunks after intracardiac injection of MilliQ water (control), ADM, or ADM-Antag. n = 2 independent experiments. Dot: 2 to 3 trunks pooled. (L-M) In vitro clonogenic assay with cells isolated from E9.5 (L) or E10.5 (M) wild-type AGMs cultured as explants with MilliQ (control) or ADM-Antag. Top: the number of CFU-Cs per AGM embryo equivalent (ee). Bottom: the number of CFU-Cs per 100 000 AGM explant cells. One representative experiment of 2 independent experiments. Bars represent 100 µm (A-H) and 200 µm (I-J). *P < .05; **P < .01; ***P < .001; ****P < .0001; n.s., not significant, by Student t test. BFU-E, burst forming unit-erythroid; CFU-G, CFU-granulocyte; CFU-GEMM, CFU-granulocyte-erythroid-macrophage-megakaryocyte; CFU-GM, CFU-granulocyte-macrophage; CFU-M, CFU-macrophage.
ADM and its receptor RAMP2 are novel and conserved HSPC regulators. (A) Top left panel: cryosection of 35-day-old human embryo stained with anti-ADM (green) and anti-CD34 (red) antibodies and 4′,6-diamidino-2-phenylindole (DAPI; blue). (A′) ADM expression in the ventral aortic microenvironment. Top right panels: cryosection of E10.5 mouse embryo stained with anti-ADM (green) and anti-CD31 (red) antibodies and DAPI (blue). (A′′) Enlargement of the boxed area showing immunostaining for ADM in the ventral aortic microenvironment close to budding hematopoietic cells. Bottom panels: WISH showing the expression pattern of adm in 40-hpf zebrafish embryos (left panel). Post-ISH embryos cryosectioned to show the expression pattern of adm along the dorsal-ventral axis of the embryo trunks (right panel). (B) Top left (B1): cryosection of E10.5 mouse embryo stained with anti-RAMP2 (red) and anti-RUNX1 (green) antibodies and DAPI (blue). (B1′,B1′′,B1′′′) Enlargement of boxed areas showing immunostaining for RAMP2 in the ventral endothelium and clusters. (B2) Top right panels: ISH showing the expression pattern of RAMP2 in an E3 chicken embryo cryosection. (B2′,B2′′,B2′′′) Enlargement of boxed areas showing RAMP2 expression in the ventral aortic endothelium and clusters. Bottom panels: WISH showing the expression pattern of ramp2 in 40-hpf zebrafish embryos (left panel). Post-ISH embryos show the expression pattern of ramp2 along the dorsal-ventral axis of the embryo trunks (right panel). The number of embryos analyzed for WISH is indicated on the photos. (C-D) The number of runx1+ HSPC cells was counted per aorta after WISH in noninjected embryos, embryos injected with mismatch MOs (controls), and embryos injected with blocking MOs (ATG and/or SB) for ADM (C, right panels) and Ramp2 (D, right panels). Representative cases of WISH for runx1 expression in controls and adm (C) and ramp2 (D) injected MOs, analyzed at 40 hpf (left panels). Graphs represent the average number (±SEM) of runx1+ cells in the dorsal aorta in each condition (n = 3 independent experiments, n ≈ 50 zebrafish embryos each). (E-F) Number of cmyb+ HSPCs per aorta in embryos not injected or injected with mismatch MOs (MO_MM) or blocking MOs (MO_ATG or MO_SB) for adm (E) and ramp2 (F). Example of WISH for cmyb in controls and adm (E) and ramp2 (F) injected MOs, analyzed at 48-hpf (left panels). Graphs represent the average number (±SEM) of cmyb+ cells in the aorta (n = 3 independent experiments; n ≈ 30 embryos for each condition). (G-H) Number of cd41+ HSPCs per aorta in embryos not injected or injected with mismatch MOs (MO_MM) or blocking MOs (MO_ATG or MO_SB) for adm (G) and ramp2 (H). Fluorescent micrographs of controls and adm (G) and ramp2 (H) injected MOs in the Tg(kdrl:mCherry;cd41:eGFP) fish background, analyzed at 40 hpf (left panels). Graphs represent the average number (±SEM) of cd41+ cells in the aorta (n = 2 independent experiments, 11-18 embryos for each condition). (I-J) WISH for ephrinB2a (arterial marker) in controls and adm (I) and ramp2 (J) injected MOs, analyzed at 40 hpf. (K) Graph represents the percentage of CD45+ hematopoietic cells in E3 chicken trunks after intracardiac injection of MilliQ water (control), ADM, or ADM-Antag. n = 2 independent experiments. Dot: 2 to 3 trunks pooled. (L-M) In vitro clonogenic assay with cells isolated from E9.5 (L) or E10.5 (M) wild-type AGMs cultured as explants with MilliQ (control) or ADM-Antag. Top: the number of CFU-Cs per AGM embryo equivalent (ee). Bottom: the number of CFU-Cs per 100 000 AGM explant cells. One representative experiment of 2 independent experiments. Bars represent 100 µm (A-H) and 200 µm (I-J). *P < .05; **P < .01; ***P < .001; ****P < .0001; n.s., not significant, by Student t test. BFU-E, burst forming unit-erythroid; CFU-G, CFU-granulocyte; CFU-GEMM, CFU-granulocyte-erythroid-macrophage-megakaryocyte; CFU-GM, CFU-granulocyte-macrophage; CFU-M, CFU-macrophage.
To determine whether ADM is also involved in HSPC production in other species, we tested the active form of ADM (human ADM [13-52]) and its antagonist (human ADM [22-52] trifluoroacetate salt, referred to as ADM-Antag) in chicken embryos in vivo. ADM (13-52) is the ADM fragment that possesses vasodilatory activity. ADM-Antag is a putative ADM receptor antagonist that inhibits the production of cAMP elicited by ADM. Intracardiac injections of ADM, ADM-Antag, or MilliQ water as a control (used to dissolve ADM) were performed in E2 chicken embryos in ovo. Embryo trunks were isolated at E3 and the percentage of CD45+ hematopoietic cells was evaluated after flow cytometry analysis (Figure 4K; n = 2). Although ADM increased the percentage of CD45+ cells in the aorta in vivo, the ADM-Antag decreased this percentage (when compared with controls). Therefore, ADM promotes HSPC activity in the chicken embryo species, as well. We then tested whether the effect of ADM is conserved in the mouse species. For this purpose, E9.5 and E10.5 AGMs were cultured as explants in the presence of ADM-Antag or the same amount of MilliQ water (as the control) in the explant medium. After 3 days of explant culture, AGM cells were tested in vitro in a clonogenic assay (colony forming unit-cell [CFU-C] assay). Although ADM-Antag had no effect on cell viability, it decreased the number of CFU-Cs at E9.5, but to a much lesser extent at E10.5 (Figure 4L and M, respectively, n = 2). These data thus reveal an early role of ADM in HSPC production in the mouse embryonic aorta.
Overall, our tomo-seq and RNA-sequencing (RNA-seq) interspecies comparative analyses and functional validations identified ADM and RAMP2 as an important conserved ligand-receptor couple involved in HSPC production in vivo.
SVEP1 regulates the cellularity and fate of intra-aortic clusters
Besides direct ligand-receptor interactions between the microenvironment and HSCs, single secreted growth factors and modulators of the extracellular environment may also be important components to modulate or fine-tune HSC development. Our transcriptomics analyses identified SVEP1 (Figure 2A; bold red), which is a secreted factor known to modulate the extracellular environment to facilitate sprouting and migration of venous endothelial cells.51 Interestingly, cells producing SVEP1 are in immediate contact with the endothelium, including the dorsal aorta.51 These cells are most likely mesenchymal cells, given that HSPCs, endothelial cells, muscle pioneer cells, and neurons do not express SVEP1.51 Our tomo-seq traces and ISH in E3 chicken, 35-day-old human, and E10.5 mouse embryos supported an expression pattern restricted to the aortic region (supplemental Figure 8A-C). To determine whether SVEP1 plays a role on HSPC production, we quantified the number of cluster cells in the aorta of Svep1+/+ and Svep1−/− mouse embryos51 by performing wholemount immunostaining. Even though no significant differences were found at both E10.5 and E12.5 in the number of cluster cells (CD31+KIT+RUNX1+) per aorta (Figure 5A-B, respectively), nor in their distribution along the aorta (supplemental Figure 8D-E), the cellularity per cluster differed. Indeed, very large clusters were observed in Svep1−/− compared with Svep1+/+ aortas at both time points (Figure 5C-D). The cellularity of Svep1−/− clusters was significantly increased when compared with Svep1+/+ clusters at both E10.5 and E12.5 (Figure 5E-F). Svep1−/− aortas contained clusters composed of up to 80 cells, whereas clusters never contained more than 20 cells in Svep1+/+ aortas. Accordingly, the total number of clusters was lower (Figure 5G-H). To determine whether the presence of large clusters in Svep1−/− aortas was caused by increased cell proliferation, staining for phosphorylated histone H3 (PHH3) and Ki67 was performed on E10.5 Svep1+/+ and Svep1−/− embryo thick slices (supplemental Figure 9A and B, respectively). No differences were observed in the mitotic PHH3+ cells (supplemental Figure 9C-D) or in cells in the M phase (Ki67high); in the G1, S, or G2 phase (Ki67int); or in the G0 phase (Ki67neg; supplemental Figure 9E-G) in all clusters or large clusters (>5 cells). Thus, the increased cellularity observed in Svep1−/− clusters is not caused by abnormal cell proliferation.
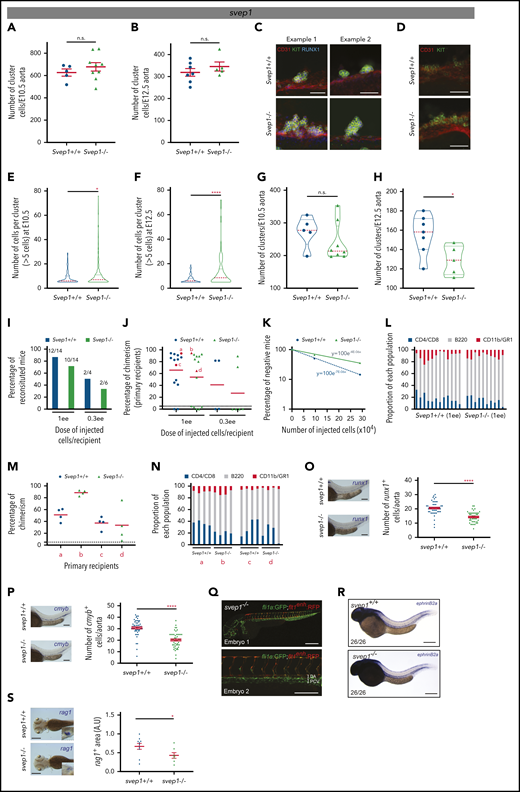
Svep1 regulates the cellularity and fate of clusters. (A-B) Number of cluster cells per E10.5 (A) and E12.5 (B) Svep1+/+ and Svep1−/− aortas (at E10.5: n = 5 and 9 Svep1+/+ and Svep1−/− embryos, respectively; at E12.5: n = 7 and 5 Svep1+/+ and Svep1−/− embryos, respectively; n = 3 independent experiments). Bars represent means ± SEM. (C-D) Enlarged examples of clusters after maximal projection of E10.5 (C) and E12.5 (D) Svep1+/+ (top panels) and Svep1−/− (bottom panels) aortas stained with anti-CD31 (endothelial and hematopoietic marker, red), anti-KIT (hematopoietic marker, green), and anti-RUNX1 (hemogenic endothelium and hematopoietic marker, blue) antibodies. (E-F) Number of cells per clusters composed of more than 5 cells in E10.5 (E) and E12.5 (F) Svep1+/+ and Svep1−/− aortas. (G-H) Number of clusters per E10.5 (G) and E12.5 (H) Svep1+/+ and Svep1−/− aortas. (I) Hematopoietic repopulation analyses after injection of AGM cells isolated from Svep1+/+ and Svep1−/− E11 embryos (n = 1-3 independent experiments). Numbers above bars indicate the number of mice repopulated/number of mice injected. Dose of injected cells is indicated as embryo equivalent (ee). (J) Percentage of chimerism in peripheral blood for each injected mouse in panel I, 4 months after transplantation. Dot: 1 transplanted recipient mouse. Red dots: mice used to perform secondary transplantations (labeled a-d, here and in subsequent panels). Dashed line: limit of positivity (>5% of chimerism by flow cytometry). Red line: chimerism average. (K) HSC frequency determined based on the transplantation results in panel I. HSC frequency per AGM was estimated by Poisson statistics applied to the percentage of nonrepopulated recipients (y-axis) and the number of injected cells (x-axis). (L) Long-term donor-derived lymphoid (T cells: CD4+, CD8+; B cells: B220+) and myeloid (CD11b+, GR1+) contribution in the blood of reconstituted recipients in panel J. Each bar represents a single recipient. (M) Percentage of chimerism in peripheral blood for each secondary recipient mouse transplanted with 3 × 10⁶ bone marrow cells isolated from the primary reconstituted recipients (a-d, indicated in panel J) at 4 months after transplantation. Dot: 1 transplanted repicient mouse. Dashed line: limit of positivity (>5% of chimerism by flow cytometry). Red line: chimerism average. (N) Long-term donor-derived lymphoid (T cells: CD4+, CD8+; B cells: B220+) and myeloid (CD11b+, GR1+) contribution in the blood of secondary reconstituted recipients shown in panel M. Each bar represents a single recipient. (O-P) Number of runx1+ (O) and cmyb+ (P) HSPCs per aorta at 40 and 48 hpf, respectively, were determined after WISH in svep1+/+ and svep1−/− zebrafish embryos. Representative cases of WISH for runx1 and cmyb expressions in svep1+/+ and svep1−/− zebrafish embryos (left side of each graph). Graphs represent the average number (±SEM) of runx1+ and cmyb+ cells in the dorsal aorta (n ≈ 50 zebrafish embryos each). (Q) Fluorescent micrographs of 2 svep1−/− (fli1a:GFP;flt1enh:RFP) embryos analyzed at 40 hpf. Global view (top panel, embryo 1) and enlargement of the dorsal aorta area (bottom panel, embryo 2). (R) WISH for ephrinb2a in svep1+/+ (top panel) and svep1−/− (bottom panel) embryos, analyzed at 40 hpf. The total number of embryos analyzed for WISH is indicated on the photographs. (S) The rag1+ thymic areas at 4 dpf were determined after WISH in svep1+/+ and svep1−/− zebrafish embryos. Representative cases of WISH for rag1 expression in svep1+/+ and svep1−/− zebrafish embryos (left panels). Graphs represent the average of rag1+ thymic area (±SEM) (n ≈ 10 zebrafish embryos). *P < .05; **P < .01; ***P < .001; ****P < .0001; n.s., not significant, by Student t test. Bars represent 50 µm (C-D), 100 µm (O-Q), and 200 µm (R-S).
Svep1 regulates the cellularity and fate of clusters. (A-B) Number of cluster cells per E10.5 (A) and E12.5 (B) Svep1+/+ and Svep1−/− aortas (at E10.5: n = 5 and 9 Svep1+/+ and Svep1−/− embryos, respectively; at E12.5: n = 7 and 5 Svep1+/+ and Svep1−/− embryos, respectively; n = 3 independent experiments). Bars represent means ± SEM. (C-D) Enlarged examples of clusters after maximal projection of E10.5 (C) and E12.5 (D) Svep1+/+ (top panels) and Svep1−/− (bottom panels) aortas stained with anti-CD31 (endothelial and hematopoietic marker, red), anti-KIT (hematopoietic marker, green), and anti-RUNX1 (hemogenic endothelium and hematopoietic marker, blue) antibodies. (E-F) Number of cells per clusters composed of more than 5 cells in E10.5 (E) and E12.5 (F) Svep1+/+ and Svep1−/− aortas. (G-H) Number of clusters per E10.5 (G) and E12.5 (H) Svep1+/+ and Svep1−/− aortas. (I) Hematopoietic repopulation analyses after injection of AGM cells isolated from Svep1+/+ and Svep1−/− E11 embryos (n = 1-3 independent experiments). Numbers above bars indicate the number of mice repopulated/number of mice injected. Dose of injected cells is indicated as embryo equivalent (ee). (J) Percentage of chimerism in peripheral blood for each injected mouse in panel I, 4 months after transplantation. Dot: 1 transplanted recipient mouse. Red dots: mice used to perform secondary transplantations (labeled a-d, here and in subsequent panels). Dashed line: limit of positivity (>5% of chimerism by flow cytometry). Red line: chimerism average. (K) HSC frequency determined based on the transplantation results in panel I. HSC frequency per AGM was estimated by Poisson statistics applied to the percentage of nonrepopulated recipients (y-axis) and the number of injected cells (x-axis). (L) Long-term donor-derived lymphoid (T cells: CD4+, CD8+; B cells: B220+) and myeloid (CD11b+, GR1+) contribution in the blood of reconstituted recipients in panel J. Each bar represents a single recipient. (M) Percentage of chimerism in peripheral blood for each secondary recipient mouse transplanted with 3 × 10⁶ bone marrow cells isolated from the primary reconstituted recipients (a-d, indicated in panel J) at 4 months after transplantation. Dot: 1 transplanted repicient mouse. Dashed line: limit of positivity (>5% of chimerism by flow cytometry). Red line: chimerism average. (N) Long-term donor-derived lymphoid (T cells: CD4+, CD8+; B cells: B220+) and myeloid (CD11b+, GR1+) contribution in the blood of secondary reconstituted recipients shown in panel M. Each bar represents a single recipient. (O-P) Number of runx1+ (O) and cmyb+ (P) HSPCs per aorta at 40 and 48 hpf, respectively, were determined after WISH in svep1+/+ and svep1−/− zebrafish embryos. Representative cases of WISH for runx1 and cmyb expressions in svep1+/+ and svep1−/− zebrafish embryos (left side of each graph). Graphs represent the average number (±SEM) of runx1+ and cmyb+ cells in the dorsal aorta (n ≈ 50 zebrafish embryos each). (Q) Fluorescent micrographs of 2 svep1−/− (fli1a:GFP;flt1enh:RFP) embryos analyzed at 40 hpf. Global view (top panel, embryo 1) and enlargement of the dorsal aorta area (bottom panel, embryo 2). (R) WISH for ephrinb2a in svep1+/+ (top panel) and svep1−/− (bottom panel) embryos, analyzed at 40 hpf. The total number of embryos analyzed for WISH is indicated on the photographs. (S) The rag1+ thymic areas at 4 dpf were determined after WISH in svep1+/+ and svep1−/− zebrafish embryos. Representative cases of WISH for rag1 expression in svep1+/+ and svep1−/− zebrafish embryos (left panels). Graphs represent the average of rag1+ thymic area (±SEM) (n ≈ 10 zebrafish embryos). *P < .05; **P < .01; ***P < .001; ****P < .0001; n.s., not significant, by Student t test. Bars represent 50 µm (C-D), 100 µm (O-Q), and 200 µm (R-S).
To test whether increased cluster cellularity may affect HSC activity, AGM cells from E11 Svep1+/+ and Svep1−/− embryos (CD45.2 background) were transplanted into adult irradiated wild-type recipients (CD45.1 background). Two cell doses were injected (0.3 and 1 embryo equivalent (ee)/recipient) and long-term multilineage analysis was performed at 4 months after transplantation. A lower percentage of reconstituted recipients was observed when Svep1−/− AGM cells were transplanted, with a lower chimerism (Figure 5I-J). The frequency of HSCs in Svep1+/+ and Svep1−/− AGMs was determined by applying Poisson statistics (Figure 5K), and the absolute number of HSCs was calculated. Although Svep1+/+ AGMs contain 2.04 HSCs (frequency, 1 HSC/142 036 AGM cells), a number in accordance with previous studies,31,52,53 Svep1−/− AGMs contained only 1.17 HSCs (frequency, 1 HSC/248 563 AGM cells). Nonetheless, the Svep1−/− HSCs were functional, given that we obtained normal proportions of T cells (CD4+/CD8+), B cells (B220+), and myeloid cells (CD11b+/GR1+) in all reconstituted recipients, indicating multilineage reconstitutions at 4 months (Figure 5L) that was maintained 1 year after transplantation (data not shown). To test the self-renewal ability of Svep1−/− HSCs, secondary transplantations were performed. No differences in the long-term multilineage reconstitution were observed in the secondary recipients injected with bone marrow cells from primary recipients initially reconstituted with Svep1+/+ or Svep1−/− AGM cells (Figure 5M-N). Therefore, the loss of SVEP1 resulted in a reduced number of clusters that contained more cells but fewer functional HSCs. We found that the percentage of CD45+ cells in E11.5 Svep1+/+ and Svep1−/− embryos was similar, indicating that the reduced HSC activity was not caused by a premature differentiation of cluster cells in Svep1−/− embryos (supplemental Figure 9H-I).
To test whether the regulatory role of SVEP1 was conserved, we analyzed HSPC production in svep1 mutant fish lines.51 Similar to chicken, mouse, and human, svep1 is expressed in the aortic region and in the caudal hematopoietic tissue of 40-hpf zebrafish embryos (supplemental Figure 8F). Zebrafish mutants had a significant reduction in runx1+ and cmyb+ cells in the floor of the dorsal aorta at 40 and 48 hpf, respectively (Figure 5O-P), whereas arterial development and specification were unaffected (Figure 5Q-R). The hematopoietic defect persisted since we observed a significant reduction in rag1+ lymphocytes in the thymus of the mutants at 4 days after fertilization (Figure 5S). SVEP1, which was predicted as a potential conserved HSPC regulator of the aortic microenvironment based on our transcriptomics analysis, indeed regulates HSPC production in mouse and zebrafish embryos.
Discussion
We generated genome-wide data sets to identify spatial gene expression patterns along the developmental axes of 4 embryo species (ie, chicken, human, mouse, and zebrafish). By combining tomo-seq and RNA-seq data set analyses, supervised filtering strategies and in vivo functional assays, we disclosed the complexity of the (ventral) aortic microenvironment landscape at the time of HSC emergence. We especially highlighted 3 new and conserved regulators required for proper cluster and HSC formation: ADM, its receptor RAMP2, and SVEP1.
Secretomics analysis and comparison of the aortic microenvironment data sets (common to at least 2 species) and cluster data sets (from chicken [present study] and mouse35 ) identified a myriad of interesting ligand-receptor partners. This emphasizes the complex cross talk occurring between cluster cells and their proximal (ie, endothelium, subaortic mesenchyme) and distal (eg, urogenital ridges) microenvironments. GO term and k-means clustering analyses identified the nodes of molecules involved in the different biological processes and pathways that would support the successive steps leading to HSC formation: regulation of actin cytoskeleton (for EHT and cluster formation), hematopoietic cell lineage (for cluster maturation), and focal adhesion/regulation of cell motility (for cluster cell attachment/detachment/migration). The ligand-receptor ADM-RAMP2 specifically caught our attention, as it may provide a signaling route that senses hemodynamic shear stress in the environment and transfers this signal to the hemogenic endothelium and/or to HSPCs. Normal blood flow is essential for HSC development and its absence severely impairs hematopoiesis.54-58 However, the molecular mechanism underlying sensing of shear stress is not fully understood yet. One could speculate that the absence of ADM, which is a known hypotensive and vasodilator agent involved in tube formation,59 may affect the potential of hemogenic endothelial cells to produce HSPCs in vivo (as we reported herein). Similarly, the absence of RAMP2, which transports the calcitonin gene-related peptide type 1 receptor (CALCRL) to the plasma membrane and acts as a receptor for ADM together with CALCRL, would also interfere with HSPC formation.
Beside ligands and receptors, single factors are also active in the aortic microenvironment. Among them, we identified SVEP1 as a new and conserved HSC regulator. SVEP1 is the first extrinsic factor identified in the aortic microenvironment that regulates cluster cellularity and fate in the mouse embryo. Although fewer clusters were formed in the absence of SVEP1, the ones that formed were composed of more cells, resulting in a normal number of cluster cells per aorta. However, the HSC activity was affected. The presence of large clusters does not seem to be caused by abnormal cluster cell proliferation or adhesion, or by an increase in EHT events. Double deficiency for the 2 Notch targets, Hes1 (expressed in the aortic endothelium and clusters), and Hes5, also leads to the formation of large clusters, but no functional progenitors and HSCs.60 Dll4 was recently shown to control cell recruitment into the clusters, the blockage of which increased the number of cells in clusters that acquire an HSC activity.61 The presence of large clusters and the decrease of HSC activity in Svep1−/− embryos is unlikely to result from Notch deregulation because the preliminary data indicated that Hes1 and Hes5 were similarly expressed in Svep1+/+ and Svep1−/− embryos (data not shown). This finding may indicate that the cluster cellularity is controlled by another pathway that remains to be identified. The same amount of cluster cells was present in Svep1+/+ and Svep1−/− mouse embryos, but fewer HSPCs were produced in svep1−/− zebrafish embryos. This finding may look contradictory and seem to be the result of differences between species that produce HSPCs via clusters or single cells. Overall, however, both species have a functional HS(P)C defect in absence of Svep1, showing its conserved regulatory role. The way that Svep1 regulates the hematopoietic cellularity will be the subject of future research in both species. Moreover, a better identification of the different cell types composing the aortic microenvironment (poorly described thus far) will be needed to ascertain specific regulatory functions by specific cell types. It will also help to decipher whether the extrinsic regulation is a direct or indirect event occurring either in close contact to the hemogenic endothelium and clusters (eg, by cell-cell contact and paracrine factors) or at a distance (eg, via a gradient of expression).
All our RNA-seq data sets are available to the community, providing the possibility of performing further analyses by changing any parameters (eg, for a less stringent filtering approach, by increasing the size of the regions of interest and/or by decreasing the thresholds). Our tomo-seq data sets can also be more broadly used by the scientific community to identify gene expression patterns and to perform gene expression comparisons along the embryo axes (as shown, for example, for the chicken embryo in supplemental Figure 10). To this end, we developed an interactive website (http://multi-species.embryos.tomoseq.genomes.nl), enabling researchers (1) to compare with precision the expression pattern of any given gene of interest in any structure or microenvironment along the posterior-anterior (zebrafish, chicken) and/or dorsal-ventral embryo axes (all 4 species); (2) to identify molecular signals that are potentially involved in tissue patterning (eg, induction signal from neural tube/somite, notochord/somite); and (3) to identify new genes that follow an expression pattern similar to that of a known gene used to define a region of interest (eg, further genes involved in the AGM region and genes involved in neural crest cells, sclerotomal cells, or mesonephros development). In the near future, the ability to integrate spatial transcriptomics with, for example, advanced (live) tissue imaging techniques and computational/theoretical models will open new horizons in understanding stem cell regulation in a physiological situation (eg, regulatory networks, spatial gradients of gene expression). Understanding the native (hematopoietic) stem cell niche will offer novel approaches for promoting stem cell activity and tissue regeneration, after injury, irradiation, or chemotherapy or upon aging. This knowledge will also provide insights into healthy vs cancer stem cell niches for drug testing, disease modeling, and therapy.
The data sets generated and/or analyzed during the current study have been deposited in the Gene Expression Omnibus database (accession number GSE128350).
The online version of this article contains a data supplement.
The publication costs of this article were defrayed in part by page charge payment. Therefore, and solely to indicate this fact, this article is hereby marked “advertisement” in accordance with 18 USC section 1734.
Acknowledgments
The authors thank the laboratory members for helpful discussion and Carla Kroon-Veenboer and Rutger Wielink, in particular, for technical help; Alexander van Oudenaarden for very helpful discussions at the beginning of the project; Jacqueline Deschamps and Jean-Charles Boisset for useful comments on the manuscript; Romualdo Ciau-Uitz (from Roger Patient’s laboratory) for kindly sharing zebrafish ISH probes; the Animal Facility for mouse and zebrafish care and the Optical Imaging Center for confocal microscope access (Hubrecht Institute); Stefan van der Elst (Hubrecht Institute) for help with cell sorting; Mauro Muraro for technical help and advice (Single Cell Discoveries bv); the Utrecht Sequencing Facility (USF), subsidized by the University Medical Center Utrecht, Hubrecht Institute, and Utrecht University; the E.B. laboratory for improving the chicken genome annotation; Kelly McNagny (Vancouver, BC, Canada) for the anti-chicken MEP21 supernatant; and Tom Cupedo (Erasmus MC, Rotterdam, The Netherlands) and Susana Chuva de Sousa Lopes (LUMC, Leiden, The Netherlands) for providing human tissue samples.
This work was supported in the C.R. laboratory by a European Research Council grant (ERC; project number 220-H75001EU/HSCOrigin-309361), a TOP-subsidy from Netherlands Organization for Scientific Research (NWO)/ZonMw (912.15.017), and the UMC Utrecht “Regenerative Medicine & Stem Cells” priority research program.
Authorship
Contribution: C.R. and L.Y. conceived the ideas, designed the research, and performed the mouse embryo dissections for transplantation experiments; C.R. performed the transplantations; L.Y. analyzed the transplanted recipient mice by flow cytometry, performed all embryo dissections, and prepared all samples for the tomo-seq experiments; L.Y. performed tomo-seq with the help of A.K., I.M.-P., and J.P.J.; L.Y., A.K., and I.M.-P. performed MO injections; L.Y. and J.M. performed ISHs; L.Y. and C.R. analyzed all tomo-seq data with the help of J.P.J.; B.W. and J.M. performed quantitative reverse transcription-polymerase chain reaction; A.K. performed explant cultures and the CFU-C assay; L.Y. performed chicken embryo injections and analyses, staining, and quantification for the Ki67 and PHH3 experiments; E.B. designed the Web site; S.S.-M. provided the Svep1 fish and mouse lines; L.Y. and C.R. analyzed and interpreted the experiments, created the figures, and wrote the paper with the help of A.K. and B.W; and all authors commented on the manuscript.
Conflict-of-interest disclosure: The authors declare no competing financial interests.
Correspondence: Catherine Robin, Hubrecht Institute-KNAW, Uppsalalaan 8, 3584 CT, Utrecht, The Netherlands; e-mail: c.robin@hubrecht.eu.

This feature is available to Subscribers Only
Sign In or Create an Account Close Modal