

Key Points
Analyses of time from diagnosis of AML to start of intensive treatment indicate that a treatment delay has no negative prognostic impact.

Abstract
In fit patients with newly diagnosed acute myeloid leukemia (AML), immediate treatment start is recommended due to the poor prognosis of untreated acute leukemia. We explored the relationship between time from diagnosis to treatment start (TDT) and prognosis in a large real-world data set from the German Study Alliance Leukemia–Acute Myeloid Leukemia (SAL-AML) registry. All registered non–acute promyelocytic leukemia patients with intensive induction treatment and a minimum 12 months of follow-up were selected (n = 2263). We analyzed influence of TDT on remission, early death, and overall survival (OS) in univariable analyses for each day of treatment delay, in groups of 0 to 5, 6 to 10, 11 to 15, and >15 days of TDT, adjusted for influence of established prognostic variables on outcomes. Median TDT was 3 days (interquartile range, 2-7). Unadjusted 2-year OS rates, stratified by TDT of 0 to 5, 6 to 10, 11 to 15, and >15 days, were 51%, 48%, 44%, and 50% (P = .211). In multivariable Cox regression analysis accounting for established prognostic variables, the TDT hazard ratio as a continuous variable was 1.00 (P = .617). In OS analyses, separately stratified for age ≤60 and >60 years and for high vs lower initial white blood cell count, no significant differences between TDT groups were observed. Our study suggests that TDT is not related to survival. As stratification in intensive first-line AML treatment evolves, TDT data suggest that it may be a feasible approach to wait for genetic and other laboratory test results so that clinically stable patients are assigned the best available treatment option. This trial was registered at www.clinicaltrials.gov as #NCT03188874.
Introduction
Patients with untreated newly diagnosed acute leukemia only have a median survival of ∼17 weeks, mainly due to neutropenic infections, bleeding complications, or leukostasis.1 Therefore, acute myeloid leukemia (AML) is generally considered a medical emergency, implying an immediate start of treatment as soon as the diagnosis is made. This recommendation is a passed-on traditional doctrine, which is also supported by a retrospective analysis demonstrating shorter survival in AML patients up to the age of 60 years in whom treatment was delayed by >5 days.2 More recently, a similar analysis came to a different conclusion, showing no prognostic effect for the time from diagnosis to treatment start (TDT) and emphasizing differences between the 2 analyses regarding patient characteristics and treatment.3 The Study Alliance Leukemia (SAL) Study Group runs a transregional AML registry collecting real-world data from 46 treatment centers across Germany (NCT03188874). Based on a large data set of (currently) 4700 patients, we planned to explore the relationships between TDT and prognosis and compare them to the published cohorts.
Methods
For the current analysis, we selected all patients from the SAL-AML registry fulfilling the following criteria: intensive induction treatment containing standard- to higher-dose cytarabine plus anthracycline/mitoxantrone and follow-up of at least 1 year. Patients dying at any time after treatment start were included. The SAL-AML registry is a noninterventional study capturing patient and disease characteristics, treatments, and outcomes for AMLs diagnosed in the 46 participating treatment centers across Germany. Only patients without informed consent were excluded from registration. The study protocol has been approved by the ethics committees of all participating centers.
Patient characteristics were analyzed by descriptive statistical methods. The clinically relevant binary outcomes complete remission (CR) and early death (ED) were expressed as percentage and compared by the χ2 test, whereas for overall survival (OS), the Kaplan-Meier approach was chosen, using the log-rank test for univariable significance testing. OS was calculated from beginning of intensive chemotherapy until death from any cause. For patients who did not die during the follow-up period, OS was censored on the date of last known follow-up. TDT was defined as time from diagnosis of AML and the beginning of intensive chemotherapy. The use of hydroxyurea (HU) was allowed during TDT. This means that the time between diagnosis and treatment during which a patient received cytoreductive treatment with only HU was counted as TDT until treatment escalation to cytarabine-based intensive treatment. To improve the validity of data and reduce potential documentation errors, the following cases were excluded from analysis: TDT of >50 days and negative TDT, that is, cases with treatment start before the establishment of AML diagnosis. Correlation between TDT and binary end points was assessed by cross-tabulation for univariable analyses and by logistic regression for multivariable analysis, controlling for established prognostic parameters. Survival outcomes and TDT were analyzed using Cox regression for univariable and multivariable analyses. For these analyses, TDT was both used as continuous variable and grouped based on clinically meaningful categories. We explored the use of the restricted cubic spline (RCS) method for data modeling in order to: avoid loss of information, and reduction in power, introduced by the categorization of TDT, and deal with the supposed nonlinearity in the relationship between outcomes and TDT.4-6 RCS is a polynomial function that is piecewise defined into prespecified adjacent intervals as recommended by Harrell.6 Likelihood ratio tests were used to assess the fitting of multivariable models depending on linear vs grouped categories, the use of RCS, and interaction terms. For additional adjustment of prognostic imbalances between TDT groups, we used propensity score weighting to determine the average treatment effect of each TDT group. The propensity score contained the established prognostic variables age, sex, white blood cell count (WBC), European LeukemiaNet (ELN) 2017 risk, de novo vs secondary AML, and Eastern Cooperative Oncology Group (ECOG) performance status (0-1 vs >1). To assess the fitting quality of propensity score weighted models for OS, the Akaike Information Criterion (AIC) was used. The influence of HU pretreatment on outcomes was investigated by introducing an interaction term between TDT and the presence of HU pretreatment. If the interaction was not significant according to the Wald test in the multivariable model, no influence of HU was assumed.
For multivariable analyses, missing data were substituted by the global median (WBC, lactate dehydrogenase [LDH]) or by a separate “missing” category (disease status, ELN risk). In case of missing ECOG status, the category 0 to 1 was chosen for substitution, assuming that the majority of patients eligible for intensive treatment tend to have favorable clinical performance; missing data on comorbidities for calculation of the Hematopoietic Cell Transplantation-specific Comorbidity Index (HCT-CI) were considered “comorbidity not present.”
All statistical calculations were done using R version 3.5.3.7
Results
Patient disposition
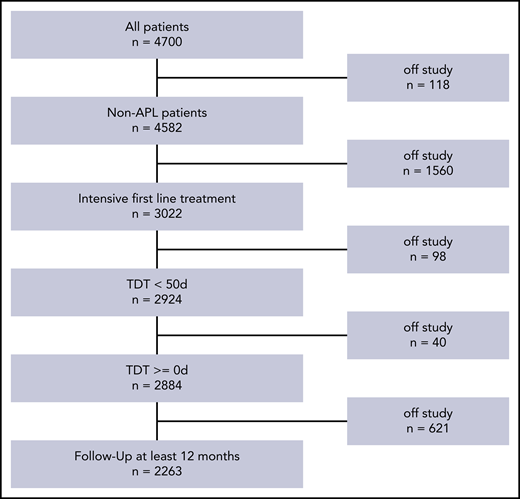
By the time of analysis, 4700 patients were registered in the SAL-AML registry. The following patients were excluded for different reasons: acute promyelocytic leukemia (n = 118), nonintensive treatment (n = 1560), TDT of ≥50 days (n = 98), and follow-up survival information <1 year (n = 621). The patient selection process is shown in Figure 1. The clinical and disease characteristics of the remaining 2263 patients are displayed in Table 1. Patients were treated between 2011 and 2019. The median age was 59 years (interquartile range [IQR], 50-68). Favorable, intermediate, and adverse genetic risks according to ELN20178 were present in 27%, 54% and 19% of patients, respectively. The proportion of patients with hyperleukocytosis (HL) as defined by WBC count >50 × 109/L was 21% for all patients and 26%, 10%, 7%, 10% in the respective TDT subgroups [0-5, 6-10, 11-15, and >15 days]). The median TDT was 3 days (IQR, 2-7); the distribution over all patients was not normally distributed and is shown in supplemental Figure 1 (available on the Blood Web site). There were no TDT differences between small, medium-sized, and large treatment centers.
Patient and treatment characteristics of all 2263 patients and according to TDT groups
| Parameter | All patients, n = 2263 | TDT, 0-5 d; n = 1547 | TDT, 6-10 d; n = 447 | TDT, 11-15 d; n = 106 | TDT, >15 d; n = 163 |
|---|---|---|---|---|---|
| Age at initial diagnosis, y | |||||
| Mean (SD) | 57.40 (13.73) | 56.45 (13.97) | 59.64 (12.81) | 60.05 (12.49) | 58.52 (13.69) |
| Median (IQR) | 59 (50-68) | 58 (49-67) | 61 (53-69) | 63 (54-69) | 60 (51-69) |
| Female sex, no./no. available (%) | 1036/2263 (45.8) | 735/1547 (47.5) | 193/447 (43.2) | 39/106 (36.8) | 69/163 (42.3) |
| AML type, no./no. available (%) | |||||
| De novo AML | 1691/2255 (75.0) | 1224/1545 (79.2) | 302/444 (68.0) | 72/106 (67.9) | 93/160 (58.1) |
| sAML | 341/2255 (15.1) | 177/1545 (11.5) | 90/444 (20.3) | 24/106 (22.6) | 50/160 (31.2) |
| tAML | 223/2255 (9.9) | 144/1545 (9.3) | 52/444 (11.7) | 10/106 (9.4) | 17/160 (10.6) |
| ECOG status 0-1 | 1891/2255 (85.4) | 1278/1513 (84.5) | 389/438 (88.8) | 86/104 (82.7) | 138/159 (86.8) |
| HCT-CI score 0-2 | 1746/2263 (77.2) | 1209/1547 (78.2) | 337/447 (75.4) | 75/106 (70.8) | 125/163 (76.7) |
| WBC, ×109/L | |||||
| Mean (SD) | 32.19 (52.86) | 38.65 (56.47) | 20.21 (43.92) | 12.2 (23.86) | 16.3 (39.64) |
| Median (IQR) | 8.00 (2.2-39.23) | 14.12 (2.6-52.75) | 3.8 (1.9-19) | 3.15 (1.76-9.68) | 3.16 (1.7-10.5) |
| HL,* no./no. available (%) | 465/2239 (20.8) | 398/1535 (25.9) | 44/437 (10.1) | 7/106 (6.6) | 16/161 (9.9) |
| LDH,U/L | |||||
| Mean (SD) | 598 (712) | 664 (792) | 463 (485) | 431 (346) | 422 (459) |
| Median (IQR) | 396 (249-654) | 443 (282-724) | 318 (228-514) | 280 (218-505) | 252 (199-483) |
| Bone marrow blasts (%) | |||||
| Mean (SD) | 58.01 (24.81) | 61.91 (24.21) | 52.76 (23.39) | 46.59 (23.45) | 40.72 (23.68) |
| Median (IQR) | 60 (36-80) | 68 (40-81) | 50 (33-70) | 45 (30-66) | 33 (24-60) |
| TDT, d | |||||
| Mean (SD) | 5.65 (6.47) | 2.6 (1.28) | 7.61 (1.32) | 12.75 (1.37) | 24.67 (8.13) |
| Median (IQR) | 3 (2-7) | 2 (2-4) | 8 (6-9) | 13 (11-14) | 22 (18-30) |
| Treatment regimen, no./no. available (%) | |||||
| 7+3 | 2186/2263 (96.6) | 1509/1547 (97.5) | 428/447 (95.7) | 101/106 (95.3) | 148/163 (90.8) |
| HAM | 61/2263 (2.7) | 28/1547 (1.8) | 16/447 (3.6) | 4/106 (3.8) | 13/163 (8) |
| HiDAC/IDAC | 16/2263 (0.7) | 10/1547 (0.6) | 3/447 (0.7) | 1/106 (0.9) | 2/146 (1.2) |
| Allogeneic SCT in CR1 | 440/2263 (19.4) | 304/1547 (19.7) | 90/447 (20.1) | 17/106 (16) | 29/163 (17.8) |
| Allogeneic SCT salvage | 759/2263 (33.5) | 549/1547 (35.5) | 130/447 (29.1) | 30/106 (28.3) | 50/163 (30.7) |
| ELN risk 2017 group, no./no. available (%) | |||||
| Favorable | 546/2049 (26.6) | 410/1401 (29.3) | 98/402 (24.4) | 15/96 (15.6) | 23/150 (15.3) |
| Intermediate | 1104/2049 (53.9) | 724/1401 (51.7) | 217/402 (54) | 59/96 (61.5) | 104/150 (69.3) |
| Adverse | 399/2049 (19.5) | 267/1401 (19.1) | 87/402 (21.6) | 22/96 (22.9) | 23/150 (15.3) |
| Karyotype, no./no. available (%) | |||||
| Abnormal, including complex | 995/2061 (48.3) | 672/1411 (47.6) | 209/404 (51.7) | 47/96 (49) | 67/150 (44.7) |
| Complex | 285/2061 (13.8) | 188/1411 (13.3) | 64/404 (15.8) | 18/96 (18.8) | 15/150 (10) |
| NPM1 mutated | 587/2047 (28.7) | 447/1428 (31.3) | 97/398 (24.4) | 16/89 (18) | 27/132 (20.5) |
| FLT3-ITD mutation | 391/1990 (19.6) | 311/1381 (22.5) | 52/395 (13.2) | 12/90 (13.3) | 16/124 (12.9) |
| FLT3-ITD ratio | |||||
| Mean (SD) | 1.37 (6.35) | 1.37 (6.63) | 1.13 (4.48) | 0.46 (0.34) | 3.15 (8.39) |
| Median (IQR) | 0.5 (0.24-0.8) | 0.52 (0.29-0.82) | 0.37 (0.11-0.6) | 0.39 (0.2-0.76) | 0.46 (0.28-0.66) |
| HU pretreatment, no./no. available (%) | 95/2263 (4.2) | 69/1547 (4.5) | 19/447 (4.3) | 4/106 (3.8) | 3/163 (1.8) |
7+3, induction treatment with standard-dose cytarabine for 7 d and daunorubicin for 3 d; CR1, first complete remission; ECOG, clinical performance status according to ECOG criteria, comorbidities according to HCT-CI score; HAM, high-dose cytarabine plus mitoxantrone; HiDAC/IDAC, high-dose/intermediate-dose cytarabine; IQR, interquartile range; sAML, secondary AML; SD, standard deviation; tAML, treatment-related AML.
HL as defined by WBC >50 × 109/L at initial diagnosis.
Descriptive statistics after grouping of patients into a TDT from 0 to 5, 6 to 10, 11 to 15, and >15 days showed the highest median age, the lowest proportion of nucleophosmin 1 (NPM1) mutated, and the highest proportion of adverse risk in the 11- to 15-days group. WBC, bone marrow blasts, and LDH at diagnosis continuously decrease with increasing TDT, indicating later treatment start in AMLs with lower proliferation characteristics. The lowest proportion of de novo AML was found in the TDT >15-days group. Mutated NPM1 and FLT3–internal tandem duplication (FLT3-ITD) were most frequently found in the TDT 0- to 5-days group. All other parameters were similarly distributed across the TDT groups (Table 1). Generally, induction treatment was very similar in the entire cohort with >95% of patients receiving standard 7+3 induction. In the TDT >15-days group, standard 7+3 induction was slightly less common than in patients with a TDT ≤15 days. HU was used concomitantly in 95 patients (4%) without difference between the TDT groups; the median HU duration was 4 days.
Remission rates
In our cohort, we observed complete hematologic remissions (CR/CR with incomplete count recovery [CRi]) in 78% of all analyzed patients. Unadjusted CR rates in TDT groups 0 to 5, 6 to 10, 11 to 15, and >15 days were 79%, 76%, 72%, and 77%, respectively; the corresponding odds ratios (ORs) for CR in relation to the 0 to 5 group were 0.83, 0.66, and 0.85, respectively (P = .169) (Table 2). No significant differences were observed, neither when TDT was used in a linear logistic model nor when RCS was used (data not shown). In multivariable analysis accounting for the influence of ELN risk, age, WBC, LDH, de novovs secondary AML, comorbidities (expressed as HCT-CI score)9 and ECOG, the OR for each additional day of TDT was 0.99 (95% confidence interval, 0.97-1.01; P = .254). The ORs for CR in the linear multivariable model accounting for influence of other prognostic variables are shown in Table 3. The likelihood ratio test for the multivariable model with and without TDT provided a P value of .260. Multivariable logistic models using TDT as a grouped variable or with RCS did not provide evidence for a significant influence of TDT on the likelihood of remission. The use of HU was not associated with the likelihood of remission (data not shown).
Treatment outcomes CR/CRi, ED, and 2-year OS of all patients stratified for TDT groups and age ≤60 years vs >60 years
| Parameter | All TDTs | TDT, 0-5 d | TDT, 6-10 d | TDT, 11-15 d | TDT, >15 d |
|---|---|---|---|---|---|
| All patients | |||||
| CR/CRi, no./no. available (%) [CI] | 1771/2263 (78.3) [76.5-79.9] | 1229/1547 (79.4) [77.3-81.4] | 341/447 (76.3) [72.1-80.2] | 76/106 (71.7) [62.1-80] | 125/163 (76.7) [69.4-82.9] |
| ED, no./no. available (%) [CI] | 93/2263 (4.1) [3.3-5] | 64/1547 (4.1) [3.2-5.3] | 17/447 (3.8) [2.2-6] | 5/106 (4.7) [1.5-10.7] | 7/163 (4.3) [1.7-8.6] |
| 2-y OS, % [CI] | 50.2 [48.1-52.4] | 51.3 [48.8-54] | 47.5 [43-52.6] | 44.1 [35.1-55.3] | 50.2 [42.9-58.7] |
| Age ≤60 y | |||||
| CR/CRi, no./no. available (%) [CI] | 1048/1212 (86.5) [84.4-88.3] | 771/872 (88.4) [86.1-90.5] | 176/211 (83.4) [77.7-88.2] | 37/47 (78.7) [64.3-89.3] | 64/82 (78) [67.5-86.4] |
| ED, no./no. available (%) [CI] | 31/1212 (2.6) [1.7-3.6] | 20/872 (2.3) [1.4-3.5] | 7/211 (3.3) [1.3-6.7] | 2/47 (4.3) [0.5-14.5] | 2/82 (2.4) [0.3-8.5] |
| 2-y OS, % [CI] | 62.6 [59.8-65.5] | 63.7 [60.5-67.1] | 60.1 [53.6-67.4] | 62.5 [49.7-78.6] | 57.1 [47.1-69.3] |
| Age >60 y | |||||
| CR/CRi, no./no. available (%) [CI] | 723/1051 (68.8) [65.9-71.6] | 458/675 (67.9) [64.2-71.4] | 165/236 (69.9) [63.6-75.7] | 39/59 (66.1) [52.6-77.9] | 61/81 (75.3) [64.5-84.2] |
| ED, no./no. available (%) [CI] | 62/1051 (5.9) [4.6-7.5] | 44/675 (6.5) [4.8-8.7] | 10/236 (4.2) [2.1-7.7] | 3/59 (5.1) [1.1-14.1] | 5/81 (6.2) [2-13.8] |
| 2-y OS, % [CI] | 36 [33.1-39.1] | 35.4 [31.8-39.3] | 36.5 [30.6-43.4] | 30.6 [20.4-45.9] | 43.6 [33.9-56.1] |
ORs for the achievement of CR/CRi, ED, and HRs for OS according to the linear multivariable logistic regression models
| Complete remission | Early death | OS | |||||||
|---|---|---|---|---|---|---|---|---|---|
| OR | 95% CI | P | OR | 95% CI | P | HR | 95% CI | P | |
| TDT | 0.991 | 0.974-1.007 | .254 | 1.005 | 0.971-1.041 | .757 | 1.002 | 0.993-1.011 | .617 |
| ELN risk group | |||||||||
| Intermediate | Reference category | Reference category | Reference category | ||||||
| Favorable | 2.311 | 1.647-3.243 | <.001 | 0.927 | 0.525-1.638 | .795 | 0.578 | 0.491-0.679 | <.001 |
| Adverse | 0.470 | 0.359-0.616 | <.001 | 1.262 | 0.699-2.277 | .440 | 1.600 | 1.861-1.8547 | <.001 |
| Missing | 0.452 | 0.322-0.633 | <.001 | 2.236 | 1.207-4.141 | .011 | 1.410 | 1.175-1.693 | <.001 |
| Age, per 10 y | 0.613 | 0.556-0.676 | <.001 | 1.401 | 1.163-1.689 | <.001 | 1.422 | 1.355-1.492 | <.001 |
| Log2 of WBC in ×109/L | 0.997 | 0.950-1.048 | .916 | 1.081 | 0.975-1.199 | .140 | 1.003 | 0.978-1.029 | .817 |
| Log2 of LDH in U/L | 0.846 | 0.750-0.954 | .006 | 1.027 | 0.810-1.301 | .829 | 1.195 | 1.126-1.269 | <.001 |
| AML status | |||||||||
| De novo | Reference category | Reference category | Reference category | ||||||
| sAML | 0.714 | 0.538-0.949 | .020 | 0.577 | 0.278-1.195 | .138 | 1.221 | 1.049-1.421 | .009 |
| tAML | 0.804 | 0.567-1.140 | .221 | 1.184 | 0.630-2.226 | .600 | 1.358 | 1.130-1.631 | .001 |
| Missing | 0.729 | 0.157-3.394 | .687 | 2.619 | 0.301-22.82 | .383 | 1.291 | 0.533-3.123 | .572 |
| ECOG 0-1 | 1.610 | 1.209-2.143 | .001 | 0.497 | 0.304-0.811 | .005 | 0.779 | 0.669-0.907 | .001 |
| HCT-CI >2 | 0.802 | 0.622-1.034 | .088 | 1.315 | 0.810-2.135 | .269 | 1.123 | 0.981-1.285 | .093 |
ORs: 95% confidence intervals and P values for Wald test.
See Table 1 for expansion of abbreviations.
ED
A total proportion of 4.1% of patients died within the first 30 days from treatment start. The respective rates in the 4 TDT categories were 4.1%, 3.8%, 4.7%, and 4.3% (P = .974) (Table 2). The corresponding ORs for ED in relation to the 0 to 5 group were 0.92, 1.15, and 1.04 for TDTs of 6 to 10, 11 to 15, and >15 days (P = .974). No significant differences were observed when TDT was used in a linear logistic model nor when RCS was used (data not shown). In multivariable analysis accounting for the influence of the established risk factors, the OR for TDT was 1.01 (95% confidence interval, 0.97-1.04; P = .757). The ORs for ED according to the linear multivariable model are shown in Table 3. The likelihood ratio test for the multivariable model with and without TDT provided a P value of .761. Multivariable logistic models using TDT as a grouped variable or with RCS did not provide evidence for a significant influence of TDT on the likelihood of ED. The use of HU was not associated with the likelihood of ED (data not shown).
OS
After a median follow-up of 42 months (IQR, 25-60), the 2-year OS rate of all patients was 50%. The unadjusted 2-year OS rates stratified by TDT of 0 to 5, 6 to 10, 11 to 15, and >15 days were 51%, 48%, 44%, and 50% (Table 2; Figure 2). In univariable analysis, the hazard ratio (HR) for each day of treatment delay was 1.00 (95% confidence interval, 1.00-1.01; P = .211). In multivariable Cox regression analysis accounting for the influence of ELN risk, age, WBC, LDH, de novo vs secondary AML, HCT-CI, and ECOG, the HR for TDT as continuous variable was 1.00 (95% confidence interval, 0.99-1.01; P = .617). The HRs for survival according to the linear multivariable Cox regression model are shown in Table 3. The likelihood ratio test for the multivariable model with and without TDT provided a P value of .678. Multivariable Cox regression models using TDT as a grouped variable or with RCS did not provide evidence for a significant influence of TDT on OS. After propensity score weighting of patients in the 4 TDT groups, adjusting for imbalances in prognostic variables between the groups, the HR of TDT in the linear model was 1.01 (95% confidence interval, 0.99-1.02; P = .317), and the pattern of OS curves was similar to nonweighted Kaplan-Meier estimates (supplemental Figure 2).
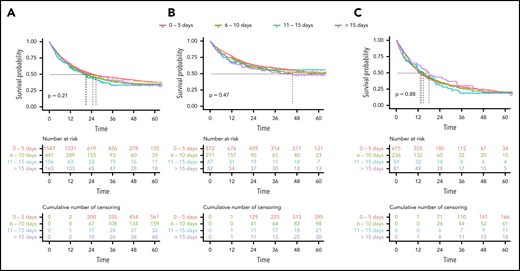
Kaplan-Meier estimates of OS according to the 4 TDT groups. (A) For all patients. (B) In patients ≤60 years. (C) In patients >60 years.
Kaplan-Meier estimates of OS according to the 4 TDT groups. (A) For all patients. (B) In patients ≤60 years. (C) In patients >60 years.
To investigate the influence of high initial WBCs (HL) and TDT on survival, we looked at differences in the TDT strata separately in patients with a WBC of >50 vs ≤50 × 109/L in a univariable Kaplan-Meier analysis. Two-year OS of all patients in the HL group and non-HL group was 48% and 51% (P = .387). We did not observe significant differences in survival between TDT groups, neither in the HL group nor in the non-HL group, however, HL was rare (44, 7, and 16 patients) in the groups with longer TDT (supplemental Figure 3). For multivariable analyses, we introduced an interaction term for TDT and HL in the multivariable Cox models. The interaction term did not significantly improve the quality of the model, indicating that the presence of HL did not significantly affect the influence of TDT on survival results (data not shown).
The use of HU was not associated with OS (data not shown).
Discussion
In the clinical management of newly diagnosed AML, the general recommendation is to start treatment immediately after the diagnosis is established. This paradigm is based both on the observation that untreated acute leukemia has a poor prognosis and analyses demonstrating a shorter OS in patients with delayed treatment start.
The ECOG study in 362 AML patients older than 55 years showed a significantly lower CR rate in patients with a treatment delay, but no difference in OS.10 The generalizability of these findings may be limited by the fact that the ECOG study did not enroll patients with secondary AML (sAML) and the influence of treatment delay on CR rates was not investigated in multivariable models. A second retrospective study on 1317 patients from the Cleveland Clinic and the MD Anderson Cancer Center including sAML did not find a difference in remission rates or OS depending on TDT in 664 older AML patients (≥60 years of age), neither in univariable nor multivariable analyses. However, CR rates and OS were found to be significantly lower in younger patients in whom treatment was delayed by 5 or more days. This effect was observed both in univariable and multivariable analyses and with grouped TDT and continuous TDT.2 For this analysis, patients with WBC >50 × 109/L were excluded, the proportion of sAML was unusually high, and induction regimens were heterogeneous. The third work addressing the issue of TDT and prognosis was based on 599 AML patients treated at a single center in Toulouse with intensive induction consisting of standard-dose cytarabine plus either daunorubicin or idarubicin followed by a fixed postremission algorithm consisting of allogeneic stem cell transplantation or high-dose cytarabine/autologous stem cell transplantation in younger patients or idarubicin-cytarabine maintenance in patients >60 years. The proportion of sAML was 20% and patients with a high initial WBC were not excluded. The analysis confirmed the finding that in elderly patients, TDT is not related to prognosis. However, in contrast to previous data, in younger AML patients, treatment delay was not associated with an inferior prognosis either. This finding was consistent across univariable and multivariable analyses.3
Possible reasons why TDT did not affect remission and survival in our cohort may include the fact that disease with signs of high proliferation seemed to have been treated earlier, as indicated by shorter TDT in patients with high WBC, high blast count, high LDH. In addition, the use of HU can delay or prevent complications associated the high WBC counts, and advanced supportive care including the use of broad-spectrum prophylactic antibiotics and antifungals reduce the risk of infectious complications. A second important reason why TDT has no prognostic influence may be the fact that leukemia-specific biologic prognostic factors are stronger determinants of response to treatment and relapse risk such as age and genetic alterations. This fact is shown in the multivariable models for remission and survival, which indicate a significant influence of age and genetics, whereas TDT has no impact.
Based on these considerations, another interpretation of the data is that rather than TDT not mattering, it does in fact matter: however, clinicians are excellent at determining who needs urgent treatment and who can (even should) wait. Although it may be most beneficial to start treatment early in patients with disease-related complications, more stable or older patients may benefit from delay in order to undergo “medical optimization” and/or further medical evaluation of comorbidity before treatment assignment.
To our knowledge, our study on 2263 newly diagnosed registry patients receiving consistent intensive induction with standard-dose cytarabine plus daunorubicin (7+3) represents the largest analysis thus far performed. It confirms the finding that TDT is not related to response or survival prognosis, neither in younger nor in older patients. The robustness of this finding has been tested in univariable and multivariable models, with TDT as a continuous variable, grouped according to clinically meaningful day intervals and by using RCS models. Our results are based on retrospective data, which may introduce bias, and require caution in interpretation. The results do not allow a conclusion on patients who may have become ineligible for intensive treatment after diagnosis was made. However, it is unlikely that a randomized trial will ever address the effect of TDT in a prospective manner, and we have accounted for all known possible confounders in multivariable analysis in order to reduce bias to a minimum. We used real-world data, which improve the generalizability of the findings beyond the setting in a clinical trial but at the same time make it difficult to define the exact reasons for delay in treatment. We did not exclude patients with a HL because not all patients with HL develop a leukostasis syndrome,11 and most patients respond well to oral HU.12 In our cohort, physicians obviously tried to avoid treatment delay in HL patients as well as in patients with high LDH or bone marrow blast count. HU was used in 11% of patients with HL vs 2% in patients with WBC ≤50 × 109/L. HU treatment did not influence outcome, but most likely resulted in comparable outcomes in patients with and without HL.
Our results are in line with the analysis by Bertoli et al, based on a similar patient cohort, who confirm the lack of prognostic impact of TDT in elderly AML described by Sekeres et al.2,3 Based on the available information, we assume that the different cohort composition regarding sAML and WBC, heterogeneity in induction regimens, and possibly wider availability of antifungal prophylaxis and anti-infective treatments more recently could explain the differences regarding the influence of TDT on prognosis in younger patients.
In conclusion, our results provide further evidence that in newly diagnosed AML patients, the time from diagnosis to treatment does not affect the likelihood of response, ED, or long-term survival, although it may be advisable to initiate a bridging therapy, for example, with HU in the subset of patients with HL or other signs of highly proliferative disease. In the context of newly approved treatment options, this finding has direct clinical implications. Whereas gemtuzumab ozogamicin seems to be most efficacious in favorable- and intermediate-risk AML,13 midostaurin should be used in FLT3-mutated AML,14 and CPX-351 is only approved for treatment-related AML and AML with myelodysplasia-related changes.15 As treatment stratification in intensive first-line treatment of AML evolves, the TDT data suggest that it may be a safe and reasonable approach to wait for genetic and other laboratory test results in order to assign patients to the best available treatment option before the start of intensive treatment.
In general, AML potentially remains an oncological emergency with a need for immediate action, in particular if coagulopathy, leukostasis, or neutropenic fever are present, and unnecessary delays in treatment of AML should be avoided. However, for patients with an adequate performance status and no signs of organ dysfunction, our results suggest that a certain delay in treatment other than HU has no negative consequences, neither in terms of response, early mortality, nor survival.
Presented in part as an oral presentation at the 61st annual meeting of the American Society of Hematology, Orlando, FL, 7-10 December 2019.
For original data, please e-mail the corresponding author.
The online version of this article contains a data supplement.
The publication costs of this article were defrayed in part by page charge payment. Therefore, and solely to indicate this fact, this article is hereby marked “advertisement” in accordance with 18 USC section 1734.
Acknowledgments
The authors thank Annett Engmann and Katrin Peschel for their outstanding contribution to project management, all patients and caretakers for their support of the trial, and all SAL centers for their commitment in the registry.
Authorship
Contribution: C.R. and M. Kramer designed the study; C.R., M. Kramer, and J.S. performed the statistical analysis; and all authors recruited and treated patients, acquired and interpreted the data, drafted and reviewed the report, gave their final approval for publication, and agreed to be accountable for all aspects of the work.
Conflict-of-interest disclosure: The authors declare no competing financial interests.
Correspondence: Christoph Röllig, Medizinische Klinik und Poliklinik I, Universitätsklinikum TU Dresden, Fetscherstr 74. 01307 Dresden, Germany; e-mail: christoph.roellig@ukdd.de.

This feature is available to Subscribers Only
Sign In or Create an Account Close Modal