

Key Points
Choline-derived or orally administered gut microbial metabolite TMAO aggravates GVHD.
TMAO enhances M1 macrophage polarization via NLRP3 inflammasome activation.

Abstract
The diversity of the human microbiome heralds the difference of the impact that gut microbial metabolites exert on allogenic graft-versus-host (GVH) disease (GVHD), even though short-chain fatty acids and indole were demonstrated to reduce its severity. In this study, we dissected the role of choline-metabolized trimethylamine N-oxide (TMAO) in the GVHD process. Either TMAO or a high-choline diet enhanced the allogenic GVH reaction, whereas the analog of choline, 3,3-dimethyl-1-butanol reversed TMAO-induced GVHD severity. Interestingly, TMAO-induced alloreactive T-cell proliferation and differentiation into T-helper (Th) subtypes was seen in GVHD mice but not in in vitro cultures. We thus investigated the role of macrophage polarization, which was absent from the in vitro culture system. F4/80+CD11b+CD16/32+ M1 macrophage and signature genes, IL-1β, IL-6, TNF-α, CXCL9, and CXCL10, were increased in TMAO-induced GVHD tissues and in TMAO-cultured bone marrow–derived macrophages (BMDMs). Inhibition of the NLRP3 inflammasome reversed TMAO-stimulated M1 features, indicating that NLRP3 is the key proteolytic activator involved in the macrophage’s response to TMAO stimulation. Consistently, mitochondrial reactive oxygen species and enhanced NF-κB nuclear relocalization were investigated in TMAO-stimulated BMDMs. In vivo depletion of NLRP3 in GVHD recipients not only blocked M1 polarization but also reversed GVHD severity in the presence of TMAO treatment. In conclusion, our data revealed that TMAO-induced GVHD progression resulted from Th1 and Th17 differentiation, which is mediated by the polarized M1 macrophage requiring NLRP3 inflammasome activation. It provides the link among the host choline diet, microbial metabolites, and GVH reaction, shedding light on alleviating GVHD by controlling choline intake.
Introduction
The application of allo–hematopoietic stem cell transplantation (HSCT; allo-HSCT) is limited due to severe graft-versus-host (GVH) disease (GVHD), which is the principal cause of nonrelapse mortality.1,2 Conditioning regimens in allo-HSCT cause host tissue injuries and activate host antigen-presenting cells, mainly including macrophages and dendritic cells, to present host antigens to donor T cells and produce T-cell–stimulating cytokines.3 The expanded alloreactive T cells in turn attack host organs including skin, liver, and gut as well as the hematopoietic system, leading to organ damage and dysfunction.4
Gut microbial metabolites have been reported to trigger inflammatory responses and correlate with inflammatory associated diseases.5-7 Changes in the composition of gut microbiota are linked with pathologic processes,8 in which the gut microbiome generates a wide range of bioactive metabolites serving as a mediator of microbial influence on the hosts.9,10 Thus, the gut microbiome, like an endocrine organ, communicates with distal organs via metabolism-dependent pathways, which has a pervasive effect on various host physiological or pathological events.7,11
Recent studies have uncovered that microbial metabolic short-chain fatty acids (SCFAs) protected intestinal epithelial cells from alloreactive T-cell–mediated damage after allo-HSCT.12 The administration of butyrate was able to prolong the survival of mice with GVHD.12 Gut tryptophan-produced indole was additionally demonstrated to protect against GVHD in a mouse model via type I interferon signaling.13
In fact, the diversity of the human microbiome and metabolome far exceeds the complexity of the human genome.14 Choline, phosphatidylcholine, and carnitine-containing dietary ingredients that are high in eggs, livers, dairy products, peanuts, etc, can be metabolized into trimethylamine (TMA) and subsequently converted by host hepatic flavin monooxygenases into TMA N-oxide (TMAO).15 It has been reported that TMAO, as another circulating intestinal microbial metabolite, was able to induce vascular inflammation and endothelial dysfunction by formation and activation of NLRP3 inflammasomes in endothelial cells.16 Notably, a structural analog of choline, 3,3-dimethyl-1-butanol (DMB), was shown to nonlethally inhibit TMA formation and reduce TMAO concentration in the mice fed a high-choline diet,17 suggesting that DMB may serve as a potential therapeutic approach for TMAO-stimulated inflammatory disease.18,19 However, whether TMAO influences the pathophysiology process of GVHD remains largely unknown.
In our study, we clarified that TMAO enhanced M1 macrophage polarization via NLRP3 inflammasome activation. The polarized inflammatory macrophages set up the environment for a potent T-helper type 1 (Th1) and Th17 response, which aggravates GVH reaction (GVHR).
Materials and methods
Bone marrow transplantation
C57BL/6 (B6, H-2b) and BALB/c (H-2d) mice were purchased from Shanghai Jie Si Jie Laboratory Animal Ltd. B6-background Nlrp3-knockout (Nlrp3−/−) mice were purchased from Cavens Laboratory Animal Ltd. All age-matched male mice (8-12 weeks old) were used for bone marrow (BM) transplantation (BMT) experiments. The animal protocol was approved by the Ethical Committee of Animal Experiments of the School of Pharmacy, Fudan University (2014-09-HSYY-CT-01). A detailed transplantation scheme was described in supplemental Materials and methods (available on the Blood Web site).
16S quantitative PCR for quantification of bacterial DNA
16S ribosomal RNA (rRNA) sequencing was performed to classify bacterial DNA, which was isolated from fecal microbiome. Quantitative polymerase chain reaction (PCR) of the bacterial 16S rRNA gene V4-V5 region was performed using the forward primer 515F (5′-GTGCCAGCMGCCGCGGTAA-3′) and the reverse primer 907R (5′-CCGTCAATTCMTTTRAGTTT-3′). The data from the 16S rRNA gene sequence were analyzed using Microbial Ecology20 (QIIME v1.8.0) and R (v3.2.0) software packages.
BMDM differentiation
Murine BM-derived macrophages (BMDMs) were differentiated from fresh BM cells of C57BL/6 wild-type (WT) or Nlrp3−/− mice in Dulbecco modified Eagle medium (DMEM) containing 10% heat-inactivated fetal bovine serum in the presence of 200 ng/mL granulocyte macrophage colony-stimulating factor (Beyotime) for 5 days, with the medium replacement every other day. The media were changed to DMEM containing 10% heat-inactivated fetal bovine serum without granulocyte macrophage colony-stimulating factor 12 hours before TMAO (300 μM) or vehicle treatments. In some experiments, BMDMs were incubated in the presence of Mito-Tempo (100 μM; Sigma-Aldrich), triptolide (20 nM; MedChemExpress), or CY-09 (1 μM; MedChemExpress) with TMAO (300 μM) for 24 hours.
Caspase-1–activity assay
Caspase-1 activity was measured by the colorimetric assay (Beyotime), which is based on the ability of caspase-1 to change acetyl-Tyr-Val-Ala-Asp p-nitroaniline (Ac-YVAD-pNA) into the formazan product p-nitroaniline (pNA). Fifty microliters of total cytosolic protein was incubated with 20 nmol Ac-YVAD-pNA at 37°C for 1 hour. The absorbance values of pNA at 405 nm were tested by using a spectrophotometer (Thermo Fisher Scientific Inc).
T-cell–function assessment
Splenic cells from C57BL/6 mice were grinded through a 40-μm nylon cell strainer, washed, and stained with antibodies against CD4 or CD8 (BioLegend). Purified CD4+ and CD8+ T cells were activated with plate-bound anti-CD3 (0.25 μg/mL; eBioscience) and anti-CD28 (0.25 μg/mL; eBioscience) in T-cell culture media (DMEM; HyClone) for 24 hours, and treated with TMAO (300 μM) or vehicle for an additional 24 hours. The messenger RNA (mRNA) expression of STAT3, STAT4, STAT6, T-bet, interleukin-4 (IL-4), and RORγt in CD4+ T cells and IL-2, IL-5, tumor necrosis factor-α (TNF-α), and interferon-γ (IFN-γ) in CD8+ T cells was determined. 5-Bromo-2′-deoxyuridine (BrdU) incorporation was to measure T-cell proliferation using the BrdU labeling and detection kit III (Sigma-Aldrich).
Mass spectrometry quantification of TMAO
Stable isotope dilution liquid chromatography–tandem mass spectrometry (Q Exactive Orbitrap; Thermo Fisher Scientific Inc) was used for quantification of serum TMAO concentration.15 Various concentrations of TMA-d9 N-oxide standards (Toronto Research Chemicals) were prepared for the calibration curves to quantify serum TMAO concentration.
Flow cytometry analysis
Staining of MitoSOX (Yeasen), MitoTracker Green (Beyotime), and MitoTracker Red CMXRos (Beyotime) in BMDMs were performed according to the manufacturer’s instructions. In brief, BMDMs were stained with MitoSOX Red mitochondrial superoxide indicator for 10 minutes or with MitoTracker for 30 minutes. For cell surface antigen staining, splenic cells were stained with fluorescein isothiocyanate–CD11b, phycoerythrin-F4/80, and peridinin chlorophyll protein–Cy5.5-CD16/32 (BioLegend) at 4°C for 30 minutes. Data were acquired within 2 hours after staining on an LSR Fortessa (BD Biosciences), and analysis was performed by using FlowJo software.
In vivo imaging of skull BM and spleen
Intravital microscopy was performed by using a Leica SP8 confocal microscope with a motorized stage. Fluorescence images were visualized with a Leica HCX IRAPO L×20 water-immersion lens. Internal detectors were used to collect green fluorescent protein (GFP), tdTomato, and Cy5 signals. Surgery was performed as previously described for skull BM imaging21 and spleen imaging.22 Large “tile scans” of the entire BM cavity space were acquired by stitching adjacent images together. Blood vessels were labeled by tail-vein injection of 50 μL of 8 mg/mL Cy5-dextran (500 kDa; Yuanye Biology).
Immunofluorescence detection
Murine tibias, ileum, colon, liver, and skin were harvested and fixed overnight in periodate-lysine-paraformaldehyde fixative. The fixed tissue or cells were stained with anti-CD3 (1:100; Abcam), tdTomato-recognizable anti–red fluorescent protein (1:200; Abcam), anti-F4/80 (1:300; Abcam), anti–inducible NO synthase (iNOS) (1:800; Abcam), anti-NLRP3 (1:100; Adipogen), anti–apoptosis-associated speck-like protein containing a CARD (ASC) (1:100; Affinity Biosciences), anti–NF-κB (1:100; Proteintech), and anti–p-NF-κB (1:50; Affinity Biosciences). MitoSOX and JC-1 staining was performed according to the manufacturer’s instructions (Beyotime, China). The detailed protocol is addressed in supplemental Materials and methods.
Statistical analysis
All experiments were repeated at least 2 or 3 times independently. Detailed reproducibility and sample sizes are indicated in the figure legends. The data are presented as mean plus or minus standard deviation or quartile measurement. Statistical analyses were carried out using 1-way analysis of variance, followed by the Tukey post hoc test or the Student t test using GraphPad Prism software. Nonparametric murine survival data were analyzed using log-rank statistics. Difference was considered statistically significant at P < .05.
Results
TMAO aggravated the severity and mortality of GVHD mice
To determine whether TAMO would affect GVHD severity, recipient mice were given TMAO 2 weeks prior to lethal irradiation to get serum TMAO elevated (Figure 1A). Compared with T-cell–depleted (TCD)-BM (BMT) recipients, the serum TMAO concentration was higher in recipients transfused with TCD-BM and splenic CD3+ T cells (TCD-BM+T, GVHD, 7.11 μM vs 16.8 μM), and the daily oral TMAO treatment significantly increased the serum TMAO concentration either in BMT mice or in GVHD mice (Figure 1B). In TMAO-treated TCD-BM+T recipients, the survival rate and GVHD scores were significantly worse than those in vehicle-treated GVHD mice (Figure 1C-D). On day14, the histopathological image showed more severe damage to GVHD-target tissues (Figure 1E) and increased histological scores in ileum, colon, skin, and liver (Figure 1F) in TMAO-treated GVHD recipients. In the representative tissue image from TMAO-treated TCD-BM+T recipients, increased crypt loss and ulceration were seen in ileum and colon tissues. More severe liver cytoplasmic vacuolation and increased collagen density as well as serous fat atrophy in skin were detected (Figure 1E; supplemental Figure 1A). These data indicated that TMAO aggravates the severity of T-cell–induced GVHR in allogenic HSCT.
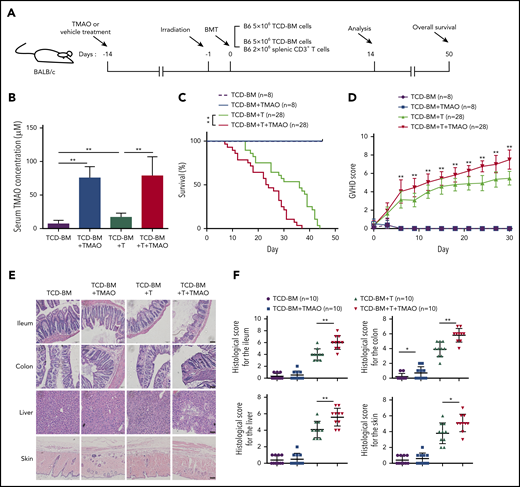
TMAO aggravated the severity and mortality of GVHD mice. (A) Experimental scheme of BMT or GVHD protocol. BALB/c recipients were fed with TMAO or vehicle from day −14 and, thereafter, lethally irradiated on day −1, and infused with C57BL/6 donor cells on day 0. The mice were injected with 5 × 10⁶ TCD-BM cells or 5 × 10⁶ TCD-BM cells and 2 × 10⁶ splenic CD3+ T cells, respectively. The data were collected on day 14 except for the survival curve analysis on day 50. (B) Serum TMAO concentration was determined on day 14 in BMT mice (TCD-BM) and GVHD mice (TCD-BM+T), with or without TMAO treatment. Data were pooled from 3 independent experiments. N = 8 in each group. **P < .01. (C) Kaplan-Meier survival curve was determined in BMT mice (n = 8) or in GVHD mice (n = 28). Graph represents pooled data from 2 (BMT) or 3 (GVHD) independent experiments, in the presence or absence of TMAO treatment. **P < .01. (D) GVHD scores were analyzed in BMT mice (n = 8) or GVHD mice (n = 28). Graph represents pooled data from 2 (BMT) or 3 (GVHD) independent experiments, in the presence or absence of TMAO treatment. **P < .01. (E) Representative hematoxylin-and-eosin (H&E) tissue staining of ileum, colon, skin, and liver from BMT mice or GVHD mice. Scale bar, 200 μm. (F) Histologic analyses of GVHD features in paraffin-sectioned ileum, colon, skin, and liver tissue were performed on BMT mice or GVHD mice, with or without TMAO treatment. N = 10 in each group. The pooled data were from 3 independent experiments. *P < .05; **P < .01.
TMAO aggravated the severity and mortality of GVHD mice. (A) Experimental scheme of BMT or GVHD protocol. BALB/c recipients were fed with TMAO or vehicle from day −14 and, thereafter, lethally irradiated on day −1, and infused with C57BL/6 donor cells on day 0. The mice were injected with 5 × 10⁶ TCD-BM cells or 5 × 10⁶ TCD-BM cells and 2 × 10⁶ splenic CD3+ T cells, respectively. The data were collected on day 14 except for the survival curve analysis on day 50. (B) Serum TMAO concentration was determined on day 14 in BMT mice (TCD-BM) and GVHD mice (TCD-BM+T), with or without TMAO treatment. Data were pooled from 3 independent experiments. N = 8 in each group. **P < .01. (C) Kaplan-Meier survival curve was determined in BMT mice (n = 8) or in GVHD mice (n = 28). Graph represents pooled data from 2 (BMT) or 3 (GVHD) independent experiments, in the presence or absence of TMAO treatment. **P < .01. (D) GVHD scores were analyzed in BMT mice (n = 8) or GVHD mice (n = 28). Graph represents pooled data from 2 (BMT) or 3 (GVHD) independent experiments, in the presence or absence of TMAO treatment. **P < .01. (E) Representative hematoxylin-and-eosin (H&E) tissue staining of ileum, colon, skin, and liver from BMT mice or GVHD mice. Scale bar, 200 μm. (F) Histologic analyses of GVHD features in paraffin-sectioned ileum, colon, skin, and liver tissue were performed on BMT mice or GVHD mice, with or without TMAO treatment. N = 10 in each group. The pooled data were from 3 independent experiments. *P < .05; **P < .01.
DMB decreased high-choline-diet–produced TMAO and reduced tissue damage in choline-fed GVHD mice
To assess the impact of a high-choline diet on GVHD severity, mice were fed with the control diet or a choline-supplemented diet from day −14 and, thereafter, in the presence or absence of DMB in drinking water (Figure 2A). The choline diet markedly increased serum TMAO concentration in GVHD mice from 16.59 μM to 62.14 μM, yet the addition of DMB to the drinking water significantly reduced the serum TMAO concentration to 22.27 μM (Figure 2B). The TCD-BM+T recipients on a choline-supplemented diet showed a significantly shortened survival curve (Figure 2C) and increased GVHD rating scores (Figure 2D; *P < .05, **P < .01, TCD-BM+T vs TCD-BM+T+choline). Remarkably, oral DMB decreased the choline-induced GVHD severity (Figure 2C-D; #P < .05, ##P < .01, TCD-BM+T+choline vs TCD-BM+T+choline+DMB). However, DMB treatment had no significant effects on GVHD severity and survival curve in the absence of choline supplementation (Figure 2C-D). Moreover, histopathological analysis on day 14 showed more severe GVHD in the organs of choline-fed mice (Figure 2E) with increased histological scores in ileum, colon, skin, and liver (Figure 2F), whereas DMB replacement in drinking water prevented the choline-enhanced histopathological damage (Figure 2E-F). In the representative image from DMB-treated choline-fed GVHD mice, tissues from ileum and colon showed decreased ulceration, where the inflammatory cells in liver were seen less infiltrated, and the follicles and adipocytes in skin were restored (Figure 2E; supplemental Figure 2A). Our results indicated that the increased severity of GVHD seen on a choline diet is related to generation of TMAO.

DMB decreased high-choline-diet–produced TMAO and reduced tissue damage in choline-fed GVHD mice. (A) Experimental scheme of BMT mice and GVHD mice protocol. BALB/c recipients were fed with DMB, choline-containing diet, or choline+DMB from day −14 and, thereafter, lethally irradiated on day −1, and transfused with C57BL/6 donor cells on day 0. The data were collected on day 14 except for the survival curve analysis on day 50. (B) Serum TMAO concentration was determined in GVHD mice fed with DMB, choline, or choline and DMB diet. Data were pooled from 3 independent experiments. N = 7 in each group. **P < .01. (C) Kaplan-Meier survival curve was determined in GVHD mice with vehicle (n = 25), DMB (n = 20), choline (n = 25), or choline+DMB diet (n = 25). Graph represents pooled data from 2 (DMB) or 3 (vehicle, choline, choline+DMB) independent experiments. **P < .01 (TCD-BM+T vs TCD-BM+T+choline). ##P < .01 (TCD-BM+T+choline vs TCD-BM+T+choline+DMB). (D) GVHD score was determined in GVHD mice treated with vehicle (n = 25), DMB (n = 20), choline (n = 25), or choline+DMB (n = 25). Graph represents pooled data from 2 (DMB) or 3 (vehicle, choline, choline+DMB) independent experiments. *P < .05, **P < .01 (TCD-BM+T vs TCD-BM+T+choline). #P < .05, ##P < .01 (TCD-BM+T+choline vs TCD-BM+T+choline+DMB). (E) Representative H&E staining of ileum, colon, skin, and liver tissues from GVHD mice fed with choline, DMB, or choline and DMB diet. Scale bar, 200 μm. (F) Histologic analyses of paraffin-sectioned ileum, colon, skin, and liver tissues from GVHD mice were performed on day 14. *P < .05, **P < .01. Data were pooled from 3 independent experiments. N = 10 in each group. (G) Bacterial diversity of fecal microbiota from GVHD mice with high-choline diet or control diet was analyzed. N = 6 in each group. (H) Principal coordinate analysis distances of the fecal microbiota communities between high-choline diet and chow diet in GVHD mice. N = 6 in each group. (I) Linear discriminant analysis coupled with effect size measurements to identify gut microbial taxa in GVHD mice fed with high-choline diet or control diet. N = 6 in each group. ns, not significant; PC, principal component.
DMB decreased high-choline-diet–produced TMAO and reduced tissue damage in choline-fed GVHD mice. (A) Experimental scheme of BMT mice and GVHD mice protocol. BALB/c recipients were fed with DMB, choline-containing diet, or choline+DMB from day −14 and, thereafter, lethally irradiated on day −1, and transfused with C57BL/6 donor cells on day 0. The data were collected on day 14 except for the survival curve analysis on day 50. (B) Serum TMAO concentration was determined in GVHD mice fed with DMB, choline, or choline and DMB diet. Data were pooled from 3 independent experiments. N = 7 in each group. **P < .01. (C) Kaplan-Meier survival curve was determined in GVHD mice with vehicle (n = 25), DMB (n = 20), choline (n = 25), or choline+DMB diet (n = 25). Graph represents pooled data from 2 (DMB) or 3 (vehicle, choline, choline+DMB) independent experiments. **P < .01 (TCD-BM+T vs TCD-BM+T+choline). ##P < .01 (TCD-BM+T+choline vs TCD-BM+T+choline+DMB). (D) GVHD score was determined in GVHD mice treated with vehicle (n = 25), DMB (n = 20), choline (n = 25), or choline+DMB (n = 25). Graph represents pooled data from 2 (DMB) or 3 (vehicle, choline, choline+DMB) independent experiments. *P < .05, **P < .01 (TCD-BM+T vs TCD-BM+T+choline). #P < .05, ##P < .01 (TCD-BM+T+choline vs TCD-BM+T+choline+DMB). (E) Representative H&E staining of ileum, colon, skin, and liver tissues from GVHD mice fed with choline, DMB, or choline and DMB diet. Scale bar, 200 μm. (F) Histologic analyses of paraffin-sectioned ileum, colon, skin, and liver tissues from GVHD mice were performed on day 14. *P < .05, **P < .01. Data were pooled from 3 independent experiments. N = 10 in each group. (G) Bacterial diversity of fecal microbiota from GVHD mice with high-choline diet or control diet was analyzed. N = 6 in each group. (H) Principal coordinate analysis distances of the fecal microbiota communities between high-choline diet and chow diet in GVHD mice. N = 6 in each group. (I) Linear discriminant analysis coupled with effect size measurements to identify gut microbial taxa in GVHD mice fed with high-choline diet or control diet. N = 6 in each group. ns, not significant; PC, principal component.
We thus analyzed whether a high-choline diet in GVHD mice would change the gut microbiota. Interestingly, no significant differences on bacterial diversity and richness were seen between high-choline–fed mice and control diet–fed mice (Figure 2G). Principal coordinate analysis of distances (Figure 2H) and fecal bacterial communities (supplemental Figure 2B) were similar in both groups. Among them, 9 gut microbial taxa were identified in 2 groups by linear discriminant analysis coupled with effect size measurements, where Anaeroplasmatales, Anaeroplasmataceae, and Anaeroplasma were decreased in choline-fed mice, and Deferribacterales, Deferribacteres, Mucispirillum, Deferribacteraceae, Deferribacteres, and AF12 were increased in control diet–fed mice (Figure 2I).
Th1 and Th17 differentiation was seen in TMAO-fed GVHD mice but not in a TMAO-supplemented in vitro culture system
We then sought to explore the potential mechanisms contributing to TMAO-induced exacerbation in GVHD. First, as BM and spleen are hematolymphoid organs and GVHD targets,23-25 allogenic intra-BM and intraspleen T-cell infiltrations were analyzed. By intravital fluorescence imaging of the skull BMs, enhanced GFP+ (eGFP+) TCD-BM cells were found to engraft into BM on day 7 either in vehicle-fed mice or in TMAO-fed mice, and grew as a massive colony on day 14 (Figure 3A-B). However, in GVHD mice infused with TCD-BM and T cells, tdTomato+ T cells (red) were found competitively homing into BM at the expense of decreased BM cell engraftment (Figure 3B bottom panel). Oral treatment of TMAO significantly enhanced intravital tdTomato+ T-cell growth and reduced eGFP+ BM cell proliferation in GVHD mice during 2 weeks of follow-up (supplemental Figure 3A-B), where the fluorescence difference was not so significant in the mice infused with TCD-BM cells only (Figure 3B). This TMAO-enhanced T-cell infiltration within BM was also confirmed by ex vivo immunofluorescence imaging (Figure 3C; supplemental Figure 3C) and fluorescence-activated cell sorter (FACS) analysis of femur samples (supplemental Figure 3D).
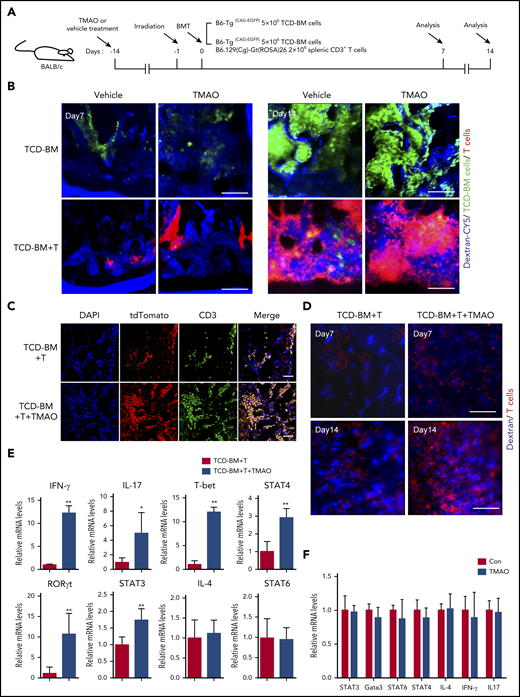
Th1 and Th17 differentiation was seen in TMAO-fed GVHD mice but not in the TMAO-supplemented in vitro culture system. (A) Experimental scheme of BMT mice or GVHD mice protocol. Recipients were fed with TMAO or vehicle from day −14 and thereafter. Data were collected on day 7 and day 14. (B) Representative in vivo fluorescence image of skull BM in recipient mice on day 7 and day 14. The BALB/c recipients were injected with B6-Tg(CAG-EGFP) TCD-BM cells to generate the BMT model or B6-Tg(CAG-EGFP) TCD-BM cells and B6.129(Cg)-Gt(ROSA)26Sortm4(ACTB-tdTomato-EGFP)/Nju (mT/mG) splenic CD3+ T cells to generate GVHD mice. Grafted tdTomato+ T cells (red) and GFP+ TCD-BM cells (green) were detected. The intravital vessels were stained with dextran-Cy5 (blue) by tail vein injection. Scale bar, 200 μm. (C-E) TCD-BM cells from C57BL/6 mice with splenic T cells from B6.129(Cg)-Gt(ROSA)26Sortm4(ACTB-tdTomato-EGFP)/Nju (mT/mG) mice were coinjected IV into lethally irradiated BALB/c mice. (C) Representative image of the allogeneic tdTomato+ T cells in murine femurs stained with tdTomato-recognizable anti–red fluorescent protein (red, Alexa Fluor 594) antibody and anti-CD3 (green, Alexa Fluor 488) antibody. The cellular nuclei were stained by 4′,6-diamidino-2-phenylindole (DAPI). Scale bar, 100 μm. (D) Representative in vivo intravital image of recipients’ spleen on day 7 and day 14. Grafted tdTomato+ T cells (red) and vasculature (blue) were imaged in the presence or absence of TMAO treatment. Scale bar, 200 μm. (E) The mRNA expression of IFN-γ (n = 6), IL-4 (n = 6), IL-17 (left to right column, n = 5, 4), T-bet (n = 6), RORγt (left to right column, n = 5, 6), and STAT3 (n = 6), STAT4 (n = 4), STAT6 (n = 7) in allogenic splenic tdTomato+ T cells were determined. The T cells were isolated from GVHD spleen on day 14 with or without TMAO treatment. Data were pooled from 2 independent experiments. *P < .05, **P < .01. (F) CD4+ T cells isolated from C57BL/6 mice were stimulated with anti-CD3 and anti-CD28 antibodies, in the presence or absence of TMAO treatment (300 μM). The mRNA expression of IL-4, IL-17, IFN-γ, Gata3, and STAT3, STAT4, STAT6 were determined 24 hours after TMAO treatment. N = 3 in each group.
Th1 and Th17 differentiation was seen in TMAO-fed GVHD mice but not in the TMAO-supplemented in vitro culture system. (A) Experimental scheme of BMT mice or GVHD mice protocol. Recipients were fed with TMAO or vehicle from day −14 and thereafter. Data were collected on day 7 and day 14. (B) Representative in vivo fluorescence image of skull BM in recipient mice on day 7 and day 14. The BALB/c recipients were injected with B6-Tg(CAG-EGFP) TCD-BM cells to generate the BMT model or B6-Tg(CAG-EGFP) TCD-BM cells and B6.129(Cg)-Gt(ROSA)26Sortm4(ACTB-tdTomato-EGFP)/Nju (mT/mG) splenic CD3+ T cells to generate GVHD mice. Grafted tdTomato+ T cells (red) and GFP+ TCD-BM cells (green) were detected. The intravital vessels were stained with dextran-Cy5 (blue) by tail vein injection. Scale bar, 200 μm. (C-E) TCD-BM cells from C57BL/6 mice with splenic T cells from B6.129(Cg)-Gt(ROSA)26Sortm4(ACTB-tdTomato-EGFP)/Nju (mT/mG) mice were coinjected IV into lethally irradiated BALB/c mice. (C) Representative image of the allogeneic tdTomato+ T cells in murine femurs stained with tdTomato-recognizable anti–red fluorescent protein (red, Alexa Fluor 594) antibody and anti-CD3 (green, Alexa Fluor 488) antibody. The cellular nuclei were stained by 4′,6-diamidino-2-phenylindole (DAPI). Scale bar, 100 μm. (D) Representative in vivo intravital image of recipients’ spleen on day 7 and day 14. Grafted tdTomato+ T cells (red) and vasculature (blue) were imaged in the presence or absence of TMAO treatment. Scale bar, 200 μm. (E) The mRNA expression of IFN-γ (n = 6), IL-4 (n = 6), IL-17 (left to right column, n = 5, 4), T-bet (n = 6), RORγt (left to right column, n = 5, 6), and STAT3 (n = 6), STAT4 (n = 4), STAT6 (n = 7) in allogenic splenic tdTomato+ T cells were determined. The T cells were isolated from GVHD spleen on day 14 with or without TMAO treatment. Data were pooled from 2 independent experiments. *P < .05, **P < .01. (F) CD4+ T cells isolated from C57BL/6 mice were stimulated with anti-CD3 and anti-CD28 antibodies, in the presence or absence of TMAO treatment (300 μM). The mRNA expression of IL-4, IL-17, IFN-γ, Gata3, and STAT3, STAT4, STAT6 were determined 24 hours after TMAO treatment. N = 3 in each group.
We further adapted our imaging protocol to track the T-cell dynamics in GVHD spleen in vivo. The frequency of tdTomato+ T cells was gradually increased in the spleen of allogeneic recipients from day 7 to day 14 (Figure 3D; supplemental Figure 3E), where the administration of TMAO remarkably boosted tdTomato+ T-cell growth within splenic sinusoids at the percentage of 60.6% ± 3.5% vs 44.1% ± 1.8% (Figure 3D; supplemental Figure 3E-F). Moreover, FACS analysis showed increased tdTomato+ T-cell infiltration in ileum (supplemental Figure 3G), colon (supplemental Figure 3H), and liver (supplemental Figure 3I) in TMAO-treated GVHD recipients.
To clarify the mechanism by which TMAO enhances allogenic T-cell stimulation on GVHD, mRNA expression in a different Th-cell population was determined, including Th1-related T-bet and STAT4, Th2-related IL-4 and STAT6, as well as Th17-related STAT3 and RORγt.26 Engrafted tdTomato+ T cells were isolated from GVHD spleen with or without TMAO treatment, and were subsequently put into RNA extraction system. By real-time PCR analyses, expression of IFN-γ, IL-17, T-bet, STAT4, STAT3, and RORγt in tdTomato+ T cells were found upregulated in TMAO-treated recipients, whereas IL-4 and STAT6 were unchanged (Figure 3E). We then treated the isolated CD4+ and CD8+ T cells with TMAO in the culture dish to further investigate whether TMAO stimulates Th1 and Th17 function in vitro. Unexpectedly, neither increased T-cell proliferation as measured by BrdU incorporation (supplemental Figure 3J-K) nor expression of GVHD-related transcription factors and cytokines (Figure 3F; supplemental Figure 3L) was seen in TMAO-treated CD4+ and CD8+ T cells. Thus, the impact of TMAO on inducing allogeneic T-cell expansion as well as Th1 and Th17 response was viewed not in the in vitro culture system but in in vivo GVHD mice.
TMAO treatment enhanced macrophage infiltration and caused M1 polarization both in vitro and in vivo
Considering that in vivo Th1 and Th17 response requires M1 macrophage polarization serving as antigen-presenting features,27,28 we further sorted F4/80+CD11b+ murine macrophages (supplemental Figure 4A) and the CD16/32+ M1 population out of F4/80+CD11b+ macrophages (Figure 4A) from GVHD spleen to investigate macrophage differentiation. Notably, compared with the GVHD mice treated with vehicle, splenic F4/80+CD11b+ macrophages were significantly increased in TCD-BM+T recipients subject to TMAO treatment, where the percentage of F4/80+CD11b+CD16/32+ M1 macrophages relative to the F4/80+CD11b+ whole population was higher in TMAO-treated GVHD mice (Figure 4A-B). Immunofluorescence of GVHD target host organs including ileum, colon, and liver showed more robust infiltration of F4/80+ macrophages with M1 phenotype (F4/80+iNOS+) in TMAO-fed GVHD mice (Figure 4C; supplemental Figure 4B-D).
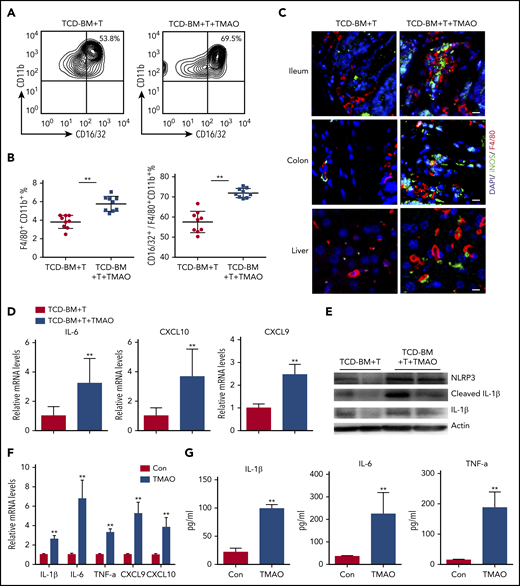
TMAO treatment enhanced macrophage infiltration and caused M1 polarization both in vitro and in vivo. (A-E) Lethally irradiated BALB/c recipients were infused with TCD-BM and splenic CD3+ T cells from C57BL/6 donors. (A) Splenic CD16/32+ M1 population was sorted from F4/80+CD11b+ macrophages in GVHD mice on day 14, in the presence or absence of TMAO treatment. (B) The percentages of splenic CD16/32+ M1 phenotype out of F4/80+CD11b+ macrophages were determined. Data were pooled from 2 independent experiments. N = 9 in each group. **P < .01. ●, TCD-BM+T; ▪, TCD-BM+T+TMAO. (C) Representative image of infiltrative F4/80+ (red, Alexa Fluor 594) iNOS+ (green, Alexa Fluor 488) M1 macrophages in ileum, colon, and liver tissues from GVHD recipients with or without TMAO treatment. The cellular nuclei were stained by DAPI. Scale bar, 10 μm. (D-E) Splenic F4/80+ cells were sorted from GVHD mice. (D) Expression of IL-6, CXCL9, and CXCL10 was determined by reverse transcription PCR (RT-PCR). Data were pooled from 3 independent experiments. N = 6 in each group. **P < .01. (E) Expression of NLRP3, IL-1β, and cleaved IL-1β was determined by western blotting analysis. (F) Expression of IL-1β (n = 6), IL-6 (n = 3), TNF-α (n = 6), CXCL9 (n = 5), and CXCL10 (n = 5) in BMDMs was analyzed by RT-PCR in the presence or absence of TMAO (300 μM) treatment. **P < .01. (G) Cytokines released into BMDM supernatants, including IL-1β (n = 4), IL-6 (left to right column, n = 5, 4) and TNF-α (left to right column, n = 3, 4), were detected by enzyme-linked immunosorbent assay (ELISA) after TMAO (300 μM) treatment. **P < .01.
TMAO treatment enhanced macrophage infiltration and caused M1 polarization both in vitro and in vivo. (A-E) Lethally irradiated BALB/c recipients were infused with TCD-BM and splenic CD3+ T cells from C57BL/6 donors. (A) Splenic CD16/32+ M1 population was sorted from F4/80+CD11b+ macrophages in GVHD mice on day 14, in the presence or absence of TMAO treatment. (B) The percentages of splenic CD16/32+ M1 phenotype out of F4/80+CD11b+ macrophages were determined. Data were pooled from 2 independent experiments. N = 9 in each group. **P < .01. ●, TCD-BM+T; ▪, TCD-BM+T+TMAO. (C) Representative image of infiltrative F4/80+ (red, Alexa Fluor 594) iNOS+ (green, Alexa Fluor 488) M1 macrophages in ileum, colon, and liver tissues from GVHD recipients with or without TMAO treatment. The cellular nuclei were stained by DAPI. Scale bar, 10 μm. (D-E) Splenic F4/80+ cells were sorted from GVHD mice. (D) Expression of IL-6, CXCL9, and CXCL10 was determined by reverse transcription PCR (RT-PCR). Data were pooled from 3 independent experiments. N = 6 in each group. **P < .01. (E) Expression of NLRP3, IL-1β, and cleaved IL-1β was determined by western blotting analysis. (F) Expression of IL-1β (n = 6), IL-6 (n = 3), TNF-α (n = 6), CXCL9 (n = 5), and CXCL10 (n = 5) in BMDMs was analyzed by RT-PCR in the presence or absence of TMAO (300 μM) treatment. **P < .01. (G) Cytokines released into BMDM supernatants, including IL-1β (n = 4), IL-6 (left to right column, n = 5, 4) and TNF-α (left to right column, n = 3, 4), were detected by enzyme-linked immunosorbent assay (ELISA) after TMAO (300 μM) treatment. **P < .01.
The M1 macrophage phenotype is characterized by NLRP3 activation29 and induction of proinflammatory mediators including IL-1β, IL-6, TNF-α, CXCL9, and CXCL10.30 In our study, expression of either M1 signature cytokines IL-6, CXCL9, CXCL10, and IL-1β or gene Nlrp3 was increased in splenic F4/80+ macrophages derived from TMAO-treated GVHD mice (Figure 4D-E). All of these data raised the possibility that TMAO may indirectly cause Th1 and Th17 differentiation through regulation of macrophage polarization.
To further investigate the function of TMAO on macrophage polarization, we assessed the in vitro characteristics of BMDMs in the presence or absence of TMAO. After TMAO stimulation, either mRNA expression or protein production of M1-characterized IL-1β, IL-6, TNF-α, CXCL9, and CXCL10 was significantly increased in BMDMs (Figure 4F-G), suggesting, in our study, that TMAO induces macrophage polarization to the M1 phenotype.
TMAO enhanced M1 polarization via activating the NLRP3 inflammasome
We further investigated whether the NLRP3 inflammasome, a key protein complex in M1 polarization, is involved in the BMDM response to TMAO. We found that ASC, which was dispersively distributed in the control resting macrophages, polarized to 1 side of the perinuclear area in response to TMAO stimulation (Figure 5A; supplemental Figure 5A). NLRP3 expression was increased and partially colocalized with ASC in the perinuclear region in TMAO-treated BMDMs (Figure 5A-B). Consistently, cleaved IL-1β production was induced in TMAO-treated BMDMs where choline had no effect on NLRP3 expression and IL-1β production in vitro (Figure 5B). CY-09, the inhibitor of NLRP3 activation by bounding to the adenosine triphosphate–binding site of the NLRP3 NACHT domain, markedly suppressed the production and polarized accumulation of TMAO-related cleaved caspase-1 (Figure 5C-E; supplemental Figure 5B) as well as IL-1β secretion (Figure 5F). In addition, TMAO-induced mRNA expression of M1 signature cytokines or chemokines, including IL-1β, IL-6, TNF-α, CXCL9, and CXCL10, were suppressed by CY-09 (Figure 5G). Consistently, Nlrp3−/− BMDMs did not exhibit an enhanced profile of M1 signature expression (Figure 5H), indicating that the activation of NLRP3 plays a key role in TMAO-treated macrophage polarization.
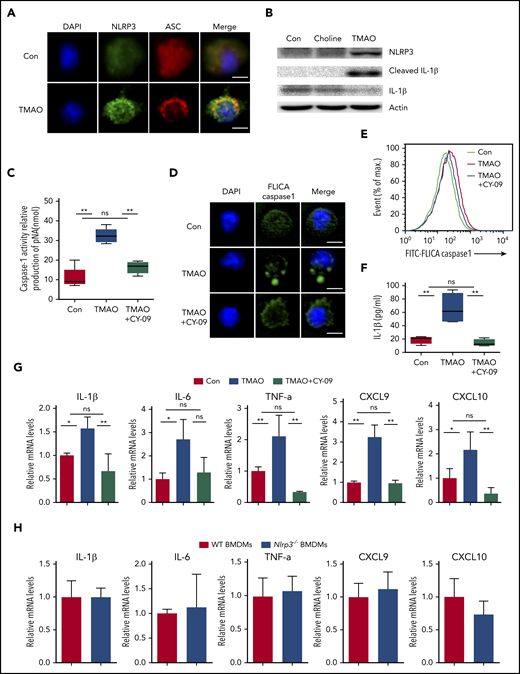
TMAO enhanced M1 polarization via activating the NLRP3 inflammasome. (A) Representative immunofluorescence staining of NLRP3 (green, Alexa Fluor 488), ASC (red, Alexa Fluor 594), DAPI (blue) on BMDMs after TMAO (300 μM) stimulation for 24 hours. Scale bar, 5 μm. (B) Western blotting analysis of NLRP3, IL-1β, and cleaved IL-1β of BMDMs cultured with TMAO (300 μM) or choline (300 μM) for 24 hours. (C-G) BMDMs were cultured with TMAO (300 μM) in the presence or absence of CY-09 (1 μM) for 24 hours. (C) Casapse-1 activity (N = 5 in each group; **P < .01). (D) Representative image of FLICA Casapse-1 that binds only to activated caspase-1 (green, FAM FLICA; blue, DAPI). Scale bar, 5 μm. (E) Flow cytometry analysis of FLICA Casapse-1 was determined. (F) The concentrations of IL-1β in the supernatant of BMDMs cultured with TAMO or TMAO+CY-09 were detected by ELISA. N = 4 in each group. **P < .01. (G) Expression of IL-1β (left to right column, n = 4, 3, 4), IL-6 (left to right column, n = 3, 4, 3), TNF-α (left to right column, n = 3, 3, 5), CXCL9 (left to right column, n = 4, 3, 3), and CXCL10 (left to right column, n = 3, 3, 6) in BMDMs stimulated with TMAO or TMAO+CY-09 were determined by RT-PCR. *P < .05, **P < .01. (H) Expression of IL-1β, IL-6, TNF-α, CXCL9, and CXCL10 in Nlrp3−/− BMDMs or WT BMDMs was determined. N = 3 in each group.
TMAO enhanced M1 polarization via activating the NLRP3 inflammasome. (A) Representative immunofluorescence staining of NLRP3 (green, Alexa Fluor 488), ASC (red, Alexa Fluor 594), DAPI (blue) on BMDMs after TMAO (300 μM) stimulation for 24 hours. Scale bar, 5 μm. (B) Western blotting analysis of NLRP3, IL-1β, and cleaved IL-1β of BMDMs cultured with TMAO (300 μM) or choline (300 μM) for 24 hours. (C-G) BMDMs were cultured with TMAO (300 μM) in the presence or absence of CY-09 (1 μM) for 24 hours. (C) Casapse-1 activity (N = 5 in each group; **P < .01). (D) Representative image of FLICA Casapse-1 that binds only to activated caspase-1 (green, FAM FLICA; blue, DAPI). Scale bar, 5 μm. (E) Flow cytometry analysis of FLICA Casapse-1 was determined. (F) The concentrations of IL-1β in the supernatant of BMDMs cultured with TAMO or TMAO+CY-09 were detected by ELISA. N = 4 in each group. **P < .01. (G) Expression of IL-1β (left to right column, n = 4, 3, 4), IL-6 (left to right column, n = 3, 4, 3), TNF-α (left to right column, n = 3, 3, 5), CXCL9 (left to right column, n = 4, 3, 3), and CXCL10 (left to right column, n = 3, 3, 6) in BMDMs stimulated with TMAO or TMAO+CY-09 were determined by RT-PCR. *P < .05, **P < .01. (H) Expression of IL-1β, IL-6, TNF-α, CXCL9, and CXCL10 in Nlrp3−/− BMDMs or WT BMDMs was determined. N = 3 in each group.
TMAO activated NLRP3 via mitochondrial ROS
We next examined the function of TMAO on mitochondrial dysfunction, which subsequently contributes to NLRP3 inflammasome activation.31 TMAO stimulation caused intensive mitochondrial reactive oxygen species (ROS) production in BMDMs. Both immunofluorescence and FACS analyses showed that MitoSOX-labeling mitochondrial ROS was increased after TMAO treatment (Figure 6A-C). To test whether the increase in mitochondrial ROS accounted for the accumulation of dysfunctional mitochondria, JC-1 staining was used to determine mitochondrial membrane potential, and 2 types of mitochondria-specific fluorescent labels were used to distinguish respiring mitochondria (MitoTracker Red) vs total mitochondria (MitoTracker Green). TMAO stimulation caused a decreased fluorescence intensity of JC-1 red and an increased fluorescence intensity of JC-1 green, indicating that mitochondrial membrane potential collapsed after TMAO treatment (Figure 6D; supplemental Figure 6A). In addition, the accumulation of dysfunctional mitochondria (MitoTracker Greenhigh MitoTracker Redlow) was observed in TMAO-stimulated BMDMs (Figure 6E). In contrast, treatment of macrophages with Mito-Tempo, the mitochondrion-produced ROS scavenger, decreased TMAO-induced mitochondrial ROS production (supplemental Figure 6B-C) and reversed ASC-accumulated NLRP3-polarized activation (Figure 6F; supplemental Figure 6D). The augmented IL-1β (Figure 6G-H) and caspase-1 production (Figure 6I-J) in TMAO-treated macrophages was also abrogated by Mito-Tempo. Moreover, TMAO-related induction of M1 macrophage signature cytokines (TNF-α and IL-6) or chemokines (CXCL9 and CXCL10) was blocked by Mito-Tempo (Figure 6K-L).
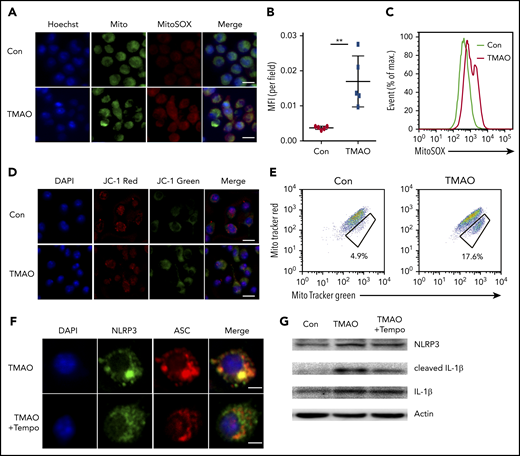
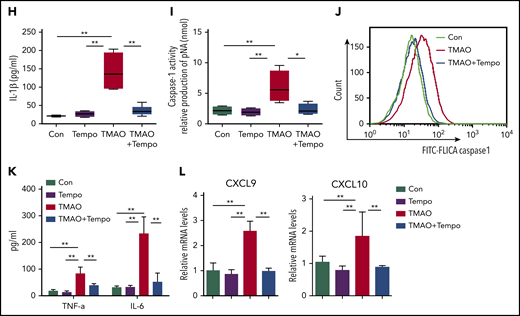
TMAO activated NLRP3 via the mitochondrial ROS. (A) Representative image of BMDMs labeled with MitoSOX for mitochondrial ROS detection (green, Mito; red, MitoSOX; blue, Hoechst). Scale bar, 10 μm. (B-E) Mean fluorescence intensity (MFI) of MitoSOX determined by ImageJ (B; N = 5 in each group; **P < .01) and percentage of fluorescence-expressing MitoSOX determined by FACS analysis (C) in TMAO-treated BMDMs. Mitochondrial membrane potential as the ratio of JC-1 red to JC-1 green was detected by immunofluorescence (D; scale bar, 10 μm), and dysfunctional mitochondrial respiration labeled with MitoTracker GreenhighMitoTracker Redlow was detected by FACS analysis (E) in BMDMs treated with 300 μM TMAO for 24 hours. (F) Representative immunofluorescence staining of NLRP3 (green, Alexa Fluor 488), ASC (red, Alexa Fluor 594), DAPI (blue) in TMAO-treated or TMAO+Tempo–treated BMDMs. Scale bar, 5 μm. (G) Western blotting analysis of NLRP3, IL-1β, and cleaved IL-1β in TMAO-treated or TMAO+Tempo–treated BMDMs. (H) Secreted IL-1β in BMDM-cultivated supernatants with TMAO, Tempo, or TMAO+Tempo. N = 4 in each group. **P < .01. (I-J) Caspase-1 activity determined as pNA concentration (I; N = 4 in each group; *P < .05, **P < .01) or fluorescein isothiocyanate–FLICA percentage (J) was analyzed in TMAO-treated or TMAO+Tempo–treated BMDMs. (K) Expression of TNF-α (N = 3 in each group) and IL-6 (N = 4 in each group) was determined by ELISA in BMDM supernatants cultured with TMAO, Tempo, TMAO+Tempo for 24 hours. **P < .01. (L) Expression of CXCL9 and CXCL10 in BMDMs was determined by RT-PCR after being treated with Tempo, TMAO, or TMAO+Tempo for 24 hours. N = 3 in each group. **P < .01.
TMAO activated NLRP3 via the mitochondrial ROS. (A) Representative image of BMDMs labeled with MitoSOX for mitochondrial ROS detection (green, Mito; red, MitoSOX; blue, Hoechst). Scale bar, 10 μm. (B-E) Mean fluorescence intensity (MFI) of MitoSOX determined by ImageJ (B; N = 5 in each group; **P < .01) and percentage of fluorescence-expressing MitoSOX determined by FACS analysis (C) in TMAO-treated BMDMs. Mitochondrial membrane potential as the ratio of JC-1 red to JC-1 green was detected by immunofluorescence (D; scale bar, 10 μm), and dysfunctional mitochondrial respiration labeled with MitoTracker GreenhighMitoTracker Redlow was detected by FACS analysis (E) in BMDMs treated with 300 μM TMAO for 24 hours. (F) Representative immunofluorescence staining of NLRP3 (green, Alexa Fluor 488), ASC (red, Alexa Fluor 594), DAPI (blue) in TMAO-treated or TMAO+Tempo–treated BMDMs. Scale bar, 5 μm. (G) Western blotting analysis of NLRP3, IL-1β, and cleaved IL-1β in TMAO-treated or TMAO+Tempo–treated BMDMs. (H) Secreted IL-1β in BMDM-cultivated supernatants with TMAO, Tempo, or TMAO+Tempo. N = 4 in each group. **P < .01. (I-J) Caspase-1 activity determined as pNA concentration (I; N = 4 in each group; *P < .05, **P < .01) or fluorescein isothiocyanate–FLICA percentage (J) was analyzed in TMAO-treated or TMAO+Tempo–treated BMDMs. (K) Expression of TNF-α (N = 3 in each group) and IL-6 (N = 4 in each group) was determined by ELISA in BMDM supernatants cultured with TMAO, Tempo, TMAO+Tempo for 24 hours. **P < .01. (L) Expression of CXCL9 and CXCL10 in BMDMs was determined by RT-PCR after being treated with Tempo, TMAO, or TMAO+Tempo for 24 hours. N = 3 in each group. **P < .01.
TMAO induced NLRP3 expression by enhanced NF-κB nuclear localization
Interestingly, even though TMAO-induced NLRP3 polarization was blocked by Mito-Tempo, the production of NLRP3 was not inhibited (Figure 6F-G). Considering that NLRP3 transcription can be induced by NF-κB activation,32 we further determined the expressing status of NF-κB in BMDMs under TMAO treatment. Immunofluorescent imaging indicated that TMAO stimulation–induced NF-κB translocated into BMDM nuclei (supplemental Figure 7A). Furthermore, the pharmacological inhibitor of NF-κB, triptolide, successfully attenuated TMAO-induced p-NF-κB activation as the fluorescence intensity of p-NF-κB decreased (supplemental Figure 7B-C), abrogated NLRP3 perinuclear aggregation, and downregulated NLRP3 production (supplemental Figure 7D-E), all of which were induced in TMAO-stimulated BMDMs. These data suggested that TMAO upregulates NLRP3 via promoting NF-κB nuclear translocation.
NLRP3 was indispensable for TMAO-enhanced GVHD
To further investigate the role of NLRP3 in TMAO-stimulated GVHD, mice lacking NLRP3 signaling (Nlrp3−/−) were treated as recipients in our mice model in the presence or absence of enteral TMAO supplements from day −14 (Figure 7A). As shown in Figure 7B, deletion of NLRP3 significantly extended the survival curve in GVHD mice. Administration of TMAO in Nlrp3−/− recipients did not abrogate the survival advantage of Nlrp3 deletion compared with a deleterious effect on WT control mice. Notably, the percentage of F4/80+CD11b+ macrophages or that of the F4/80+CD11b+CD16/32+ M1 phenotype relative to the F4/80+CD11b+ whole population in the spleen remained unchanged in Nlrp3−/− recipients with TMAO treatment (Figure 7C; supplemental Figure 8A), indicating that TMAO is not able to induce M1 macrophage polarization when Nlrp3 is lacking. This finding was correlated with the unchanged histological score in the tissues of ileum, colon, skin, and liver from Nlrp3−/− GVHD recipients (Figure 7D-E; supplemental Figure 8B).
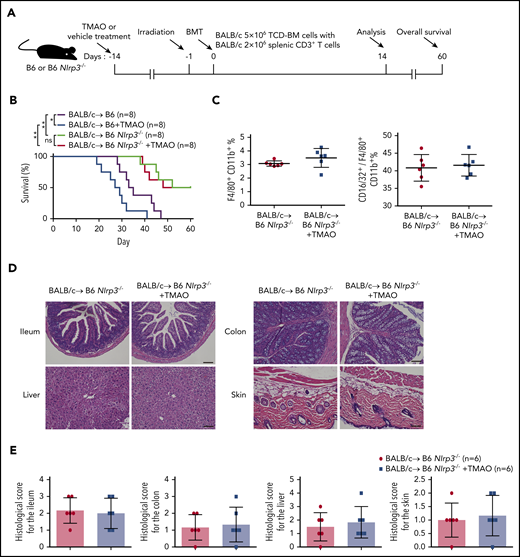
NLRP3 was indispensable for TMAO-enhanced GVHD. (A) Experimental scheme of GVHD mice protocol. B6 or B6 Nlrp3−/− recipients were fed with TMAO or vehicle from day −14 and thereafter, lethally irradiated on day −1, and transfused with TCD-BM and splenic CD3+ T cells from BALB/c donors on day 0. Data were collected on day 14 except for survival curve analysis on day 60. (B) Kaplan-Meier survival curve was determined in GVHD B6 or B6 Nlrp3−/− recipients (N = 8 in each group), in the presence or absence of TMAO treatment. Data were pooled from 2 independent experiments. *P < .05, **P < .01. (C) The percentages of splenic F4/80+CD11b+ macrophages (left panel) and splenic CD16/32+ M1 phenotype out of F4/80+CD11b+ macrophages (right panel) in B6 Nlrp3−/− GVHD mice were determined. Data were pooled from 2 independent experiments. N = 6 in each group. ●, BALB/c→ B6 Nlrp3−/−; ▪, BALB/c→ B6 Nlrp3−/− +TMAO. (D) Representative H&E staining images of ileum, colon, skin, and liver tissues from B6 Nlrp3−/− GVHD recipients with or without TMAO treatment. Scale bar, 200 μm. (E) Paraffin sections of ileum, colon, skin, and liver tissues from B6 Nlrp3−/− GVHD recipients with or without TMAO treatment were analyzed for GVHD histological score. Data were pooled from 2 independent experiments. N = 6 in each group.
NLRP3 was indispensable for TMAO-enhanced GVHD. (A) Experimental scheme of GVHD mice protocol. B6 or B6 Nlrp3−/− recipients were fed with TMAO or vehicle from day −14 and thereafter, lethally irradiated on day −1, and transfused with TCD-BM and splenic CD3+ T cells from BALB/c donors on day 0. Data were collected on day 14 except for survival curve analysis on day 60. (B) Kaplan-Meier survival curve was determined in GVHD B6 or B6 Nlrp3−/− recipients (N = 8 in each group), in the presence or absence of TMAO treatment. Data were pooled from 2 independent experiments. *P < .05, **P < .01. (C) The percentages of splenic F4/80+CD11b+ macrophages (left panel) and splenic CD16/32+ M1 phenotype out of F4/80+CD11b+ macrophages (right panel) in B6 Nlrp3−/− GVHD mice were determined. Data were pooled from 2 independent experiments. N = 6 in each group. ●, BALB/c→ B6 Nlrp3−/−; ▪, BALB/c→ B6 Nlrp3−/− +TMAO. (D) Representative H&E staining images of ileum, colon, skin, and liver tissues from B6 Nlrp3−/− GVHD recipients with or without TMAO treatment. Scale bar, 200 μm. (E) Paraffin sections of ileum, colon, skin, and liver tissues from B6 Nlrp3−/− GVHD recipients with or without TMAO treatment were analyzed for GVHD histological score. Data were pooled from 2 independent experiments. N = 6 in each group.
Discussion
GVHD is a major complication resulting from activation of alloreactive T cells causing nonrelapse mortality in allo-HSCT.33 In gastrointestinal GVHD, the compromised mucosal barrier initiates activation of host antigen-presenting cells and donor T-cell differentiation, resulting in lethal enhancement of the pathogenesis process.34 The dysbiosis of intestinal microbiota hemostasis has been proved to link with GVHD promotion.35,36 Growing evidence indicates that living microbial therapy, including fecal microbiota transplantation and probiotics, might be able to restore the microbial diversity and reduce the severity of GVHD.37 However, the addressed risk of fecal microbiota transplantation–transmitted drug-resistant bacteremia and uncertainty of underlying mechanism limit their translational application.38 More targeted therapy concerning the relationship between microbiota and GVHD needs to be explored.39
Microbial metabolites, the gut microorganism-produced repertoire, mainly include SCFA,40 TMAO,40 lipopolysaccharide,41 uremic toxins,7 and bile acids.42 Accumulating evidencee has revealed that gut microbial metabolites play an important role in human health and diseases.43,44 Dietary habit alters the distinct quality and quantity of gut microbiota, which might be, on the other hand, to affect microbial metabolites and to impact on GVHD severity.1,45 It was indicated that, SCFAs and indole relieved GVHD by modulating intestinal epithelial cell damage12 or via type I interferon signaling pathway,13 respectively. However, whether all gut microbial metabolites exert similar function on GVHD remains undetermined. In this study, we focused on another microbial metabolite, choline-metabolized TMAO, to clarify its regulating mechanism on GVHD.
Elevated serum TMAO is correlated with inflammatory diseases such as coronary atherosclerosis,46 type 2 diabetes mellitus,47 and chronic kidney disease.48 In our study, both choline and TMAO treatment increased GVHD-relating scores, whereas the structural analog of choline, DMB, reversed the choline diet–induced GVHD progression. However, we did not find the changes in the intestinal bacterial diversity and microbiota relevant to GVHD severity, indicating that high-choline-diet–induced GVHR is not related to gut microbial dysbiosis but is related to its metabolite TMAO.
Interestingly, even though CD4+ T cells were demonstrated in GVHD mice to differentiate into GVH-related Th1 and Th17 lineages rather than the Th2 lineage,49 neither T-cell proliferation nor T-cell–released cytokines was increased with TMAO stimulation in the in vitro culture system, raising the possibility that the outcome of Th1 and Th17 activation in TMAO-fed mice was not a direct result of TMAO–T-cell contact but was a consequence of serial immune responses. Thinking of the antigen-presenting requirement in T-cell–mediating GVHR, we thus focused on the role of macrophage activation in TMAO-enhanced GVHD severity.
Macrophages provide the microenvironment in which to present alloantigens to donor-derived naive CD4+ T cells, which are subsequently differentiated into Th-cell subsets expressing distinct transcriptional factors and cytokines.50 It sets up the environment for a potent Th1 and Th17 response by M1 macrophages when inflammation occurs.27,51 In TMAO-fed GVHD mice, the percentages of M1 macrophage were increased. Meanwhile, the hallmark of BMDM-derived polarized M1 cytokines was elevated after TMAO treatment. These data indicated that TMAO might control the macrophage M1 polarization, which in turn mediates the response of Th1 and Th17 activation.
The critical step in M1 polarization is NLRP3 inflammasome activation, requiring both priming signaling (signal 1) and activating signaling (signal 2).29 In our study, TMAO was found to induce NF-κB translocation and activate the NLRP3 inflammasome, whose deletion in BMDMs led to the impediment of TMAO-induced M1 polarization. These results are coincident with the previous finding in endothelial cells that TMAO can activate NLRP3 inflammasomes by endogenous mitochondrial ROS formation.16,52
The activating signal, being stimulated by adenosine triphosphate, calcium influx, and ROS production, results in the cleavage of caspase-1 and the secretion of proinflammatory cytokine IL-1β.53 Mitochondria-derived ROS was shown to be elevated in macrophages with TMAO treatment, which was associated with decreased mitochondrial membrane potential and impaired mitochondrial respiration. Our findings were similar to a previous report that TMAO facilitated the activation of aortic macrophages and upregulated IL-1β gene expression in atherosclerotic plaque.54 Even more remarkably, TMAO was seen shortening the survival of WT animals, but not of Nlrp3−/− animals. The M1 polarization in the spleen remained unchanged in allogeneic TMAO-treated Nlrp3−/− recipients. As NLRP3 signaling serves a critical role in full manifestation of GVHD,55 our results confirmed this function, showing that the overall survival of Nlrp3−/− recipients is not impacted in the presence of TMAO.
In summary, GVHD is a long-term pathological process in which a change of diet could alter the microbiome metabolism, and thus avoid lethal progression. Defining gut microbiome metabolic products that stimulate or inhibit GVHD will help to modify translational targeted therapy to this disease entity. We demonstrated that choline-generated TMAO, as a stimulator in GVHD progression, leads M1 macrophage polarization and thus activates Th1 and Th17 reaction (visual abstract). Our study provides the missing links among the host choline diet, microbial metabolites, and GVHD severity, revealing the potential to alleviate GVHD by controlling choline intake. Combining the blockage of the TMAO pathway with other strategies, including SCFA protection, will help to orchestrate microecological balance, with the potential to be a targeted route to control GVHD and other inflammatory diseases.
For original data, please contact the corresponding author.
The online version of this article contains a data supplement.
The publication costs of this article were defrayed in part by page charge payment. Therefore, and solely to indicate this fact, this article is hereby marked “advertisement” in accordance with 18 USC section 1734.
Acknowledgments
The authors specially thank Naiqing Zhao (School of Public Health, Fudan University) for kindly help on statistical analysis.
This work was supported by funding from the National Natural Science Foundation of China (81870081, 91542109), the Program for Outstanding Medical Academic Leader of Shanghai (2019LJ05), the Shanghai Collaborative Innovation Program on Regenerative Medicine and Stem Cell Research (2019CXJQ01), and the Milstein Medical Asian American Partnership Foundation (T.C.).
Authorship
Contribution: T.C. and H.J. defined the research theme, guided the research experiments, and wrote the paper; K.W. performed experiments, analyzed the data, and wrote the paper; Y.Y. contributed to study design; H.Y., X.D., S.W., Z.S., F.W., H.F., and Q.L. helped optimize the experimental conditions.
Conflict-of-interest disclosure: The authors declare no competing financial interests.
Correspondence: Tong Chen, Department of Hematology, Huashan Hospital, Fudan University, 12 Wulumuqi Middle Rd, Shanghai 200040, China; e-mail: chentong@fudan.edu.cn; and Hua Jiang, Department of Gynecology, Obstetrics & Gynecology Hospital, Fudan University, 419 Fangxie Rd, Shanghai 200011, China; e-mail: jianghua@fudan.edu.cn.

This feature is available to Subscribers Only
Sign In or Create an Account Close Modal