

Key Points
Functional impairment of NK cells in B-cell lymphoma is associated with lipid accumulation.
NK cells increase lipid metabolism to adapt to lipid-rich blood cancer environment.

Abstract
Natural killer (NK) cells play critical roles in protection against hematological malignancies but can acquire a dysfunctional state, which limits antitumor immunity. However, the underlying reasons for this impaired NK cell function remain to be uncovered. We found that NK cells in aggressive B-cell lymphoma underwent substantial transcriptional reprogramming associated with increased lipid metabolism, including elevated expression of the transcriptional regulator peroxisome activator receptor-γ (PPAR-γ). Exposure to fatty acids in the lymphoma environment potently suppressed NK cell effector response and cellular metabolism. NK cells from both diffuse large B-cell lymphoma patients and Eµ-myc B-cell lymphoma-bearing mice displayed reduced interferon-γ (IFN-γ) production. Activation of PPAR-γ partially restored mitochondrial membrane potential and IFN-γ production. Overall, our data indicate that increased lipid metabolism, while impairing their function, is a functional adaptation of NK cells to the fatty-acid rich lymphoma environment.
Introduction
Natural killer (NK) cells are innate lymphocytes that play critical roles in tumor immune surveillance.1 Reduced effector function of NK cells predicts a higher incidence and mortality in cancers,2 and a lower abundance of circulating NK cells or impaired NK cell-associated gene expression is associated with shorter progression-free or overall survival of B-cell lymphoma patients.3,4 NK cells produce cytotoxic granules, including perforin and granzymes, and inflammatory cytokines, such as interferon-γ (IFN-γ) and tumor necrosis factor (TNF). Although direct killing mediated by cytotoxic molecules is the primary function of NK cells in antitumor immunity, NK cell-derived IFN-γ is essential for immunotherapeutic efficacy and immunity against lymphoma and other tumors.5-8 A range of cancer drugs rely on NK cell activities for their effectiveness,1 including rituximab, an anti-CD20 monoclonal antibody against B-cell malignancies, and novel immunotherapeutic strategies, such as bispecific or trispecific antibodies.9-11 The functional competence of NK cells is therefore essential for multiple blood cancer immunotherapies.
Changes in cellular metabolism are tightly linked to the functional fate of immune cells. Cytokine-induced activation of NK cells accelerates the rates of glycolysis and mitochondrial metabolism, thereby supporting cellular growth and synthesis of effector molecules.12-15 A number of regulators of cellular metabolism, such as the mammalian target of rapamycin complex 1 (mTORC1), the transcription factor cMyc and sterol element-binding proteins promote functional activation of NK cells.12,13,15-17 The perturbed metabolic environment associated with tumors is frequently coupled with altered function of immune cells including NK cells because it may be deprived of nutrients or show an accumulation of toxic metabolites.18-23 Therefore, the tumor environment imposes metabolic restrictions on immune effector cells, which limit optimal antitumor immune responses.
In this study, we examined how aggressive B-cell lymphoma impacts NK cell function and metabolism. We found that NK cells derived from diffuse large B-cell lymphoma (DLBCL) patients and from lymphoma-bearing mice exhibited reduced IFN-γ expression. This impairment was mediated by the lymphoma microenvironment, suggesting that metabolic factors contributed to functional NK cell suppression. Indeed, lymphoma-derived NK cells displayed increased lipid metabolism, and exposure to increased levels of fatty acids reminiscent of the lymphoma environment potently suppressed NK cell function. Transcriptional profiling and functional analyses revealed that peroxisome activator receptor-γ (PPAR-γ) and the fatty acid-binding protein (FABP) pathway support NK cell metabolism and function in the lymphoma environment. Therefore, our results show that the effector response of NK cells is suppressed in the lipid-rich lymphoma environment and further demonstrate that NK cells undergo PPAR-γ-dependent metabolic adaptation of their metabolism, opening up new avenues for antilymphoma immunotherapy.
Methods
Mice
C57BL/6 or B6.SJL-Ptprca mice were from the Animal Resources Center (Perth, Australia). Mice were sex-matched, housed under specific pathogen-free conditions, and used at 6 to 12 weeks of age. Experiments were conducted following the animal ethics guidelines of the National Health and Medical Research Council of Australia, approved by the University of Queensland Animal Ethics Committee (UQDI/155/16/UQDI).
Hematologic tumor models
Eμ-myc B lymphoma cells were isolated from lymph nodes of Eμ-myc transgenic mice and stably transduced with green fluorescent protein (GFP) by retroviral transduction as described.24 Mice were inoculated IV with 0.5 or 1 × 10⁵ Eμ-myc tumor cells. Lymphoma growth was examined by detecting GFP+ cells in the blood or lymphoid organs using flow cytometry. AML-ETO9a_Nras tumor cells were made by retroviral transduction of acute myeloid leukemia (AML)-ETO9a and Nras to create AML-ETO9a Nras tumor cells.25 Mice were inoculated IV with 1 × 10⁵ of GFP/luciferase cotransduced AML-ET09a tumor cells, and leukemia growth was monitored by flow cytometry.
NK cell culture and purification
Splenocyte suspension was labeled with biotinylated non-NK cell lineage antibodies, and the unlabeled splenic cell fraction was enriched using Rapidspheres (StemCell Technologies), following manufacturer’s instructions. Isolated cells were then cultured for 10 to 14 days in RPMI (Thermo Fisher Scientific) supplemented with 10% fetal bovine serum (FBS), 100 U/mL penicillin/100 µg/mL streptomycin/0.292 g/mL glutamine, 1 mM sodium pyruvate, 2 mM GlutaMAX (all from Gibco) and 50 µM β-mercaptoethanol (Sigma-Aldrich) (referred to as culture media onwards), and 50 ng/mL murine interleukin-15 (IL-15; Peprotech). The resultant culture typically yielded >90% pure NK cells. For intracellular cytokine analysis, splenocytes or expanded NK cells cultures as described were stimulated with culture media containing 1 ng/mL murine IL-12 (Peprotech), 10 or 50 ng/mL IL-15 (Peprotech), and 1 ng/mL IL-18 (MBL) for 4 to 20 hours. For some experiments, cells were treated with GW9662 (10 µM), BMS309403 (100 µM), and rosiglitazone (potassium salt) (20 µM) (all from Cayman).
Human peripheral blood mononuclear cell culture
Blood collection, processing, and cryopreservation were conducted following the guidelines stated under the ethics approval (HREC REF. NO: HREC/07/QPAH/035). Patients (≥18 years) gave informed consent. Patients with immunosuppressive-related lymphoma, transformed follicular lymphoma, and grade 3B follicular lymphoma were excluded but otherwise no selection criteria were applied. Peripheral blood mononuclear cells (PBMCs) of healthy donors (mean age, 52.3 ± 6.6 standard deviation) or DLBCL patients (untreated mean age, 63.2 ± 14.3 standard deviation) (supplemental Table 2 on the Blood Web site) were cryopreserved at the density of 5.0 to 10 × 106 cells/mL in 90% FBS 10% dimethyl sulfoxide (DMSO) in liquid nitrogen for a long-term storage. Cryopreserved PBMCs were thawed using prewarmed RPMI supplemented with 20% FBS, 100 U/mL penicillin, 100 µg/mL streptomycin, 0.292 g/mL glutamine, 1 mM sodium pyruvate, 2 mM GlutaMAX (all from Gibco) and 50 U/mL benzonase nuclease (Sigma). PBMCs were rested for 4 hours in the presence of 50 ng/mL recombinant human IL-15 (Peprotech) before being stimulated with 10 ng/mL IL-12 (Peprotech), 50 ng/mL IL-15 (Peprotech), and 100 ng/mL IL-18 (R&D Systems) and incubated for 20 hours before flow cytometric analysis.
Human NK-cell killing and degranulation assays
Primary NK cells were isolated from cryopreserved PBMCs and expanded in vitro (supplemental Methods). Target cells were labeled using 250 nM of Cell Trace Violet, according to the manufacturer’s instructions (Thermo Fisher). NK cells were mixed with target cells at a ratio of 1:1 or 1:5 and incubated at 37°C in a 5% CO2 incubator. Six hours later, cells were analyzed, and absolute cell counts determined by flow cytometry using Counting beads (Thermo Fisher). Target cell numbers were determined by comparison with control wells (targets without effectors) and expressed as a percentage. For the degranulation assay, monensin (1:1500) (GolgiStop) along with CD107a antibody (both BD Biosciences) was added for the last hour. Cells were washed in Dulbecco phosphate-buffered saline, stained with Zombie NIR Fixable Viability dye (BioLegend), then washed and stained with fluorophore-conjugated anti-human monoclonal antibodies for CD3 and CD56 (BD Biosciences). All assays were performed in triplicate.
Fatty acid preparation
FA treatments were prepared following the procedures described previously,26,27 with some modifications. Palmitic acid (PA), stearic acid (SA), oleic acid (OA), and linoleic acid (LA) (all from Sigma-Aldrich) were dissolved in DMSO to make a 2M stock solution. Each FA-bovine serum albumin (BSA) complex was prepared following saponification with NaOH by repetitive heating. For comparison of the different dosages of PA, the BSA control solution was used to dilute to prepare 0, 10, 100, and 500 µM to match the concentration of BSA contained in the 1 mM PA treatment.
Flow cytometry
Mouse or human leukocytes were labeled with fluorochrome-conjugated monoclonal antibodies at predetermined optimal concentrations. Upon acquisition, flow-count fluorospheres (Beckman Coulter) were added to measure cell numbers. Intracellular molecule staining was preceded by addition of GolgiPlug (BD Biosciences). Cells were permeabilized and fixed using Cytofix/Cytoperm kit, following the manufacturer's instructions (BD Biosciences). Cells were labeled with antibodies and acquired on LSR-Fortessa X20 (BD Biosciences) or Gallios (Beckman Coulter) and analyzed using FlowJo version 7.6.3 (Tree Star, Ashland, OR) or Kaluza (Beckman Coulter)software. For some assays, cells were incubated with 2-NBDG (Life Technologies), Bodipy FLC16 (Life Technologies), Bodipy 493/503 (Life Technologies), MitoTracker DeepRed FM, or MitoTracker RedCMXROS (Cell Signaling Technologies) before surface staining. Microscopic images of mitochondria, single-cell suspensions were acquired at 60× magnification on an Amnis ImageStreamX Mk II and analyzed using IDEAS 6.2 software (both Merck Millipore).
In vivo stimulation of NK cells
For in vivo cytokine stimulation, IL-12 (200 ng/mouse) (Peprotech) and IL-18 (1 µg/mouse) (MBL), α-galactosylceramide (1µg/mouse) or vehicle control (phosphate-buffered saline) were administered intraperitoneally into Eµ-myc lymphoma mice. Splenocytes were collected after 20 hours and then incubated with GolgiPlug for 4 hours to stop cytokine secretion. The samples were stained for surface antigens and intracellular IFN-γ and TNF.
In vivo PPAR-γ activation by rosiglitazone
Rosiglitazone potassium salt (Cayman) or DMSO vehicle control (1% to 2%) were administered at 200 µg/mouse daily for 6 days from day 6, or at 600 µg/mouse every 2 to 3 days at days 3, 5, 7, 10, 12, 14, and 17 post-Eµ-myc lymphoma inoculation. The mice were euthanized at day 13 or 18 postinoculation, and splenocytes were stimulated with IL-15 (50 ng/mL) (Peprotech) + IL-12 (Peprotech)/18 (MBL) (1 ng/mL) mixed with rosiglitazone (20 µM) or DMSO control. After 20 hours of stimulation in vitro intracellular IFN-γ, TNF, and GzmB were analyzed using flow cytometry.
Metabolic flux assays
NK cells were seeded into CellTak-coated Seahorse culture microplate (100-300 000 cells/well) in assay media (unbuffered Dulbecco’s modified Eagle medium) supplemented with 10 or 25 mM glucose, 100 U/mL penicillin, 100 µg/mL streptomycin, 0.292 g/mL glutamine, 1 mM sodium pyruvate, and analyzed using a Seahorse XFe96 Extracellular Flux Analyzer (Agilent). Oxygen consumption rate (OCR) and extracellular acidification rate (ECAR) were measured before and after compound injections required for Mitostress test (1.0 µM oligomycin, 1.5 µM FCCP, and 0.5 µM antimycin A and rotenone) (Agilent). The results were normalized to 1 × 10⁶ cells unless otherwise specified.
RNA sequencing and bioinformatics
Spleens were harvested and B cells were depleted using anti-mouse CD19 (clone 1D3, in-house) antibodies. Splenic NK cells were preenriched by positive selection using CD49b beads (Miltenyi) and purified by flow cytometry sorting of the NK1.1+TCRb− population. RNA was purified with the RNeasy Mini Kit (Qiagen). A complementary DNA library was generated using TruSeq RNA Library Prep Kit (Illumina) and subjected to sequencing by the NextSeq 550 Sequencing System. Reads were mapped to the mm10 genome with STAR v2.5.228 using Ensembl gene annotation (GRCm38, release 88). Gene level read counts were obtained with HTSeq-count v0.6.129 using the attribute gene_id from the Ensembl GTF file Mus musculus GRCm38 release 88 as feature ID. Genes were filtered out if they failed to achieve a fragments per million mapped fragments value of at least 3 in at least 3 samples. We also excluded T-cell receptor and immunoglobulin genes, pseudogenes, ribosomal RNA genes, and Gm annotated genes. Differential gene expression analysis was performed with the Bioconductor package DESeq2 v1.10.30 For preranked Gene Set Enrichment Analysis, significant genes were ranked using their fold-change values.
Plasma and serum metabolite measurements
Mouse blood samples were collected in 0.5 mM EDTA and centrifuged at 3000g for 15 minutes. Supernatants were collected as plasma. For quantification of FAs, the calibration standards (0.5, 1, 5, 20, and 100 µg/mL) were prepared by dilution of a stock solution containing 6 FAs (palmitoleic acid, PA, stearic acid, OA, LA, and linolenic acid: each at 500 µg/mL in 90% MeOH/H2O) with 5% BSA (FA free, Sigma) in water. A solution of 5% BSA was used as the blank. Samples were thawed and an aliquot of 5 µL of each was mixed with 20 µL of the internal standard (10 µg/mL palmitic acid in 90% MeOH/H2O) and extracted with 100 µL 90% MeOH/H2O. After sonicating at 4°C for 10 minutes, the mixture was centrifuged and the lipid-containing supernatant was collected for liquid chromatography mass spectrometry (LC-MS) analysis. LC-MS quantitative analysis was carried out on an Agilent 1290 Infinity II LC system coupled with an Agilent 6490 QQQ mass spectrometer operated in negative selected ion monitoring mode. Calibration was done by plotting each FA concentration against the peak area ratio of this FA to the internal standard. The plasma sample were also subjected to glucose, lactate, and cholesterol detection kit (Olympus) and analyzed using Beckman AU480 (Beckman Coulter).
Statistical analysis
Results represent the mean ± standard error of the mean (SEM). Comparison between 2 groups was performed using the Mann-Whitney test; Wilcoxon matched-pairs signed rank test was used for FA treatment experiments using human PBMC. For comparison between more than 2 groups, 1-way analysis of variance (ANOVA) followed by Dunnett test or Sidak test or 2-way ANOVA followed by Sidak test was performed. Statistical significance was denoted as *P < .05, **P < .01, ***P < .001, ****P <.0001. All calculations were performed using GraphPad Prism 7 software.
Results
Human B-cell lymphoma impairs NK cell cytokine response
NK cells play a critical role in the control of non-Hodgkin lymphoma,31,32 but can become dysfunctional in lymphoma patients.33,34 To understand how B-cell lymphoma affects NK cell effector function, we assessed maturation and cytokine-induced effector responses of NK cells derived from DLBCL patients. Based on expression of CD56 and CD16, there was no significant difference in the maturation state of circulating NK cells between healthy and DLBCL patient-derived NK cells (Figure 1A-B). Furthermore, patient- and control-derived NK cells displayed similar killing of K562 target cells (Figure 1C). DLBCL patient-derived NK cells, however, showed reduced degranulation upon target cell recognition, suggesting cytokine secretion, another important antitumor effector function of NK cells, may be impaired (Figure 1D). Indeed, significantly lower frequencies of DLBCL patient-derived NK cells produced IFN-γ in response to stimulation (Figure 1E). Notably, all NK cell subsets identified by differential expression of CD56 and CD16 consistently displayed reduced IFN-γ expression except CD56dimCD16− NK cells (supplemental Figure 1). Thus, human B-cell lymphomas dampen production of IFN-γ from NK cells without altering their maturation or cytotoxic activity.
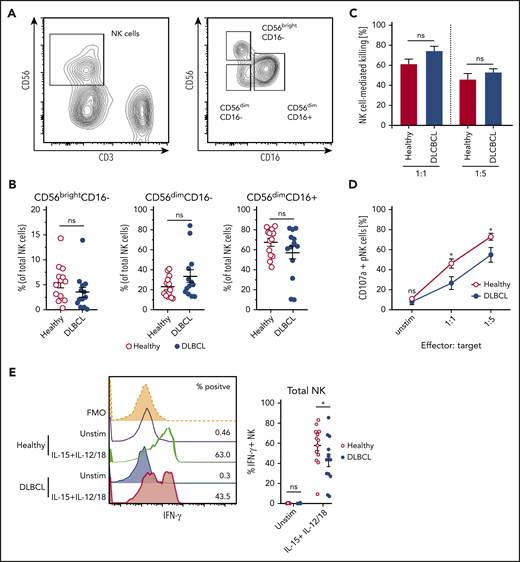
NK cells derived from DLBCL patients produce less IFN-γ. (A-B) Subset composition of NK cells from human peripheral blood monocytes (PBMC) from healthy donors and diffuse large B-cell lymphoma (DLBCL) patients defined by expression of CD56 and CD16. (A) Representative flow cytometric plot showing the gating strategy for NK cells and NK cell subsets. (B) Frequencies of NK cell subsets (n = 13 each group). (C-D) NK cells were flow cytometry-purified from the PBMCs of healthy or DLBCL donors. NK cells were cultured with IL-2 in vitro to obtain sufficient numbers. NK cells were then cocultured with K562 cells for 6 hours at 1:1 or 1:5 effector: target ratios. (C) Frequencies of K562 target cells that were killed after coculture (n = 4-5 each group). (D) Frequencies of NK cells undergoing degranulation (CD107a+). (E) PBMC from healthy donors and DLBCL patients were stimulated with IL-15 + IL-12 + IL-18 for 20 hours or left unstimulated. GolgiPlug was added for the last 4 hours to stop protein release. Frequencies of IFN-γ/granzyme B (GzmB)-producing NK cells were assessed by flow cytometry (n = 13 each group). Data show mean ± SEM; statistical significance (*P < .05; NS, not significant) was determined by (B) Mann-Whitney test or by (C-E) 2-way ANOVA followed by Sidak test.
NK cells derived from DLBCL patients produce less IFN-γ. (A-B) Subset composition of NK cells from human peripheral blood monocytes (PBMC) from healthy donors and diffuse large B-cell lymphoma (DLBCL) patients defined by expression of CD56 and CD16. (A) Representative flow cytometric plot showing the gating strategy for NK cells and NK cell subsets. (B) Frequencies of NK cell subsets (n = 13 each group). (C-D) NK cells were flow cytometry-purified from the PBMCs of healthy or DLBCL donors. NK cells were cultured with IL-2 in vitro to obtain sufficient numbers. NK cells were then cocultured with K562 cells for 6 hours at 1:1 or 1:5 effector: target ratios. (C) Frequencies of K562 target cells that were killed after coculture (n = 4-5 each group). (D) Frequencies of NK cells undergoing degranulation (CD107a+). (E) PBMC from healthy donors and DLBCL patients were stimulated with IL-15 + IL-12 + IL-18 for 20 hours or left unstimulated. GolgiPlug was added for the last 4 hours to stop protein release. Frequencies of IFN-γ/granzyme B (GzmB)-producing NK cells were assessed by flow cytometry (n = 13 each group). Data show mean ± SEM; statistical significance (*P < .05; NS, not significant) was determined by (B) Mann-Whitney test or by (C-E) 2-way ANOVA followed by Sidak test.
B-cell lymphoma environment suppresses NK cell IFN-γ production
To examine mechanisms underpinning suppression of NK cell function in lymphoma, we used Eµ-myc lymphoma, a murine model of aggressive B-cell lymphoma in which NK cells contribute to immunotherapeutic efficacy.6,7,35 Analyses of mice harboring Eµ-myc lymphoma (Eµ-myc mice from here on) showed reduced abundance of NK cells in bone marrow and spleen compared with healthy mice (Figure 2A-B). Furthermore, in Eµ-myc mice, NK cell maturation defined by CD27 and CD11b expression was skewed toward the fully mature CD11b single positive stage, with a concomitant reduction in CD27 and CD11b double-positive NK cells (Figure 2A,C). NK cells in Eµ-myc mice displayed upregulation of the inhibitory receptor TIGIT, closely associated with functional impairments in NK cells in the tumor environment36 (Figure 2D). Consistent with the human DLBCL data, NK cells derived from Eµ-myc mice displayed intact killing ability against Yac-1 target cells (supplemental Figure 2A). However, NK cells from lymphoma-bearing mice showed severely reduced production of IFN-γ after in vivo stimulation with IL-12 and IL-18 (Figure 2E-F). Consistent with this finding, lymphoma-derived NK cells also displayed impaired production of IFN-γ and GzmB in response to α-galactosylceramide, which triggers NK cell activation via NKT cell-driven induction of IL-1237 (Figure 2G). Finally, we also observed reduced IFN-γ production from Eµ-myc mice derived NK cells after stimulation of whole splenocyte cultures in vitro (supplemental Figure 2B). This was not dependent on changes in NK cell maturation because all NK cell subsets derived from Eµ-myc mice showed reduced IFN-γ (supplemental Figure 2C). Overall, these results indicate that aggressive lymphomas disrupted NK cell homeostasis and impaired their cytokine-producing potential in a tumor environment-dependent manner.
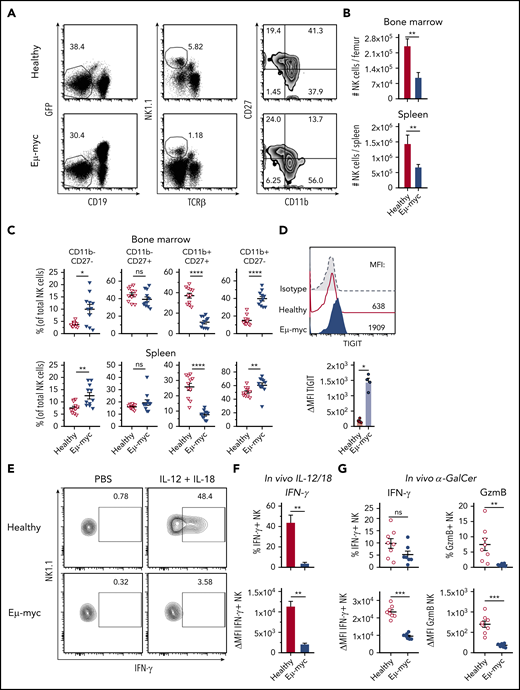
The lymphoma microenvironment suppresses NK cell cytokine production. (A-C) C57BL6/J mice were inoculated IV with GFP+ Eµ-myc lymphoma cells (1 × 10⁵ cells). NK cells derived from spleens and bone marrows of Eµ-myc lymphoma bearing or healthy mice were analyzed on days 14 through 18 after inoculation. (A) Abundance of NK cells in spleen and bone marrow (n = 7) and (B) proportions of mature NK cell subsets were measured by CD11b and CD27 expression on NK cells derived from healthy and Eµ-myc lymphoma spleen (n = 11). (A) Numbers in the representative plots denote the percentages of populations of the parental gates. (D) Analysis of splenic NK cells derived from Eµ-myc lymphoma-bearing or healthy mice were analyzed on 14 days after inoculation to assess expression of TIGIT (n = 4-5). (E-F) IL-12 and IL-18 were administered to healthy and Eµ-myc lymphoma-bearing mice on day 17 after lymphoma inoculation. Splenocytes were harvested 20 hours later and treated with GolgiPlug for 4 hours to stop cytokine release before flow cytometric analysis of intracellular cytokine production (n = 5). (E) The percentages of cytokine IFN-γ-producing NK cells, and (F) Δ mean fluorescent intensity (ΔMFI, MFI of staining Ab minus MFI of respective isotype Ab) of IFN-γ of cytokine-producers are shown. Numbers in the representative plots denote the percentages of IFN-γ-producing NK cells. (G) α galactosylceramide (αGC) was administered to healthy and Eµ-myc lymphoma-bearing mice on day 14 after lymphoma inoculation. Splenocytes were harvested 20 hours later and treated with GolgiPlug for 4 hours before flow cytometric analysis. IFN-γ (left) and GzmB (right) were assessed by flow cytometry (n = 8). Data show mean ± SEM; statistical significance (*P < .05; **P < .01; ***P < .001; ****P < .0001; NS, not significant) was determined by Mann-Whitney test.
The lymphoma microenvironment suppresses NK cell cytokine production. (A-C) C57BL6/J mice were inoculated IV with GFP+ Eµ-myc lymphoma cells (1 × 10⁵ cells). NK cells derived from spleens and bone marrows of Eµ-myc lymphoma bearing or healthy mice were analyzed on days 14 through 18 after inoculation. (A) Abundance of NK cells in spleen and bone marrow (n = 7) and (B) proportions of mature NK cell subsets were measured by CD11b and CD27 expression on NK cells derived from healthy and Eµ-myc lymphoma spleen (n = 11). (A) Numbers in the representative plots denote the percentages of populations of the parental gates. (D) Analysis of splenic NK cells derived from Eµ-myc lymphoma-bearing or healthy mice were analyzed on 14 days after inoculation to assess expression of TIGIT (n = 4-5). (E-F) IL-12 and IL-18 were administered to healthy and Eµ-myc lymphoma-bearing mice on day 17 after lymphoma inoculation. Splenocytes were harvested 20 hours later and treated with GolgiPlug for 4 hours to stop cytokine release before flow cytometric analysis of intracellular cytokine production (n = 5). (E) The percentages of cytokine IFN-γ-producing NK cells, and (F) Δ mean fluorescent intensity (ΔMFI, MFI of staining Ab minus MFI of respective isotype Ab) of IFN-γ of cytokine-producers are shown. Numbers in the representative plots denote the percentages of IFN-γ-producing NK cells. (G) α galactosylceramide (αGC) was administered to healthy and Eµ-myc lymphoma-bearing mice on day 14 after lymphoma inoculation. Splenocytes were harvested 20 hours later and treated with GolgiPlug for 4 hours before flow cytometric analysis. IFN-γ (left) and GzmB (right) were assessed by flow cytometry (n = 8). Data show mean ± SEM; statistical significance (*P < .05; **P < .01; ***P < .001; ****P < .0001; NS, not significant) was determined by Mann-Whitney test.
B-cell lymphoma induces lipid metabolism-related gene transcription in NK cells
To understand the mechanisms behind the functional impairment of NK cells in the lymphoma environment, we performed transcriptional profiling of NK cells sorted from healthy and Eµ-myc mice. RNA sequencing identified 479 significantly differentially regulated genes (log2 fold-change >1.5, adjusted P < .05; supplemental Table 1). Genes significantly upregulated in Eµ-myc mice derived NK cells included Tigit and Lag3, encoding inhibitory receptors, and Il10, encoding an immunosuppressive cytokine, suggesting that the cells had acquired a functionally “exhausted” phenotype in the lymphoma environment (Figure 3A). Consistent with this notion, gene set enrichment analysis revealed the gene ontology (GO) term “negative regulation of immune system process” as significantly enriched in NK cells derived from Eµ-myc mice (Figure 3B). Notably, Ifng and Tnf were not identified as differentially expressed genes, indicating that expression of these molecules was suppressed at posttranscriptional level. Eµ-myc mice-derived NK cells also showed enrichment of “response to lipid” and related GO terms (Figure 3C; supplemental Figure 3A); genes related to lipid metabolism accounted for ∼80% of significantly upregulated metabolic genes (Figure 3D). This included genes such as Cd36, also upregulated at the protein level (Figure 3E), and Fabp4, Fabp5, and Pparg, critical regulators of lipid metabolic processes (Figure 3F; supplemental Figure 3B). Thus, NK cells in a lymphoma environment undergo substantial transcriptional rewiring of lipid metabolism pathways.
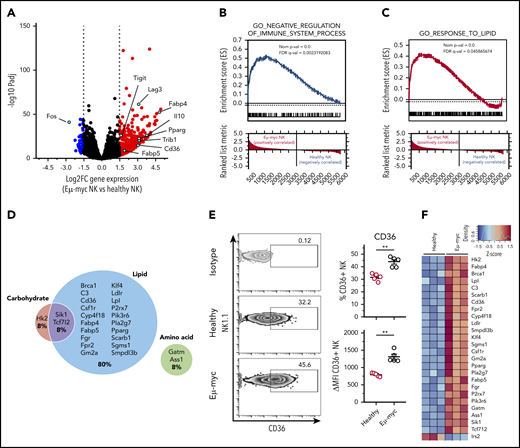
NK cells derived from lymphoma bearing mice show transcriptional upregulation of lipid metabolism. Splenic NK cells were purified from Eµ-myc lymphoma-bearing or healthy mice using flow cytometry at 14 days after inoculation of the lymphoma. The purified NK cells were subjected to RNAseq. (A) Volcano plot displaying log2-fold change (FC) and negative log10 adjusted P value of gene expression comparing NK cells derived from Eµ-myc vs healthy mice. Upregulated or downregulated genes in Eµ-myc compared with healthy NK are highlighted as red or blue, respectively. (B-C) Preranked gene set enrichment analysis (GSEA) of Eµ-myc vs healthy NK cell transcriptomes showing enrichment for gene ontology (GO) terms including “Negative regulation of immune system process” (B) “response to lipid” (C). (D) Genes in GO term “cellular metabolic process” were categorized into relevant subgroups (cell carbohydrates, cell lipid, cell amino acid, cell carb × cell amino, cell carb × cell lipid, cell lipid × cell amino acid). The Euler diagram was generated to show the percentages of significantly upregulated genes assigned to each subgroup. The size of each circle is proportional to the number of genes assigned to each subgroup. (E) Splenocytes were harvested from healthy and Eµ-myc lymphoma-bearing mice at day 14 postinoculation and CD36 expression of NK cells was assessed by flow cytometry (n = 5). Numbers in the representative plots denote the percentages of NK cells expressing CD36. Data show mean ± SEM; statistical significance (**P < .01) was determined by Mann-Whitney test. (F) Heatmap of differentially expressed genes involved in cellular metabolism.
NK cells derived from lymphoma bearing mice show transcriptional upregulation of lipid metabolism. Splenic NK cells were purified from Eµ-myc lymphoma-bearing or healthy mice using flow cytometry at 14 days after inoculation of the lymphoma. The purified NK cells were subjected to RNAseq. (A) Volcano plot displaying log2-fold change (FC) and negative log10 adjusted P value of gene expression comparing NK cells derived from Eµ-myc vs healthy mice. Upregulated or downregulated genes in Eµ-myc compared with healthy NK are highlighted as red or blue, respectively. (B-C) Preranked gene set enrichment analysis (GSEA) of Eµ-myc vs healthy NK cell transcriptomes showing enrichment for gene ontology (GO) terms including “Negative regulation of immune system process” (B) “response to lipid” (C). (D) Genes in GO term “cellular metabolic process” were categorized into relevant subgroups (cell carbohydrates, cell lipid, cell amino acid, cell carb × cell amino, cell carb × cell lipid, cell lipid × cell amino acid). The Euler diagram was generated to show the percentages of significantly upregulated genes assigned to each subgroup. The size of each circle is proportional to the number of genes assigned to each subgroup. (E) Splenocytes were harvested from healthy and Eµ-myc lymphoma-bearing mice at day 14 postinoculation and CD36 expression of NK cells was assessed by flow cytometry (n = 5). Numbers in the representative plots denote the percentages of NK cells expressing CD36. Data show mean ± SEM; statistical significance (**P < .01) was determined by Mann-Whitney test. (F) Heatmap of differentially expressed genes involved in cellular metabolism.
B-cell lymphoma environment affects NK cell metabolism
Consistent with our transcriptional profiling, analysis of the metabolic profiles showed that NK cells derived from Eµ-myc mice exhibited a marked increase in neutral lipid levels (Figure 4A). Similarly, DLBCL patient-derived NK cells exhibited elevated neutral lipid levels compared with those derived from healthy donors (Figure 4B), as did NK cells from an AML environment (supplemental Figure 4A). Eµ-myc NK cells compared with healthy NK cells also showed a significant and progressive reduction in mitochondrial mass (measured by MitoTracker DeepRedFM) and membrane potential (measured by MitoTracker Red CMXROS)38 as measured by flow cytometry and microscopic imaging (Figure 4C-E; supplemental Figure 4B). Notably, this was independent from CD27 and CD11b expression, indicating that altered mitochondria were not due to skewed NK subset composition (supplemental Figure 4C). Furthermore, phosphorylation of mTOR and AKT, a regulator of mTORC1, were suppressed in Eµ-myc NK cells after cytokine stimulation (Figure 4F-G; supplemental Figure 4D-E). Indeed, phosphorylation of S6, a downstream target of mTOR activity, was severely impaired in NK cells at advanced stage of lymphoma both after in vitro and in vivo cytokine stimulation (Figure 4H-I; supplemental Figure 4F). Induction of p-S6 was impaired in all NK cell subsets (supplemental Figure 4G). Thus, lymphoma and leukemia affects NK cell metabolism.
![NK cells show increased lipid accumulation and reduced mitochondrial metabolism in the lymphoma environment. (A) Splenocytes from healthy and Eµ-myc lymphoma-bearing mice were harvested at 14 to 21 days after inoculation, and neutral lipid levels were measured (n = 8). (B) Neutral lipid levels of NK cells derived from PBMC of healthy donors or DLBCL patients were examined (n = 13). (C-D) Mitochondrial mass (MT DeepRed FM) on splenic NK cells derived from healthy and Eµ-myc lymphoma-bearing mice were examined at days 5, 14, and 21 after lymphoma inoculation by (C) flow cytometry or at day 14. Representative flow cytometric histograms were obtained at day 14 (n = 8). (D) Splenic NK cells derived from healthy and Eµ-myc lymphoma bearing mice were examined at day 14 using imaging cytometry (NK1.1+ TCRβ−) (bright field [B.F.], NK1.1, MT DeepRed FM, merged). The images show 1 representative cell from 5 mice/group and negative controls (MT -ve). The graph shows geometric mean intensity of MT DeepRed FM derived from the imaging cytometry (n = 5). (E) Mitochondrial membrane potential on splenic NK cells were examined as in panel C (n = 8). Phosphorylation of (F) AKT and (G) mTOR of splenic NK cells was assessed by flow cytometry (n = 4). (H) Splenocytes were harvested from healthy and Eµ-myc mice at days 5 and 14 after lymphoma inoculation, then stimulated with IL-15 + IL-12/18 for 4 hours in vitro, before phosphorylation of S6 of splenic NK cells was assessed by flow cytometry (n = 8). (I) IL-12 and IL-18 were administered to healthy and Eµ-myc mice on day 17 after lymphoma inoculation and phosphorylated S6 of splenic NK cells was analyzed 20 hours later by flow cytometry (n = 5). Data show mean ± SEM; statistical significance (*P < .05; **P < .01; ***P < .001; ****P < .0001; NS, not significant) was determined by Mann-Whitney test (A-B,D) or 2-way ANOVA followed by Sidak test (C,E-I).](https://ash.silverchair-cdn.com/ash/content_public/journal/blood/136/26/10.1182_blood.2020005602/1/m_bloodbld2020005602f4.png?Expires=1769083804&Signature=SXtJYOflXYG0rgUA3pxfVA-asHaWzKtq1fic-ED2hRRbM55e2~a1U7x6yGHk5gF~vzkrkLL2CEATdeHJIwnchAuoGs3rQNkjkTpays-VLTfq6~FedMklzQ8tEqc4XMt~s2Ibuw45NZXtKTo-HraI9Fwz3Z0bOzN4WL19aZolrYkZSpY9SvO27EQPqHudozORLOquDOeOCwpP4K1GXJ3uHuSC5UkrqxXZC99Rcj6mukEiPLrWFED3zptWlotm3DE8BIwe8lan9hlewKI0vec~xajBsMyUQC4HGiykzCFYaSLotTLjEWRsoUAGwzSI-XRePmtYah4CbsHLYaYngPS-cQ__&Key-Pair-Id=APKAIE5G5CRDK6RD3PGA)
NK cells show increased lipid accumulation and reduced mitochondrial metabolism in the lymphoma environment. (A) Splenocytes from healthy and Eµ-myc lymphoma-bearing mice were harvested at 14 to 21 days after inoculation, and neutral lipid levels were measured (n = 8). (B) Neutral lipid levels of NK cells derived from PBMC of healthy donors or DLBCL patients were examined (n = 13). (C-D) Mitochondrial mass (MT DeepRed FM) on splenic NK cells derived from healthy and Eµ-myc lymphoma-bearing mice were examined at days 5, 14, and 21 after lymphoma inoculation by (C) flow cytometry or at day 14. Representative flow cytometric histograms were obtained at day 14 (n = 8). (D) Splenic NK cells derived from healthy and Eµ-myc lymphoma bearing mice were examined at day 14 using imaging cytometry (NK1.1+ TCRβ−) (bright field [B.F.], NK1.1, MT DeepRed FM, merged). The images show 1 representative cell from 5 mice/group and negative controls (MT -ve). The graph shows geometric mean intensity of MT DeepRed FM derived from the imaging cytometry (n = 5). (E) Mitochondrial membrane potential on splenic NK cells were examined as in panel C (n = 8). Phosphorylation of (F) AKT and (G) mTOR of splenic NK cells was assessed by flow cytometry (n = 4). (H) Splenocytes were harvested from healthy and Eµ-myc mice at days 5 and 14 after lymphoma inoculation, then stimulated with IL-15 + IL-12/18 for 4 hours in vitro, before phosphorylation of S6 of splenic NK cells was assessed by flow cytometry (n = 8). (I) IL-12 and IL-18 were administered to healthy and Eµ-myc mice on day 17 after lymphoma inoculation and phosphorylated S6 of splenic NK cells was analyzed 20 hours later by flow cytometry (n = 5). Data show mean ± SEM; statistical significance (*P < .05; **P < .01; ***P < .001; ****P < .0001; NS, not significant) was determined by Mann-Whitney test (A-B,D) or 2-way ANOVA followed by Sidak test (C,E-I).
NK cells show increased lipid accumulation and reduced mitochondrial metabolism in the lymphoma environment. (A) Splenocytes from healthy and Eµ-myc lymphoma-bearing mice were harvested at 14 to 21 days after inoculation, and neutral lipid levels were measured (n = 8). (B) Neutral lipid levels of NK cells derived from PBMC of healthy donors or DLBCL patients were examined (n = 13). (C-D) Mitochondrial mass (MT DeepRed FM) on splenic NK cells derived from healthy and Eµ-myc lymphoma-bearing mice were examined at days 5, 14, and 21 after lymphoma inoculation by (C) flow cytometry or at day 14. Representative flow cytometric histograms were obtained at day 14 (n = 8). (D) Splenic NK cells derived from healthy and Eµ-myc lymphoma bearing mice were examined at day 14 using imaging cytometry (NK1.1+ TCRβ−) (bright field [B.F.], NK1.1, MT DeepRed FM, merged). The images show 1 representative cell from 5 mice/group and negative controls (MT -ve). The graph shows geometric mean intensity of MT DeepRed FM derived from the imaging cytometry (n = 5). (E) Mitochondrial membrane potential on splenic NK cells were examined as in panel C (n = 8). Phosphorylation of (F) AKT and (G) mTOR of splenic NK cells was assessed by flow cytometry (n = 4). (H) Splenocytes were harvested from healthy and Eµ-myc mice at days 5 and 14 after lymphoma inoculation, then stimulated with IL-15 + IL-12/18 for 4 hours in vitro, before phosphorylation of S6 of splenic NK cells was assessed by flow cytometry (n = 8). (I) IL-12 and IL-18 were administered to healthy and Eµ-myc mice on day 17 after lymphoma inoculation and phosphorylated S6 of splenic NK cells was analyzed 20 hours later by flow cytometry (n = 5). Data show mean ± SEM; statistical significance (*P < .05; **P < .01; ***P < .001; ****P < .0001; NS, not significant) was determined by Mann-Whitney test (A-B,D) or 2-way ANOVA followed by Sidak test (C,E-I).
Elevated FAs in lymphomas suppress cytokine responses of NK cells
Human B-cell lymphoma is closely linked to increased lipid metabolism, and several studies have shown elevated FAs in the serum of lymphoma patients and in mouse lymphoma.39-41 Consistent with this notion, plasma concentrations of several FAs were significantly elevated in Eµ-myc mice (Figure 5A), whereas lactate, glucose, and cholesterol were not altered (supplemental Figure 5A). To test the implications of this finding, we treated NK cells with a range of different FAs. PA and SA, 2 saturated FAs, but not OA and LA, 2 unsaturated FAs, impaired expression of IFN-γ, TNF, and GzmB (Figure 5B). FA treatments did not adversely affect viability except for steric acid (supplemental Figure 5B). Increasing amounts of PA or prolonged exposure prior to stimulation led to increased suppression of IFN-γ, TNF, and GzmB without a significant reduction in viability (Figure 5C; supplemental Figure 5C-D). Similarly, elevated amounts of PA suppressed both IFN-γ and GzmB production by human NK cells (Figure 5D). Finally, to elucidate the effects of FAs in more physiological conditions, a combination of FAs at lower concentrations was tested. The FA mixture significantly reduced the expression of IFN-γ and GzmB without affecting the viability (Figure 5E; supplemental Figure 5E). In summary, these results indicate that lymphoma cells have an increased capacity to produce FAs that negatively affect NK cell function.
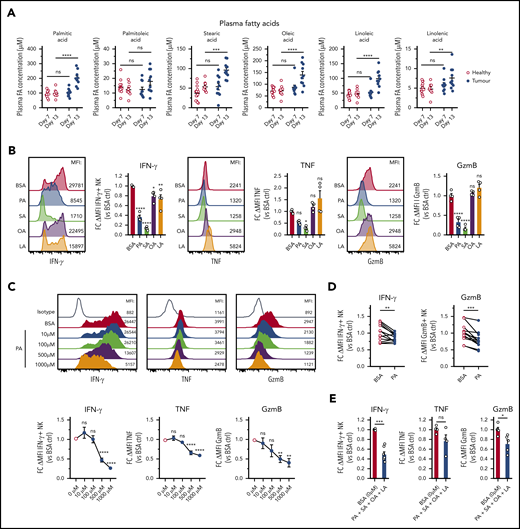
B-cell lymphoma leads to elevation of fatty acid levels associated with repressed NK cell function. (A) Plasma samples were collected from healthy and Eµ-myc lymphoma-bearing mice on day 7 and 13 days after lymphoma inoculation, and plasma fatty acid (FA) levels including myristic acid, palmitic acid (PA), palmitoleic acid, steric acid (SA), oleic acid (OA), linoleic acid (LA), and linolenic acid were measured using liquid chromatography mass spectrometry (LC-MS) (n = 10-14). (B) Splenic NK cells were isolated and expanded in culture for 10 days with IL-15, after which they were either pretreated with IL-15 + 400 µM of PA, SA, OA, LA, or bovine serum albumin (BSA) control, or (C) IL-15 + increasing amounts of PA or BSA control for 48 hours, followed by 20 hours stimulation with IL-12 + IL-15 + IL-18 in the presence of FAs. GolgiPlug was added for the last 4 hours to stop protein release. Expression of IFN-γ, TNF, and GzmB was assessed by flow cytometry (n = 4-8). (D) Human PBMCs were pretreated with PA for 4 hours, followed by cytokine stimulation and measurement of expression of IFN-γ and GzmB (n = 13). (E) Mouse NK cells were pretreated with IL-15 + 4 FAs combined (100 µM of PA, SA, OA, and LA) or BSA control for 48 hours, followed by cytokine stimulation and measurement of expression of IFN-γ, TNF, and GzmB as in D (n = 4-7). Fold changes (FC) were calculated as δ MFI (MFI of target Ab staining minus MFI of isotype control staining) relative to that of BSA control. Data show mean ± SEM; statistical significance (*P < .05; **P < .01; ***P < .001; ****P < .0001; NS, not significant) was determined by 2-way ANOVA followed by (A) Sidak test, (B-C) 1-way ANOVA followed by Dunnett test, (D) Wilcoxon test, or (E) Mann-Whitney test.
B-cell lymphoma leads to elevation of fatty acid levels associated with repressed NK cell function. (A) Plasma samples were collected from healthy and Eµ-myc lymphoma-bearing mice on day 7 and 13 days after lymphoma inoculation, and plasma fatty acid (FA) levels including myristic acid, palmitic acid (PA), palmitoleic acid, steric acid (SA), oleic acid (OA), linoleic acid (LA), and linolenic acid were measured using liquid chromatography mass spectrometry (LC-MS) (n = 10-14). (B) Splenic NK cells were isolated and expanded in culture for 10 days with IL-15, after which they were either pretreated with IL-15 + 400 µM of PA, SA, OA, LA, or bovine serum albumin (BSA) control, or (C) IL-15 + increasing amounts of PA or BSA control for 48 hours, followed by 20 hours stimulation with IL-12 + IL-15 + IL-18 in the presence of FAs. GolgiPlug was added for the last 4 hours to stop protein release. Expression of IFN-γ, TNF, and GzmB was assessed by flow cytometry (n = 4-8). (D) Human PBMCs were pretreated with PA for 4 hours, followed by cytokine stimulation and measurement of expression of IFN-γ and GzmB (n = 13). (E) Mouse NK cells were pretreated with IL-15 + 4 FAs combined (100 µM of PA, SA, OA, and LA) or BSA control for 48 hours, followed by cytokine stimulation and measurement of expression of IFN-γ, TNF, and GzmB as in D (n = 4-7). Fold changes (FC) were calculated as δ MFI (MFI of target Ab staining minus MFI of isotype control staining) relative to that of BSA control. Data show mean ± SEM; statistical significance (*P < .05; **P < .01; ***P < .001; ****P < .0001; NS, not significant) was determined by 2-way ANOVA followed by (A) Sidak test, (B-C) 1-way ANOVA followed by Dunnett test, (D) Wilcoxon test, or (E) Mann-Whitney test.
Excessive supply of FAs suppress NK cell metabolism
We next tested the effect of PA on cytokine-induced activation of NK cell metabolism. The uptake of the glucose analog 2-NBDG was potently suppressed by PA (Figure 6A). In line with a role for FA in limiting glucose uptake, Eµ-myc NK cells also displayed mildly reduced 2-NBDG uptake ex vivo (supplemental Figure 6). Furthermore, PA also significantly suppressed activation-induced increases in glycolysis and OXPHOS, as indicated by reduced basal ECAR, OCR, and maximal OCR (Figure 6B-C). Overall, these results indicate that PA potently suppresses cytokine-induced activation of NK cell metabolism.
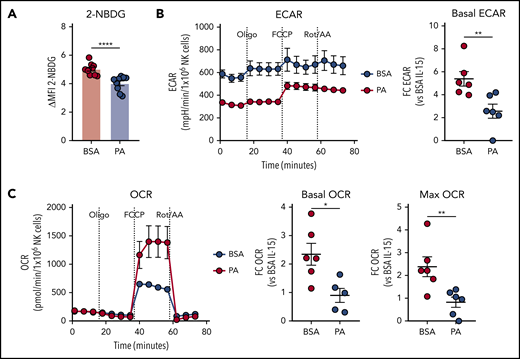
Excessive supply of fatty acid suppresses NK cell metabolism. (A-C) Splenic NK cells were isolated and expanded with IL-15 in vitro, and effects of palmitic acid (PA) on NK cell metabolism were examined. NK cells were pre-treated with IL-15 + 500 µM PA or BSA control for 24 hours, and stimulated with IL-12 + IL-15 + IL-18 for 20 hours in the presence of fatty acid (FA). (A) 2-NBDG uptake of NK cells measured by flow cytometry (n = 9). (B) Basal extracellular acidification rate (ECAR) and (C) basal oxygen consumption rate (OCR, left), OCR linked to ATP production (middle) and maximal OCR (right) as measured by metabolic flux assay. Fold changes were calculated against IL-15 + BSA controls (n = 6). (A-C) Data show mean ± SEM; statistical significance (*P < .05; **P < .01; ***P < .001; ****P < .0001; NS, not significant) was determined by Mann-Whitney test.
Excessive supply of fatty acid suppresses NK cell metabolism. (A-C) Splenic NK cells were isolated and expanded with IL-15 in vitro, and effects of palmitic acid (PA) on NK cell metabolism were examined. NK cells were pre-treated with IL-15 + 500 µM PA or BSA control for 24 hours, and stimulated with IL-12 + IL-15 + IL-18 for 20 hours in the presence of fatty acid (FA). (A) 2-NBDG uptake of NK cells measured by flow cytometry (n = 9). (B) Basal extracellular acidification rate (ECAR) and (C) basal oxygen consumption rate (OCR, left), OCR linked to ATP production (middle) and maximal OCR (right) as measured by metabolic flux assay. Fold changes were calculated against IL-15 + BSA controls (n = 6). (A-C) Data show mean ± SEM; statistical significance (*P < .05; **P < .01; ***P < .001; ****P < .0001; NS, not significant) was determined by Mann-Whitney test.
PPAR-γ maintains NK cell mitochondrial metabolism in the B-cell lymphoma environment
Our transcriptional profiling showed that members of the PPAR nuclear receptor family may regulate NK cell function in the lymphoma environment. Although Ppard was expressed both in healthy and Eμ-myc NK cells, Pparg was highly upregulated in specifically Eμ-myc NK cells (supplemental Figure 7A). Similarly, FABP4 was highly upregulated in Eµ-myc NK cells, and notably both PPAR-γ and FABP4 have been implicated in lipid metabolism in multiple cell types,42,43 but not NK cells. We confirmed increased PPAR-γ protein in Eµ-myc NK cells by flow cytometry (Figure 7A). Indeed, the PPAR pathway was significantly upregulate in NK cells from Eµ-myc mice (Figure 7B). Therefore, we examined the function of PPAR-γ and FABP4 in NK cells by exposing them to the PPAR-γ inhibitor GW9662 or the FABP4/5 inhibitor BMS309403, respectively. Both mitochondrial mass and membrane potential were decreased in NK cells treated with PPAR-γ or FABP4/5 inhibitors compared with control, and the combination of the 2 inhibitors completely blocked cytokine-induced mitochondrial synthesis and increased in membrane potential (Figure 7C). Notably, the inhibitors were not toxic as seen by negligible impact on viability (supplemental Figure 7B) Metabolic analysis revealed that the inhibition of FABP4/5 resulted in suppression of the cytokine-induced increase in mitochondrial respiration and glycolysis (Figure 7D-E). Furthermore, inhibition of PPAR-γ, FABP4/5, or both significantly suppressed the expression of IFN-γ, but not of GzmB (Figure 7F). These results indicate that FABP4/5 and PPAR-γ play critical roles in metabolism and IFN-γ production by NK cells.
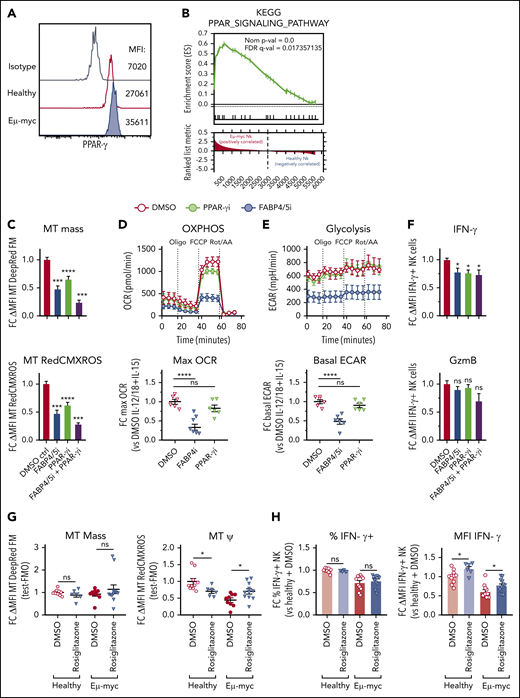
PPAR-γ maintains cytokine-induced NK cell function and metabolism. Functional and transcriptomic analyses of splenic NK cells derived from Eµ-myc lymphoma-bearing or healthy mice. (A) Splenocytes from healthy and Eµ-myc lymphoma-bearing mice were harvested at 14 days after inoculation, and PPAR-γ protein expression was determined by flow cytometry. (B) Gene set enrichment analysis (GSEA) of Eµ-myc vs healthy NK cell transcriptomes as Figure 3 showing enrichment for KEGG pathway “PPAR signalling.” Functional significance of mediators of lipid metabolism was examined using pharmacological antagonists for PPAR-γ (PPAR-γi: 10 µM GW9662), FABP4/5 (FABP4/5i: 100 µM BMS309403), or a combination of both (FABP4/5i + PPAR-γi). (C-F) Splenic NK cells were isolated and expanded in culture in the presence of IL-15 (50 ng/mL) for 10 days, and treated with PPAR-γi, FABP4/5i, FABP4/5i + PPAR-γi, or DMSO control in the presence of IL-15 (10 ng/mL) for 24 hours, then stimulated with IL-12 (1 ng/mL) and IL-18 (1 ng/mL) for 20 hours. (C) Mitochondrial mass and membrane potential were measured by flow cytometry (n = 6). (D-E) Metabolic analysis to examine real-time changes in maximal OCR (D) and ECAR (n = 6) (E). (F) Expression of IFN-γ and GzmB was assessed by flow cytometry (n = 9). (G) Wild-type Eµ-myc lymphoma-bearing mice were administered rosiglitazone (200 µg) or vehicle (2% DMSO/H2O) daily from days 6 to 12. Spleens were harvested 1 day later, and mitochondrial mass and membrane potential were determined (n = 6-11 per group). (H) Splenocytes from mice as in panel F were stimulated with IL-12 + IL-15 + IL-18 for 20 hours. GolgiPlug was added for the last 4 hours to stop cytokine release before (left) the proportion of IFN-γ-producing NK cells and (right) the expression levels of IFN-γ were assessed by flow cytometry (n = 6-11 per group). Fold changes (FC) were calculated as δ MFI (MFI of target antibody staining or fluorescent probes for metabolism minus MFI of fluorescence mean of 0 (FMO) or isotype control staining) relative to that of DMSO controls. Data show mean ± SEM; statistical significance (*P < .05; **P < .01; ***P < .001; ****P < .0001; NS, not significant) was determined by 1-way ANOVA Dunnett test (C-F) or Mann-Whitney test (G-I).
PPAR-γ maintains cytokine-induced NK cell function and metabolism. Functional and transcriptomic analyses of splenic NK cells derived from Eµ-myc lymphoma-bearing or healthy mice. (A) Splenocytes from healthy and Eµ-myc lymphoma-bearing mice were harvested at 14 days after inoculation, and PPAR-γ protein expression was determined by flow cytometry. (B) Gene set enrichment analysis (GSEA) of Eµ-myc vs healthy NK cell transcriptomes as Figure 3 showing enrichment for KEGG pathway “PPAR signalling.” Functional significance of mediators of lipid metabolism was examined using pharmacological antagonists for PPAR-γ (PPAR-γi: 10 µM GW9662), FABP4/5 (FABP4/5i: 100 µM BMS309403), or a combination of both (FABP4/5i + PPAR-γi). (C-F) Splenic NK cells were isolated and expanded in culture in the presence of IL-15 (50 ng/mL) for 10 days, and treated with PPAR-γi, FABP4/5i, FABP4/5i + PPAR-γi, or DMSO control in the presence of IL-15 (10 ng/mL) for 24 hours, then stimulated with IL-12 (1 ng/mL) and IL-18 (1 ng/mL) for 20 hours. (C) Mitochondrial mass and membrane potential were measured by flow cytometry (n = 6). (D-E) Metabolic analysis to examine real-time changes in maximal OCR (D) and ECAR (n = 6) (E). (F) Expression of IFN-γ and GzmB was assessed by flow cytometry (n = 9). (G) Wild-type Eµ-myc lymphoma-bearing mice were administered rosiglitazone (200 µg) or vehicle (2% DMSO/H2O) daily from days 6 to 12. Spleens were harvested 1 day later, and mitochondrial mass and membrane potential were determined (n = 6-11 per group). (H) Splenocytes from mice as in panel F were stimulated with IL-12 + IL-15 + IL-18 for 20 hours. GolgiPlug was added for the last 4 hours to stop cytokine release before (left) the proportion of IFN-γ-producing NK cells and (right) the expression levels of IFN-γ were assessed by flow cytometry (n = 6-11 per group). Fold changes (FC) were calculated as δ MFI (MFI of target antibody staining or fluorescent probes for metabolism minus MFI of fluorescence mean of 0 (FMO) or isotype control staining) relative to that of DMSO controls. Data show mean ± SEM; statistical significance (*P < .05; **P < .01; ***P < .001; ****P < .0001; NS, not significant) was determined by 1-way ANOVA Dunnett test (C-F) or Mann-Whitney test (G-I).
To test the function of PPAR-γ in NK cells in vivo, we administered rosiglitazone, a pharmacological agonist of PPAR-γ, to Eµ-myc mice and examined the function of NK cells. Consistent with the aggressive nature of the Eµ-myc lymphoma model therapeutic administration of rosiglitazone did not delay disease progression or reduced lymphoma load (supplemental Figure 7C-D). Notably, although rosiglitazone had no effect on mitochondrial mass, it reduced mitochondrial membrane potential of healthy NK cells while improving it in lymphoma NK cells (Figure 7G). Rosiglitazone also significantly increased IFN-γ production of NK cells on a per-cell basis (Figure 7H). Thus, the PPAR-γ/FABP pathway supports mitochondrial metabolism and IFN-γ production of NK cells in the lymphoma microenvironment.
Discussion
Aggressive B-cell lymphoma and other hematological malignancies dampen NK cell function. However, the mechanisms that control NK cell homeostasis or function in the lymphoma environment remain poorly understood. Here we found that NK cell effector cytokine production, in particular IFN-γ, was impaired in DLBCL patients as well as in a preclinical mouse models of B-cell lymphoma. This was associated with a substantial rewiring of transcription of metabolic pathways related to lipid metabolism. Increased FA levels in the B-cell lymphoma environment resulted in lipid accumulation and dampened NK cell effector function and mitochondrial metabolism. NK cells in the lymphoma environment specifically upregulated PPAR-γ expression to support mitochondrial metabolism and function of NK cells. Thus, altered lipid metabolism constitutes an adaptation that allows for the maintenance of NK cells in the lymphoma environment.
NK cells in the lymphoma environment displayed a pronounced change in maturation status, indicated by a decrease in the proportion of CD27+ cells and an increase in the proportion of CD11b+ CD27− cells. CD27+ NK cells are more proliferative and display higher metabolic activity compared with CD27− NK cells,15 suggesting they are more sensitive to altered metabolite and nutrient levels in metabolically hostile environments, such as in lymphomas. Alternatively, as the low-grade inflammation that characterizes the tumor environment may drive activation and terminal differentiation of NK cells, the CD11b+CD27− NK cell subset bias in lymphoma may be due in part to the altered cytokine environment.
Our data show that elevated amounts of FAs, as found in the lymphoma environment, caused remarkable alterations in NK cell metabolism such as reduced mitochondrial metabolism and impaired cytokine production. Indeed, increased FA in particular palmitic acid is associated with poor prognosis of lymphoma patients44 and disease progression after chemotherapy.41,45 Our results are consistent with a recent study that found lipid accumulation in NK cells derived from obese patients and showed that high levels of FAs caused NK cell dysfunction and suppressed mTOR activity.46 Overall, our observations suggest that NK cell activity is limited by high amounts of FA. Thus, targeting FA metabolism may inhibit lymphoma growth directly and improve NK cell function. It is noteworthy that lymphoma may also result in altered levels of other nutrients and an increase in toxic metabolites. Indeed, it has been shown that tumors deprive their environment of amino acids and glucose while releasing toxic metabolites such as lactate, thereby suppressing T-cell function18 . Although our results indicate that glucose and lactate levels did not significantly vary between healthy and Eµ-myc lymphoma-bearing mice, other nutrients and metabolites may be perturbed, contributing to functional alteration of NK cells.
Rewiring of lipid metabolism with increased FA oxidation has been observed in functionally impaired tumor-infiltrating CD8 T cells. This allows the T cell to metabolically adapt to the hypoxic and hypoglycemic conditions in the tumor environment.47 Furthermore, various cell types were shown to increase lipid droplets to attenuate the lipotoxic effects of excessive FAs.48-50 NK cells may also increase lipid synthesis to neutralize the toxic effects of heightened lipid levels in the lymphoma environment. In our study, we observed a significant upregulation of the PPAR signaling pathway, which we attribute to the increased expression of PPAR-γ. This notion is supported by our observation that activation of PPAR-γ in vivo by rosiglitazone, a specific agonist of PPAR-γ, led to partial functional restoration of NK cells in the lymphoma environment. Indeed, rosiglitazone suppressed adverse inflammatory responses and promoted proliferation in high-fat-diet models and has been shown to protect mitochondria under cellular metabolic stress.51-54 These findings together with ours suggest that PPAR-γ aids NK cells in adapting to the lymphoma environment. However, it does not preclude the involvement of PPAR-δ, which is abundantly expressed and also activated by FAs and has been implicated in NK cell functional and metabolic impairment in obesity.46 Thus, it is likely that lymphoma and obesity affect NK cell functions through multiple shared and distinct mechanisms.
A limitation of our study is that all experiments using clinical samples were conducted on frozen blood samples, which may not truly represent the metabolic and functional states of NK cells within the lymphoma microenvironment. Furthermore, the Eµ-myc mouse lymphoma model represents a highly aggressive disseminating disease, unlike the clinically well-managed cohort of DLBCL patients. However, given the similar phenotypic and functional alteration observed in patients and lymphoma bearing mice and the conserved nature of cellular metabolic pathways, it is likely the mechanisms identified in this study contribute to the impaired NK cell function in human lymphoma. Although aggressive lymphomas and solid tumors are associated with increased FA levels,41,55,56 other factors may also contribute to metabolic suppression of NK cells. For example, transforming growth factor-β (TGF-β) is known to influence metabolic reprogramming by interfering with mTOR pathway.57 Indeed, our previous study showed Eµ-myc lymphoma promotes expansion of monocytes with elevated levels of TGF-β expression.58 More data from patients are required to fully evaluate the metabolic changes to NK cells caused by the lymphoma environment. Overall, our data suggest that manipulating cellular metabolism of NK cells constitutes a new therapeutic avenue that could contribute to the treatment of B-cell lymphoma.
The sequencing data have been deposited in National Center for Biotechnology Information's Gene Expression Omnibus under accession number GSE121448.
The online version of this article contains a data supplement.
The publication costs of this article were defrayed in part by page charge payment. Therefore, and solely to indicate this fact, this article is hereby marked “advertisement” in accordance with 18 USC section 1734.
Acknowledgments
The authors acknowledge the excellent support from the Translational Research Institute core facility units and Walter and Eliza Hall Institute facilities, in particular, MS, flow cytometry, and biological resource facility. The authors also acknowledge the experimental support for biochemical analysis from UQ Veterinary Laboratory Service and thank Thomas Stoll and the QIMR Berghofer Metabolomics Facility for technical support including the MS analysis of free fatty acids. In addition, the authors thank Dominique Dubal, Nikolai Gorbunov, Dale David Orr Martin, Fernando Souza-Fonseca-Guimaraes, Rebecca Delconte, Nicholas Huntington, and Dirk Brenner for scientific advice.
This work was funded by National Health and Medical Research Council grant 1044355 (S.R.M.), and fellowships 1061429 (S.R.M.), and 1139607 (A.K.), the Sylvia and Charles Viertel Foundation fellowship (A.K.), and a generous donation from Mr. and Mrs. Pegler (S.R.M.).
Authorship
Contribution: This study was conceptualized by T.K., A.K., and S.R.M.; experimental investigations were conducted by T.K., P.Y.L., H.J., K.B., R.G., J.T., N.J., and R.L.; bioinformatics were performed by T.K., V.M., and Z.K.T.; data were curated by V.M. and Z.K.T.; methodology was established by T.K., H.J., P.Y.L., J.T., A.K., and S.R.M.; resources were provided by G.R.L., S.N., M.K.G., M.M.H., and G.T.B.; the original draft was written by T.K., A.K., and S.R.M.; revision and editing was done by T.K., J.T., N.J., S.N., G.T.B., A.K., and S.R.M.; the project was supervised by A.K. and S.R.M.; project administration was done by T.K.; and funding was acquired by A.K. and S.R.M.
Conflict-of-interest disclosure: The authors declare no competing financial interests.
Correspondence: Steven R. Mattarollo, Translational Research Institute, The University of Queensland Diamantina Institute, 37 Kent St, Woolloongabba, QLD 4102, Australia; e-mail: s.mattarollo@uq.edu.au; and Axel Kallies, Peter Doherty Institute for Infection and Immunity, Department of Microbiology and Immunology, University of Melbourne, 792 Elizabeth St, Melbourne, VIC 3000, Australia; e-mail: axel.kallies@unimelb.edu.au.
