

Key Points
Sel1L/Hrd1 ERAD preserves HSC quiescence and self-renewal.
ERAD deficiency via Sel1L knockout leads to accumulation of Rheb and activation of mTOR, which leads to HSC proliferation and activation.

Abstract
Hematopoietic stem cells (HSC) self-renew to sustain stem cell pools and differentiate to generate all types of blood cells. HSCs remain in quiescence to sustain their long-term self-renewal potential. It remains unclear whether protein quality control is required for stem cells in quiescence when RNA content, protein synthesis, and metabolic activities are profoundly reduced. Here, we report that protein quality control via endoplasmic reticulum-associated degradation (ERAD) governs the function of quiescent HSCs. The Sel1L/Hrd1 ERAD genes are enriched in the quiescent and inactive HSCs, and conditional knockout of Sel1L in hematopoietic tissues drives HSCs to hyperproliferation, which leads to complete loss of HSC self-renewal and HSC depletion. Mechanistically, ERAD deficiency via Sel1L knockout leads to activation of mammalian target of rapamycin (mTOR) signaling. Furthermore, we identify Ras homolog enriched in brain (Rheb), an activator of mTOR, as a novel protein substrate of Sel1L/Hrd1 ERAD, which accumulates upon Sel1L deletion and HSC activation. Importantly, inhibition of mTOR, or Rheb, rescues HSC defects in Sel1L knockout mice. Protein quality control via ERAD is, therefore, a critical checkpoint that governs HSC quiescence and self-renewal by Rheb-mediated restriction of mTOR activity.
Introduction
Long-term hematopoietic stem cells (LT-HSCs) are a rare population of cells that reside in the bone marrow niche and are at the apex of hematopoietic hierarchy.1-3 Like many other tissue-specific stem cells,4-10 LT-HSCs largely remain in quiescence at steady state to maintain their self-renewal potential. However, in response to emergencies such as infection or bleeding, HSCs increase their proliferation and differentiate to generate mature blood cells. HSC self-renewal, proliferation, and differentiation are tightly regulated to sustain life-long blood production, and imbalance of these processes can lead to hematopoietic failure or malignancies.11,12 Besides, self-renewing LT-HSCs regenerate the adult blood systems after transplantation, which is a curative therapy for many blood and autoimmune diseases.13 Thus, understanding the mechanisms that control HSC quiescence and self-renewal to improve HSC reconstitution after ex vivo expansion has broad implications. However, the intrinsic signaling mechanisms that control HSC quiescence, proliferation and differentiation remain to be fully investigated.
Endoplasmic reticulum (ER) protein quality control pathways have been studied in many mammalian cell types, where there is a persistently high demand for protein quality control because of high levels of protein synthesis and secretion.14 Recent work from our laboratory and others show that ER protein quality control pathways preserve HSC function when ER protein homeostasis is severely perturbed under stress conditions.15-17 However, at steady state, the majority of HSCs divide at an extremely low rate.18-20 These quiescent stem cells exhibit relatively smaller cell size, lower transcriptional and metabolic activity, reduced RNA contents, and very low protein synthesis rate,21-24 raising a question whether protein quality control is important in maintaining stem cell functions when HSCs are in the deeply dormant state.
Here we report that one of the ER protein quality control systems, the Sel1L/Hrd1 ER-associated degradation (ERAD) complex, is actively engaged in quiescent HSCs to preserve HSC self-renewal. ERADs are multiprotein complexes on the ER membrane that recognize misfolded proteins in ER and dislocate them to cytosolic compartment to undergo ubiquitination for proteasome degradation.25,26 There is a constant demand for ERAD-mediated surveillance to clear aberrant proteins in the ER, which occur when a native structure fails to achieve because of mutation, translational misincorporation, or stochastic inefficiency in adopting native conformation or forming protein complexes. Sel1L is an important adaptor of the Hrd1 ERAD complex that recognizes misfolded proteins in ER lumen and recruits them to ERAD complexes for dislocation to cytosol for proteasome degradation. Sel1L has also been shown to bind to and stabilize Hrd1, an E3 ligase of the ERAD complex; therefore, it is indispensable for Hrd1 ERAD function.27
In this report, we show that Sel1L, and other members of the ERAD complex, are enriched in the quiescent and metabolically inactive HSCs. ERAD deficiency, via deletion of Sel1L, in hematopoietic tissues leads to HSC hyperproliferation and activation, accompanied by a complete loss of HSC reconstitution potential and the depletion of the HSC pool. Sel1L knockout (KO) HSCs exhibit enhanced proliferation, metabolic activation, and increased mammalian target of rapamycin (mTOR) activity. Mechanistically, Sel1L/Hrd1 binds to the mTOR activator Ras homolog enriched in brain (Rheb) and promotes Rheb ubiquitination, suggesting that Rheb is a protein substrate of Sel1/Hrd1 ERAD. Sel1L KO in HSCs leads to accumulation of Rheb proteins to activate mTOR. Importantly, inhibition of mTOR or Rheb rescues the HSC dysfunction induced by Sel1L KO. Our studies identify Sel1L/Hrd1 ERAD as a critical protein quality control pathway that maintains HSC quiescence and self-renewal, and determines HSC fate by modulating mTOR activity.
Methods
Mice
All the mice used in this study are listed in supplemental Table 1 on the Blood Web site. All were maintained in a C57BL/Ka-CD45.2: Thy-1.1 background. Recipients in reconstitution assays were adult C57BL/Ka-CD45.1: Thy-1.2 mice, at least 8 weeks of age at the time of irradiation. Poly-inosine-poly-cytosine (pIpC) was reconstituted in phosphate-buffered saline and administered at 0.5 μg/g body mass/d by intraperitoneal (IP) injection. All mice were then analyzed at age 8 to 14 weeks, a minimum of 2 weeks after pIpC treatment and paired with sex- and age-matched controls. Doxycycline was added to the water at a concentration of 0.2% (m/v) along with 1% sucrose. No difference of phenotype was observed between male and female mice. An equal number of male and female mice were used for analyses when possible and were pooled together for analysis.
Flow cytometry staining and isolation of hematopoietic cells
Bone marrow cells were flushed from the long bones (tibias and femurs) with FACS Buffer (Hanks buffer without calcium or magnesium, with 2% heat-inactivated calf serum). Hematopoietic populations were analyzed or purified using the antibody cocktails (supplemental Tables 1 and 3) as previously described.28,29 Nonviable cells were excluded using the dye 4′,6-diamidino-2-phenylindole (1 μg/mL). Cells were analyzed with BD Fortessa or sorted by BD Aria III flow cytometry. Additional information of methods and materials can be found in supplemental Methods and supplemental Tables 1-3.
Quantification and statistics analysis
All quantitative data represents mean ± standard deviation (SD), unless stated otherwise. Two-tailed Student t tests were used to assess statistical significance for 2 group comparisons and analysis of variance test was performed for more than 2 groups.
Results
The Sel1L-Hrd1 ERAD genes are enriched in dormant and metabolically inactive HSCs
To determine the role of protein quality control in HSC quiescence, we examined the overall protein aggregates in quiescent/dormant (dHSC) vs proliferative/activated (aHSC) HSCs in the Col1α1-H2B-GFP; Rosa26-M2-rtTA double transgenic mice (supplemental Figure 1A; Figure 1A-B).18 In this model, SLAM28 HSCs (CD150+CD48−Lineage−cKit+Sca1+) were first labeled with Histone 2B-green fluorescent protein (H2B-GFP) during a 6-week period of doxycycline administration. After removal of doxycycline, HSCs dilute GFP with each round of division, which allows tracking of proliferation over time. Then aHSCs (GFP low; GFPlow) and dHSCs (GFP high; GFPhigh) can be separated by GFP expression after 12- to 18-week “off labeling” chase period (supplemental Figure 1A; Figure 1A). First, we observed higher levels of protein aggregates, as measured by PROTEOSTAT (Enzo Life Sciences), in aHSCs than dHSCs (Figure 1A-B). Next, we examined the levels of protein quality control pathway genes in the published gene expression database comparing dHSCs and aHSCs.30 Although genes of the proteasome pathways are highly active in aHSCs as reported,30 the levels of many ERAD genes, such as Herpud1, Hrd1, and Sel1L, showed a trend of enrichment in dHSCs (supplemental Figure 1B). Consistent with this, analysis of our previously published data31 (GSE45194) revealed a higher level of Sel1L in dHSCs (Figure 1C), a result confirmed by quantitative reverse transcriptase quantitative polymerase chain reaction (RT-qPCR; Figure 1D). Higher levels of mitochondrial membrane potential (measured by tetramethyl rhodamine methyl ester [TMRM]) were associated with HSC proliferation and activation (supplemental Figure 1C-D).32 Next, we compared the expression of ERAD genes in metabolically inactive (TMRMlow) vs active (TMRMhigh) HSCs (Figure 1E-F). Sel1L level was significantly reduced in metabolically active HSCs (Figure 1F) and was further decreased in progenitors (supplemental Figure 1E). Furthermore, ex vivo culture leads to HSC proliferation and activation, which is associated with reduced levels of Sel1L (Figure 1G). Taken together, Sel1L is enriched in quiescent and metabolically inactive HSCs, and its expression decreases upon HSC proliferation and activation.

Sel1L/Hrd1 ERAD genes are enriched in quiescent and dormant HSCs.Col1α1-H2B-GFP+/−; Rosa26-M2-rtTA+/− mice were labeled with doxycycline for 6 weeks and then “off label chase” for 18 weeks. H2B-GFP label retention allows purification of quiescent (GFPhigh) and proliferative (GFPlow) HSCs. Levels of protein aggregates in different subpopulations were detected by PROTESTAT staining. (A) Representative FACS plots of the gating strategy. (B) Summary of protein aggregate levels, as measured by PROTESTAT, in quiescent (GFPhigh) and proliferative (GFPlow) HSCs relative to all HSCs. (C) Sel1L level from microarray analysis31 comparing quiescent (GFPhigh) and proliferative (GFPlow) HSCs. Data represent reads per kilobase of transcript per million mapped reads (RPKM); each point represents a single probe. P value determined by 2-sided Wilcoxon rank-sum test. (D) qRT-PCR of ERAD genes in quiescent (GFPhigh) vs proliferating (GFPlow) HSCs purified from Col1α1-H2B-GFP+/+; Rosa26-M2-rtTA+/+ mice. Each point represents fold change of FACS-sorted quiescent HSCs (GFPhigh) vs proliferative HSCs (GFPlow) from a single mouse. Metabolically active (TMRMhigh) vs inactive (TMRMlow) HSCs in 8- to 10-week-old wild-type mice were purified based on tetramethyl rhodamine methyl ester (TMRM) staining. (E) Representative FACS plots and gating strategy for sorting. (F) Summary of levels of ERAD genes by qRT-PCR. Each point represents fold change of FACS-sorted metabolically active HSCs (TMRMhigh) vs inactive (TMRMlow) HSCs from a single mouse. (G) mRNA levels of Sel1L in SLAM HSCs freshly isolated or after 24 hours’ culture in SF-03 media. Data represent mean ± SD unless stated otherwise. Two-sided Student t test was used for statistical analysis unless specified otherwise.
Sel1L/Hrd1 ERAD genes are enriched in quiescent and dormant HSCs.Col1α1-H2B-GFP+/−; Rosa26-M2-rtTA+/− mice were labeled with doxycycline for 6 weeks and then “off label chase” for 18 weeks. H2B-GFP label retention allows purification of quiescent (GFPhigh) and proliferative (GFPlow) HSCs. Levels of protein aggregates in different subpopulations were detected by PROTESTAT staining. (A) Representative FACS plots of the gating strategy. (B) Summary of protein aggregate levels, as measured by PROTESTAT, in quiescent (GFPhigh) and proliferative (GFPlow) HSCs relative to all HSCs. (C) Sel1L level from microarray analysis31 comparing quiescent (GFPhigh) and proliferative (GFPlow) HSCs. Data represent reads per kilobase of transcript per million mapped reads (RPKM); each point represents a single probe. P value determined by 2-sided Wilcoxon rank-sum test. (D) qRT-PCR of ERAD genes in quiescent (GFPhigh) vs proliferating (GFPlow) HSCs purified from Col1α1-H2B-GFP+/+; Rosa26-M2-rtTA+/+ mice. Each point represents fold change of FACS-sorted quiescent HSCs (GFPhigh) vs proliferative HSCs (GFPlow) from a single mouse. Metabolically active (TMRMhigh) vs inactive (TMRMlow) HSCs in 8- to 10-week-old wild-type mice were purified based on tetramethyl rhodamine methyl ester (TMRM) staining. (E) Representative FACS plots and gating strategy for sorting. (F) Summary of levels of ERAD genes by qRT-PCR. Each point represents fold change of FACS-sorted metabolically active HSCs (TMRMhigh) vs inactive (TMRMlow) HSCs from a single mouse. (G) mRNA levels of Sel1L in SLAM HSCs freshly isolated or after 24 hours’ culture in SF-03 media. Data represent mean ± SD unless stated otherwise. Two-sided Student t test was used for statistical analysis unless specified otherwise.
Sel1L-Hrd1 ERAD deficiency depletes HSC pool
To determine the role of Sel1L/Hrd1 ERAD in hematopoiesis, we crossed Mx1-Cre+ mice with conditional Sel1L KO mice,33 and injected 6- to 8-week-old Mx1-cre+; Sel1Lfl/+ (het), or Mx1-cre+; Sel1Lfl/fl (homo) mice with pIpC (0.5 μg/g body weight, every other day for 6 doses) to delete Sel1L in hematopoietic tissues. Of note, neither pIpC at the dose we used nor the expression of Cre led to depletion of HSC (supplemental Figure 2A-B). These mice were then compared with sex- and age-matched Mx1-cre−; Sel1Lfl/+ or Mx1-cre−; Sel1Lfl/fl mice (control). Two weeks after pIpC, Sel1L KO was confirmed by western blot (supplemental Figure 2C). Homozygous Sel1L KO mice exhibited similar body weight, bone marrow, and spleen cellularity, but slightly increased spleen weight and reduction of thymus weight and cellularity compared with control mice (Figure 2A-F; supplemental Figure 2D-F). The thymic defect is consistent with a previous study reporting T-cell developmental defects in Hrd1 KO mice.34
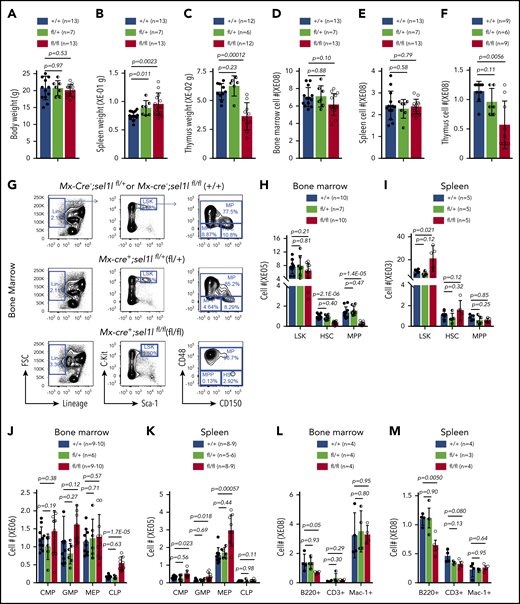
Sel1l-Hrd1 ERAD is required to maintain HSC pool. Six- to 8-week-old Mx1-cre−; Sel1Lfl/fl or Mx1-cre−; Sel1Lfl/+ (+/+), Mx1-cre+; Sel1Lfl/+(fl/+) and Mx1-cre+; Sel1Lfl/fl (fl/fl) mice were injected with pIpC every other day for a total of 6 doses. Two weeks after pIpC injection, (A) body weight, (B) spleen, and (C) thymus weight, (D) cellularity of bone marrow, (E) spleen and (F) thymus, (G-I) numbers of HSPC, (J,K) lineage restricted progenitors, and (L-M) mature blood cells were analyzed. Data represent mean ± SD. Each replicate represents a single mouse from an independent experiment. Two-sided Student t test was used for statistical analysis.
Sel1l-Hrd1 ERAD is required to maintain HSC pool. Six- to 8-week-old Mx1-cre−; Sel1Lfl/fl or Mx1-cre−; Sel1Lfl/+ (+/+), Mx1-cre+; Sel1Lfl/+(fl/+) and Mx1-cre+; Sel1Lfl/fl (fl/fl) mice were injected with pIpC every other day for a total of 6 doses. Two weeks after pIpC injection, (A) body weight, (B) spleen, and (C) thymus weight, (D) cellularity of bone marrow, (E) spleen and (F) thymus, (G-I) numbers of HSPC, (J,K) lineage restricted progenitors, and (L-M) mature blood cells were analyzed. Data represent mean ± SD. Each replicate represents a single mouse from an independent experiment. Two-sided Student t test was used for statistical analysis.
Sel1L homozygous KO mice exhibited significantly reduced numbers and frequencies of SLAM28 HSCs and multipotent progenitors (MPP; CD150−CD48−Lineage−cKit+Sca1+ [LSK]) in the bone marrow but not the spleen (Figure 2G-I; supplemental Figure 2G-H). The numbers and frequencies of broader progenitor population as measured by LSK were not affected in Sel1L KO bone marrow but were increased in the spleen (Figure 2G-J; supplemental Figure 2I-J). We then examined the lineage progenitors in Sel1L KO mice. Although the myeloid progenitor common myeloid progenitor (Lineage−Sca1−cKit+ CD16/32+CD34−), granulocyte-macrophage progenitor (Lineage−Sca1−cKit+ CD16/32+CD34+), and megakaryocyte-erythroid progenitor (Lineage−Sca1−cKit+ CD16/32−CD34−) were not changed in the bone marrow, they were significantly expanded in the spleen of Sel1L KO mice (Figure 2J-K; supplemental Figure 2I-J). The common lymphoid progenitor (Lineage−Sca1+cKit+ IL7Ra+FLT3+) were expanded in the bone marrow and the spleen of Sel1L KO mice (Figure 2J-K; supplemental Figure 2I-J). These findings suggest that Sel1L has distinct function in HSCs and progenitors, and loss of Sel1L leads to depletion of HSC and MPPs but not lineage-restricted progenitors. Analysis of mature myeloid, B, and T cells revealed reduced frequency of B cells in the spleen and bone marrow (Figure 2L-M; supplemental Figure 2K-M), which is consistent with a recent report,35 and no significant change of myeloid and T cells in the bone marrow and spleen. Different from homozygous KO, heterozygosity of Sel1L, on the other hand, had minimal effects on hematopoiesis (Figure 2; supplemental Figure 2).
In an aged (13-15 months post-pIpC injection) cohort, Mx1-cre-mediated Sel1L KO leads to slightly increased peripheral blood white blood cell counts, whereas hemoglobin levels and platelet counts were unchanged (supplemental Figure 2L). The aged Sel1L KO mice exhibited similar bone marrow cellularity as the controls, significantly reduced frequencies of HSCs, MPPs, and LSKs, but no significant change of progenitors (supplemental Figure 2M-O). The less pronounced HSC loss in aged mice is likely the result of recovery of nondeleted HSCs.
Although interferon has been shown to induce HSC proliferation and activation,36 the dose of pIpC used in our studies was previously shown not to cause significant HSC activation.37 In addition, a previous study showed that pIpC, via TLR3, does not activate ER stress signaling.38 Nevertheless, to confirm the results of Mx1-cre-driven Sel1L KO, we generated Vav1-cre+; Sel1Lfl/fl mice and examined hematopoiesis in 6- to 8-week-old mice together with littermate controls (supplemental Figure 3). Vav1-cre+; Sel1Lfl/fl mice exhibited reduced body weight, similar spleen weight and cellularity, lower thymus weight and cellularity, and reduced bone marrow cellularity (supplemental Figure 3A-J). Although Vav1-cre-mediated Sel1L KO led to depletion of HSC and MPP as seen in Mx1-cre+; Sel1Lfl/fl mice, we observed different phenotype of progenitors. Vav1-cre+; Sel1Lfl/fl mice exhibited reduced LSK in the bone marrow, and no significant change of progenitor populations compared with controls (supplemental Figure 3K-S). In addition, Vav1-cre+; Sel1Lfl/fl mice exhibited increased Mac1+ cells in the bone marrow and spleen (supplemental Figure 3T-W).
Sel1L-Hrd1 ERAD deficiency leads to reduced HSC reconstitution
To determine the effects of Sel1L KO on HSC functions, we performed competitive repopulation assay. Two weeks after pIpC injection, we transplanted 3 × 10⁵ whole bone marrow cells from CD45.2+Mx1-cre+; Sel1Lfl/fl or control mice, together with 3 × 10⁵ CD45.1+ wild-type bone marrow cells, into lethally irradiated CD45.1+ wild-type recipients. Donor reconstitution in CD45+, myeloid (Mac1+), B (B220+), or T (CD3+) cells in the peripheral blood was analyzed every 4 weeks for 16 weeks after transplantation. Sel1L deficiency resulted in significant reduction of long-term multilineage donor reconstitution in transplant recipients (Figure 3A). Analysis at the end of 16 weeks showed that donor reconstitution in HSCs, and all other hematopoietic populations, was reduced in Sel1L KO transplant recipients (Figure 3B), confirming the reduced HSC reconstitution. Because of the overall lower HSC frequency in the bone marrow of Sel1L KO mice, to assess the function of individual HSCs, we transplanted 50 FACS-purified HSCs into irradiated recipients along with 0.2 million CD45.1 bone marrow competitor cells. Peripheral blood (Figure 3C) and bone marrow (Figure 3D) analysis revealed that Sel1L KO HSCs failed to yield any long-term reconstitution in transplant recipients.
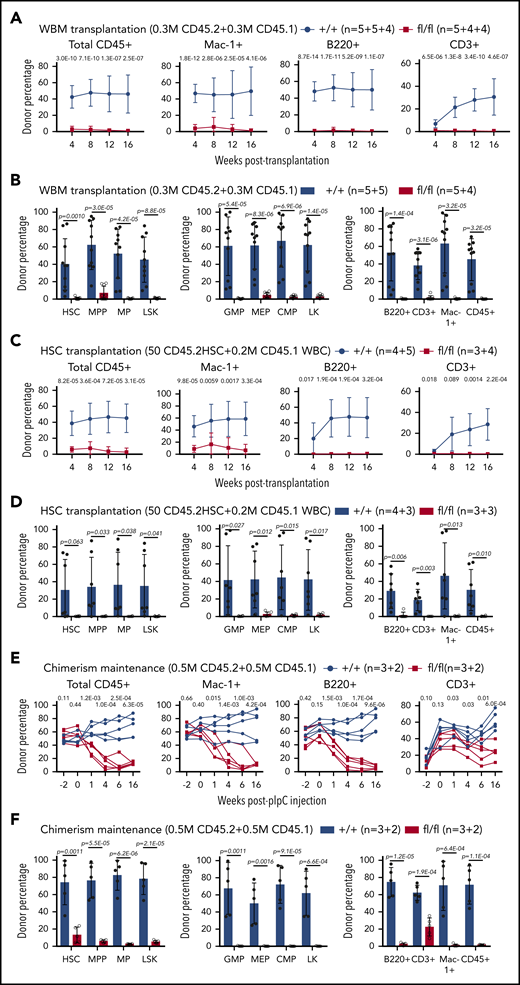
Sel1l-Hrd1 ERAD is required for HSC reconstitution. Whole bone marrow cells (WBM, 0.3 million) from CD45.2 Mx1-cre+; Sel1Lfl/fl (fl/fl) or control (+/+) mice were transplanted into lethally irradiated CD45.1 mice together with 0.3 million wild-type CD45.1 competitor cells. The contribution of CD45.2 cells in total CD45+, myeloid (Mac-1+), B (B220+), and T (CD3+) (A) cells from peripheral blood, and (B) to HSCs and other hematopoietic populations in the bone marrow was analyzed in transplant recipients. Competitive repopulation assay with 50 FACS-purified HSCs from CD45.2 Mx1-cre+; Sel1Lfl/fl (fl/fl) or control (+/+) mice transplanted into irradiated receipt mice along with 0.2 million CD45.1 WBM competitor cells. The contribution of (C) CD45.2 cells in total CD45+, myeloid (Mac-1+), B (B220+), and T (CD3+) cells from peripheral blood, and to HSCs and (D) other hematopoietic populations in the bone marrow was analyzed in transplant recipients. Chimerism maintenance analysis with 5 × 10⁵ CD45.2+ WBM cells from Mx1-cre+; Sel1Lfl/fl (fl/fl) or control (+/+) mice (without pIpC) transplanted together with 5 × 10⁵ CD45.1+ wild-type bone marrow cells into lethally irradiated CD45.1+ wild-type recipients. Transplants were injected with pIpC (3 doses) 6 weeks after transplantation. The contribution of (E) CD45.2 cells in total CD45+, myeloid (Mac-1+), B (B220+), and T (CD3+) cells from peripheral blood, and (F) in HSCs and other hematopoietic populations in the bone marrow was analyzed in transplant recipients. Data represent mean ± SD. Two to 3 independent experiments were done for each condition and n is described as number of replicates from each experiment, separated by the plus (+) sign. Two-sided Student t test was used for statistical analysis unless specified.
Sel1l-Hrd1 ERAD is required for HSC reconstitution. Whole bone marrow cells (WBM, 0.3 million) from CD45.2 Mx1-cre+; Sel1Lfl/fl (fl/fl) or control (+/+) mice were transplanted into lethally irradiated CD45.1 mice together with 0.3 million wild-type CD45.1 competitor cells. The contribution of CD45.2 cells in total CD45+, myeloid (Mac-1+), B (B220+), and T (CD3+) (A) cells from peripheral blood, and (B) to HSCs and other hematopoietic populations in the bone marrow was analyzed in transplant recipients. Competitive repopulation assay with 50 FACS-purified HSCs from CD45.2 Mx1-cre+; Sel1Lfl/fl (fl/fl) or control (+/+) mice transplanted into irradiated receipt mice along with 0.2 million CD45.1 WBM competitor cells. The contribution of (C) CD45.2 cells in total CD45+, myeloid (Mac-1+), B (B220+), and T (CD3+) cells from peripheral blood, and to HSCs and (D) other hematopoietic populations in the bone marrow was analyzed in transplant recipients. Chimerism maintenance analysis with 5 × 10⁵ CD45.2+ WBM cells from Mx1-cre+; Sel1Lfl/fl (fl/fl) or control (+/+) mice (without pIpC) transplanted together with 5 × 10⁵ CD45.1+ wild-type bone marrow cells into lethally irradiated CD45.1+ wild-type recipients. Transplants were injected with pIpC (3 doses) 6 weeks after transplantation. The contribution of (E) CD45.2 cells in total CD45+, myeloid (Mac-1+), B (B220+), and T (CD3+) cells from peripheral blood, and (F) in HSCs and other hematopoietic populations in the bone marrow was analyzed in transplant recipients. Data represent mean ± SD. Two to 3 independent experiments were done for each condition and n is described as number of replicates from each experiment, separated by the plus (+) sign. Two-sided Student t test was used for statistical analysis unless specified.
To avoid confounding transplantation-related effects such as homing and engraftment defects, we performed chimerism maintenance analysis. We transplanted 5 × 10⁵ CD45.2+ whole bone marrow cells from Mx1-cre+; Sel1Lfl/fl or control mice (without pIpC injection), together with 5 × 10⁵ CD45.1+ competitor cells, into lethally irradiated CD45.1+ recipients. Four weeks after transplantation, donor cells from all genotypes gave rise to similar levels of donor contribution (chimerism) to blood cells (Figure 3E). Sel1L deletion via pIpC injection induced a significant and rapid reduction of Sel1L KO donor chimerism in peripheral blood (Figure 3E) and bone marrow (Figure 3F) of transplant recipients suggesting that Sel1L-Hrd1 ERAD is indispensable for HSCs reconstitution.
Sel1L KO drives HSCs to proliferation and activation
Our data show that the expression level of Sel1L is much higher in quiescent HSCs than proliferative HSCs (Figure 1), suggesting a role of Sel1L in regulating HSC cycling. To evaluate the proliferative potential of Sel1L KO HSCs, we performed 5-bromo-2′-deoxyuridine (BrdU) incorporation assay. Following 24-hour labeling with BrdU, HSCs from the Mx1-Cre+; Sel1Lfl/fl mice exhibited significantly higher frequency of BrdU+ HSCs (Figure 4A). Similarly, HSCs from Vav1-Cre+; Sel1Lfl/fl mice showed increased BrdU incorporation (Figure 4B). Next, we performed H2B-GFP label retention assay by mating Mx1-Cre+; Sel1Lfl/fl mice with Col1A1-H2B-GFP; Rosa26-M2-rtTA mice.18 Two weeks after pIpC, we started the mice on doxycycline water for 6 weeks. Doxycycline was then removed to start the “chase” period. After a 12- or 18-week chase, Sel1L KO HSCs retained lower GFP levels compared with controls, indicating a higher overall proliferative state (Figure 4C; supplemental Figure 4A). In addition, messenger RNA (mRNA) levels of cell cycle inhibitors, p27 and p57 but not p21, were reduced in Sel1L KO HSCs (supplemental Figure 4B). Taken together, loss of Sel1L/Hrd1 ERAD drives HSCs into hyperproliferation. Given that Sel1L KO mice did not exhibit signs of overall reduction of progenitor or mature cells (Figure 2; supplemental Figure 2), HSC hyperproliferation induced by Sel1L knockout is unlikely a secondary response to depletion of hematopoietic cells.
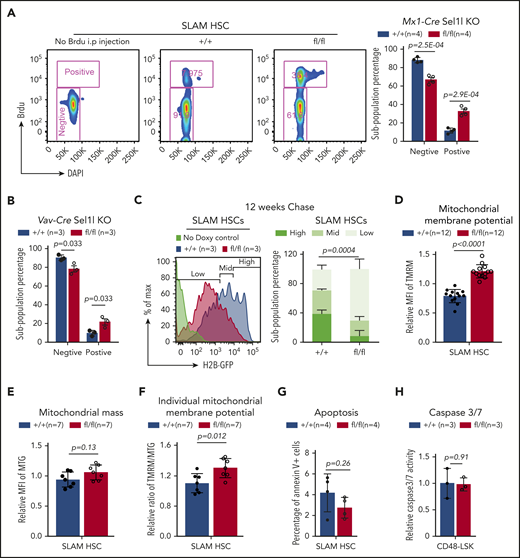
Loss of Sel1L leads to HSC hyperproliferation and activation. (A) Two weeks after pIpC injection, Mx1-cre+; Sel1Lfl/fl (fl/fl) or control (+/+) mice were injected with BrdU (200 mg/kg body mass; IP) and then placed on drinking water containing BrdU (1 mg/mL) for 24 hours. Representative FACS plots of gating strategy (left) and summary of BrdU incorporation in HSCs (right) are shown. (B) Six- to 8-week-old Vav1-cre+; Sel1lfl/fl(fl/fl) and Vav1-cre−; Sel1lfl/+ or Vav1-cre−; Sel1lfl/fl (+/+) mice were injected with BrdU (200 mg/kg body mass; IP) and then placed on drinking water containing BrdU (1 mg/mL) for 24 hours. Summary of BrdU incorporation in HSCs are shown. (C) Representative FACS plots with gating strategy (left), and summary of H2B-GFP retention (right) in HSCs after 12 weeks of off-doxycycline chase. Two weeks after pIpC injection, Mx1-cre+; Sel1Lfl/fl; Col1A1-H2B–GFP+/+; Rosa26-M2-rtTA+/+ (fl/fl) or control (+/+) mice were placed on doxycycline water (2 g/L). After 6 weeks’ labeling, doxycycline water was removed and GFP level in HSCs was analyzed after 12 weeks “off-label” chase. Two weeks after pIpC injection, Mx1-cre+; Sel1Lfl/fl (fl/fl) or control (+/+) mice were analyzed for mitochondrial membrane potential (D, by TMRM), mitochondrial mass (E, by Mito tacker green), and (F) ratio of mitochondrial membrane potential to mass. (D-F) Mean fluorescence intensity (MFI) were normalized to mean value on the day of measurement, and P values were determined by 2-sided Wilcoxon rank sum test. (G-H) Apoptosis was measured by Annexin-V staining (G, in SLAM HSCs) or Caspase 3/7 activity (H, in CD48−LSK) on Mx1-cre+; Sel1Lfl/fl (fl/fl) or control (+/+) mice 2 weeks after pIpC. Data represent mean ± SD. Two-sided Student t test was used for statistical analysis unless specified.
Loss of Sel1L leads to HSC hyperproliferation and activation. (A) Two weeks after pIpC injection, Mx1-cre+; Sel1Lfl/fl (fl/fl) or control (+/+) mice were injected with BrdU (200 mg/kg body mass; IP) and then placed on drinking water containing BrdU (1 mg/mL) for 24 hours. Representative FACS plots of gating strategy (left) and summary of BrdU incorporation in HSCs (right) are shown. (B) Six- to 8-week-old Vav1-cre+; Sel1lfl/fl(fl/fl) and Vav1-cre−; Sel1lfl/+ or Vav1-cre−; Sel1lfl/fl (+/+) mice were injected with BrdU (200 mg/kg body mass; IP) and then placed on drinking water containing BrdU (1 mg/mL) for 24 hours. Summary of BrdU incorporation in HSCs are shown. (C) Representative FACS plots with gating strategy (left), and summary of H2B-GFP retention (right) in HSCs after 12 weeks of off-doxycycline chase. Two weeks after pIpC injection, Mx1-cre+; Sel1Lfl/fl; Col1A1-H2B–GFP+/+; Rosa26-M2-rtTA+/+ (fl/fl) or control (+/+) mice were placed on doxycycline water (2 g/L). After 6 weeks’ labeling, doxycycline water was removed and GFP level in HSCs was analyzed after 12 weeks “off-label” chase. Two weeks after pIpC injection, Mx1-cre+; Sel1Lfl/fl (fl/fl) or control (+/+) mice were analyzed for mitochondrial membrane potential (D, by TMRM), mitochondrial mass (E, by Mito tacker green), and (F) ratio of mitochondrial membrane potential to mass. (D-F) Mean fluorescence intensity (MFI) were normalized to mean value on the day of measurement, and P values were determined by 2-sided Wilcoxon rank sum test. (G-H) Apoptosis was measured by Annexin-V staining (G, in SLAM HSCs) or Caspase 3/7 activity (H, in CD48−LSK) on Mx1-cre+; Sel1Lfl/fl (fl/fl) or control (+/+) mice 2 weeks after pIpC. Data represent mean ± SD. Two-sided Student t test was used for statistical analysis unless specified.
Quiescent HSCs are more resistant than proliferative HSCs to repetitive proliferative stress, such as 5-fluorouracil (5-FU) injection. To determine the effect of Sel1L knockout on the response of HSCs to proliferative stress, we injected Mx1-Cre+; Sel1Lfl/fl and control mice with 5-FU at a dose of 150 mg/kg weekly (supplemental Figure 4C). Sel1L KO mice demonstrated significantly shortened survival after 5-FU injection, consistent with a hyperproliferative state and lower resistance to proliferative stress in Sel1L KO HSCs.
Consistent with a higher proliferative and metabolically active status, both Mx1-Cre+; Sel1Lfl/fl and Vav-Cre+; Sel1Lfl/fl HSCs are significantly larger than control HSCs (supplemental Figure 4D-E). In addition, Mx1-Cre+; Sel1Lfl/fl HSCs exhibited increased mitochondrial membrane potential (Figure 4D-F). HSCs from Mx1-Cre+; Sel1Lfl/fl and control mice, however, showed similar levels of apoptosis as measured by Annexin V staining or Caspase activation (Figure 4G-H), suggesting the reduced HSC number in Sel1L KO is not due to increased apoptosis. Together with the reduced number and reconstitution potential of HSC, these results indicate that ERAD deficiency, via Sel1L deletion, drives HSCs into proliferation and activation, which leads to HSC depletion.
Sel1L KO lead to mTOR activation in HSPCs
To determine the mechanism underlying the effects of Sel1L KO on HSCs, we examined signaling pathways that regulate cellular proliferation. AKT-mTOR signaling plays an important role in cellular functions including protein synthesis, lipid metabolism, mitochondrial functions, cell proliferation, survival, and growth.39,40 More importantly, hyperactivation of phosphatidylinositol 3-kinase-Akt-mTOR has been shown to drive HSCs to hyperproliferate, deplete, and commit to differentiation.41-44 To determine if mTOR is activated in Sel1L KO HSCs, western blotting was performed on purified hematopoietic stem and progenitor cells (HSPC; LSK). This revealed increased levels of phospho-S6 (S235/236) and phospho-4EBP1 (T37/46) in Sel1L KO HSPCs (Figure 5A), indicating that Sel1L KO leads to mTOR activation.
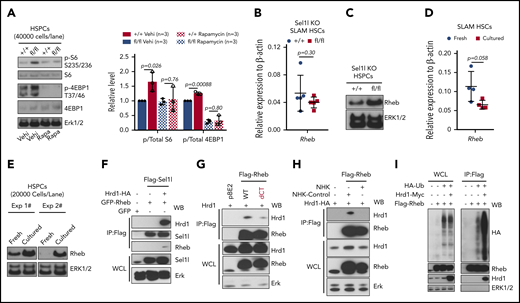
mTOR signaling is activated in Sel1L KO HSCs and Rheb is a novel substrate of Sel1L/Hrd1 ERAD. (A) Representative (left) western blot and (right) summary of quantitation from 3 independent experiments using Mx1-cre+; Sel1Lfl/fl (fl/fl) or control (+/+) mice treated with vehicle or rapamycin. The mice were injected with total 6 doses of pIpC (every 2 days) and injected with rapamycin (4 mg/kg) or vehicle daily (started 6 days before pIpC and continued until the time of analysis). Two weeks after the last dose of pIpC, LSK cells were sorted from the mice for western blot. The levels of mRNA (B, by RT-qPCR; n = 5) and protein level (C, by western blot) of Rheb in HSPCs isolated from Mx1-cre+; Sel1Lfl/fl (fl/fl) or control (+/+) mice were analyzed 2 weeks after pIpC injection. (D-E) The mRNA and protein levels of Rheb in HSCs freshly isolated or cultured in SF-03 media for 24 hours. (F-H) HEK 293T cells were transfected with constructs that overexpress tagged Sel1L, Hrd1, Rheb, or NHK proteins (indicated on top of each blot), and the protein interaction was analyzed by coimmunoprecipitation followed by western blot with antibodies labeled on the right of each blot. (I) HEK 293T cells were transfected with constructs that overexpress HA-tagged ubiquitin, FLAG-tagged Rheb, and Myc-tagged Hrd1, and Rheb proteins were immunoprecipitated by Flag antibody and ubiquitinated Rheb proteins were detected by western blot with HA antibody. At least 3 independent experiments of coimmunoprecipitation or western blots were performed with similar results for each assay. For bar graphs, data represent mean ± SD. The number of replicates (n) indicates independent experiments. Two-sided Student t test was used for statistical analysis.
mTOR signaling is activated in Sel1L KO HSCs and Rheb is a novel substrate of Sel1L/Hrd1 ERAD. (A) Representative (left) western blot and (right) summary of quantitation from 3 independent experiments using Mx1-cre+; Sel1Lfl/fl (fl/fl) or control (+/+) mice treated with vehicle or rapamycin. The mice were injected with total 6 doses of pIpC (every 2 days) and injected with rapamycin (4 mg/kg) or vehicle daily (started 6 days before pIpC and continued until the time of analysis). Two weeks after the last dose of pIpC, LSK cells were sorted from the mice for western blot. The levels of mRNA (B, by RT-qPCR; n = 5) and protein level (C, by western blot) of Rheb in HSPCs isolated from Mx1-cre+; Sel1Lfl/fl (fl/fl) or control (+/+) mice were analyzed 2 weeks after pIpC injection. (D-E) The mRNA and protein levels of Rheb in HSCs freshly isolated or cultured in SF-03 media for 24 hours. (F-H) HEK 293T cells were transfected with constructs that overexpress tagged Sel1L, Hrd1, Rheb, or NHK proteins (indicated on top of each blot), and the protein interaction was analyzed by coimmunoprecipitation followed by western blot with antibodies labeled on the right of each blot. (I) HEK 293T cells were transfected with constructs that overexpress HA-tagged ubiquitin, FLAG-tagged Rheb, and Myc-tagged Hrd1, and Rheb proteins were immunoprecipitated by Flag antibody and ubiquitinated Rheb proteins were detected by western blot with HA antibody. At least 3 independent experiments of coimmunoprecipitation or western blots were performed with similar results for each assay. For bar graphs, data represent mean ± SD. The number of replicates (n) indicates independent experiments. Two-sided Student t test was used for statistical analysis.
Rheb is a novel protein substrate of Sel1L/Hrd1 ERAD
To determine the mechanism by which Sel1L KO activates mTOR, we examined the signaling proteins that regulate mTOR activity. Rheb is a member of the small GTPase superfamily. In response to diverse inputs such as growth factor, nutrient, and energy status, Rheb binds to and activates mTORC1 complex. A previous report showed that Rheb was accumulated in activated HSCs.45 Furthermore, Rheb was recently reported to be anchored to the ER membrane via lipid modification of its C-terminal CaaX motif.46 Although Sel1L KO HSCs showed similar mRNA level of Rheb as controls (Figure 5B), the protein level of Rheb was significantly increased in Sel1L KO HSPCs (Figure 5C), suggesting that Rheb may be a substrate of ERAD and link ER protein homeostasis to mTOR activation. To confirm that Rheb protein level is increased when HSCs are activated, we cultured purified HSC ex vivo and examined the levels of Rheb. After culturing for 24 hours, levels of Rheb protein but not mRNA were significantly increased (Figure 5D-E). Taken together, these data suggest that Sel1L/Hrd1 ERAD posttranscriptionally regulates Rheb.
To determine if Rheb is a protein substrate of Sel1L/Hrd1 ERAD, we examined if Rheb binds to ERAD complex. HEK 293T cells were transfected with Flag-tagged Sel1L (Flag-Sel1L), HA-tagged Hrd1 (Hrd1-HA), and GFP-tagged Rheb (GFP-Rheb), and Sel1L interacting proteins were immunoprecipitated by Flag antibody. Flag antibody pulled down Rheb, but only in the presence of Hrd1 (Figure 5F), suggesting that Rheb binds to ERAD complex through interaction with Hrd1. Deletion of the C-terminal CaaX mofit significantly abolished the binding of Rheb to Sel1L/Hrd1 (Figure 5G), suggesting that membrane anchorage is important for the interaction between Rheb and ERAD. Hrd1 binds to ERAD substrates and transfer ubiquitin to the substrates for proteasome degradation. High concentration of misfolded polypeptides can outcompete the binding of Hrd1 with its substrates.47 Overexpression of NHK, a well-established misfolded protein that specifically relies on ERAD to be degraded,47 abolished Rheb-Hrd1 interaction (Figure 5H), suggesting that the binding of Rheb to Hrd1 and its degradation is outcompeted by NHK. Importantly, Hrd1 promoted Rheb ubiquitination (Figure 5I), suggesting that Rheb is a novel substrate of Sel1L/Hrd1 ERAD.
mTOR inhibition rescued HSC defects induced by Sel1L KO
To determine if Rheb-mediated mTOR activation contributes to the HSC defects in Sel1L KO, we treated Sel1L KO mice with mTOR1 inhibitor rapamycin. Rapamycin (4 mg/kg, IP, started 6 days before pIpC) injection blunted mTOR activation (Figure 5A) and partially rescued HSC depletion in Mx1-cre+; Sel1Lfl/fl mice (supplemental Figure 5A). Next, we performed chimerism maintenance assay (as in Figure 3E-F) and treated the transplant recipients with rapamycin (supplemental Figure 5B). Before pIpC injection, Sel1L KO and wild-type HSCs had similar levels of donor reconstitution (Figure 6A). Sel1L KO induced by pIpC led to significant reduction of donor chimerism, but injection of rapamycin (4 mg/kg, IP daily injection), started 6 days before pIpC and continued throughout the experiment, rescued the reduction of donor chimerism in Sel1L KO transplants (Figure 6A-B). Thus, mTOR signaling is activated in Sel1L KO HSCs and mediates the Sel1L KO-induced HSC dysfunction. Of note, pretreatment with rapamycin did not affect the efficiency of Sel1L deletion induced by pIpC (supplemental Figure 5C-E).
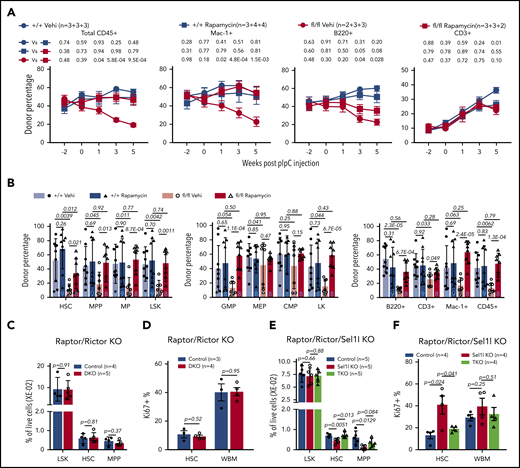
Inhibition of mTOR rescues HSC defects of Sel1L KO. (A-B) Chimerism maintenance analysis reveals rapamycin treatment rescued the loss of reconstitution potential of Sel1L KO HSCs. 5 × 10⁵ CD45.2+ whole bone marrow cells from Mx1-cre+; Sel1Lfl/fl (fl/fl) or control mice (+/+) (without pIpC) were transplanted together with 5 × 10⁵ CD45.1+ wild-type bone marrow cells into lethally irradiated CD45.1+ wild-type recipients. Transplants were injected with pIpC 6 weeks after transplantation and injected with rapamycin (4 μg/kg body weight) or vehicle daily starting 6 days before pIpC and continued throughout the experiment. The contribution of CD45.2 cells (A) in total CD45+, myeloid (Mac-1+), B (B220+), and T (CD3+) cells of peripheral blood, and (B) in HSCs and other hematopoietic populations in the bone marrow were analyzed in transplant recipients. Three independent experiments were pooled and n is described as numbers of replicates from each experiment, separated by the plus (+) sign. (C-D) Six- to 8-week-old Mx1-cre−; Rictorfl/fl or Mx1-cre−; Raptorfl/+; Rictorfl/fl (control) and Mx1-cre+; Raptorfl/+; Rictorfl/fl (DKO) mice were injected with pIpC every other day for a total of 6 doses. Two weeks after pIpC injection, frequency and proliferation (by Ki67) of HSPC were analyzed by FACS. (E-F) Six- to 8-week-old Mx1-cre−; Sel1Lfl/fl; Rictorfl/fl or Mx1-cre−; Sel1Lfl/fl; Raptorfl/+; Rictorfl/fl or Mx1-cre−; Sel1Lfl/fl (control), Mx1-cre+; Sel1Lfl/fl (Sel1L KO) and Mx1-cre+; Sel1Lfl/fl; Raptorfl/+; Rictorfl/fl (triple knockout) mice were injected with pIpC every other day for a total of 6 doses. Two weeks after pIpC injection, frequency and proliferation (by Ki67) of HSPC were analyzed by FACS. Data represent mean ± SD except for panel A, where mean ± standard error of the mean were used. Two-sided Student t test was used for statistical analysis.
Inhibition of mTOR rescues HSC defects of Sel1L KO. (A-B) Chimerism maintenance analysis reveals rapamycin treatment rescued the loss of reconstitution potential of Sel1L KO HSCs. 5 × 10⁵ CD45.2+ whole bone marrow cells from Mx1-cre+; Sel1Lfl/fl (fl/fl) or control mice (+/+) (without pIpC) were transplanted together with 5 × 10⁵ CD45.1+ wild-type bone marrow cells into lethally irradiated CD45.1+ wild-type recipients. Transplants were injected with pIpC 6 weeks after transplantation and injected with rapamycin (4 μg/kg body weight) or vehicle daily starting 6 days before pIpC and continued throughout the experiment. The contribution of CD45.2 cells (A) in total CD45+, myeloid (Mac-1+), B (B220+), and T (CD3+) cells of peripheral blood, and (B) in HSCs and other hematopoietic populations in the bone marrow were analyzed in transplant recipients. Three independent experiments were pooled and n is described as numbers of replicates from each experiment, separated by the plus (+) sign. (C-D) Six- to 8-week-old Mx1-cre−; Rictorfl/fl or Mx1-cre−; Raptorfl/+; Rictorfl/fl (control) and Mx1-cre+; Raptorfl/+; Rictorfl/fl (DKO) mice were injected with pIpC every other day for a total of 6 doses. Two weeks after pIpC injection, frequency and proliferation (by Ki67) of HSPC were analyzed by FACS. (E-F) Six- to 8-week-old Mx1-cre−; Sel1Lfl/fl; Rictorfl/fl or Mx1-cre−; Sel1Lfl/fl; Raptorfl/+; Rictorfl/fl or Mx1-cre−; Sel1Lfl/fl (control), Mx1-cre+; Sel1Lfl/fl (Sel1L KO) and Mx1-cre+; Sel1Lfl/fl; Raptorfl/+; Rictorfl/fl (triple knockout) mice were injected with pIpC every other day for a total of 6 doses. Two weeks after pIpC injection, frequency and proliferation (by Ki67) of HSPC were analyzed by FACS. Data represent mean ± SD except for panel A, where mean ± standard error of the mean were used. Two-sided Student t test was used for statistical analysis.
Next, we confirmed the results of rapamycin with genetic inhibition of mTOR with the conditional knockout of Raptor48 (inhibits mTORC1), or Rictor (inhibits mTORC2),49 or both. Heterozygous knockout of Raptor, or Rictor, or both Raptor and Rictor, had minimal effects on Sel1L KO-induced mTOR activation or HSC impairment (data not shown), and homozygous knockout of Raptor alone was previously reported to cause severe HSC defect.50 We therefore generated Mx1-cre+; Raptorfl/+; Rictorfl/fl; Sel1Lfl/fl mice (triple knockout). This revealed that Raptor heterozygosity and Rictor knockout had minimal effects on HSC proliferation and frequency in the wild-type background (Figure 6C-D), but blocked HSC hyperproliferation and depletion induced by Sel1L KO (Figure 6E-F). To determine if mTOR activation-induced HSC hyperproliferation in Sel1L KO HSCs depends on Rheb, we treated Mx1-cre+; Sel1Lfl/fl mice with Rheb inhibitor NR151 for 1 week. This significantly mitigated hyperproliferation of Sel1L KO HSCs (supplemental Figure 5F), indicating that Rheb-mediated mTOR activation is essential for Sel1L KO-induced HSC dysfunction.
Discussion
The protein quality control pathways in ER have been studied in many mammalian cell types, where there is a persistent demand for protein quality control because of high levels of protein synthesis and secretion.14 In highly specialized cell types, such as stem cells that are mostly quiescent and metabolically inactive, the function of protein quality control system remains elusive. Our recent studies, together with others, indicate that protein quality control is critical to preserve HSC functions under stress conditions.15,16 Here, our studies provide further evidence that protein quality control via Sel1L/Hrd1 ERAD is required for HSC under steady state when the majority of HSCs are in a deeply dormant state. We show that Sel1L/Hrd1 ERAD is more active when HSCs are in quiescence and the expression of Sel1L/Hrd1 genes decreases when HSCs exit quiescence and enter proliferation. ERAD deficiency via Sel1L KO drives HSCs to hyperproliferation and depletion. Sel1L/Hrd1 ERAD thus acts as a master checkpoint guarding HSC quiescence to preserve HSC self-renewal and the decline of ERAD activity drives the transition of HSCs from quiescence to proliferation and activation.
Studies comparing the quiescent and activated HSCs revealed that activated HSCs display much higher levels of expression of proteasome degradation pathway genes.30 We show here that the quiescent subpopulation of HSCs is more dependent on ERAD to maintain their functions. Interestingly, a recent study reports that whereas activated neural stem cells (NSCs) have active proteasomes, quiescent NSCs contain large lysosomes to clear protein aggregates from ER to preserve NSC quiescence and functions.52 HSCs have also been shown to use the large lysosome to restrict mTOR activity to maintain their low metabolic status and preserve quiescence and stemness.45 Furthermore, muscle stem cells exhibit increased level of eIF2α phosphorylation, which preserves the self-renewal of muscle stem cells in vivo.24 Taken together, tight protein quality control is required for quiescent tissue stem cells to maintain their self-renewal and stemness, and different types of tissue stem cells seem to deploy different mechanisms to achieve protein homeostasis.
Although Vav1-cre- and Mx1-cre-mediated Sel1L KO lead to similar defects in HSCs, they induce somewhat different phenotypes in hematopoietic progenitors. This is likely because of differences in the developmental stage, and potentially expression of Cre in nonhematopoietic cells induced by Mx1-cre or Vav1-cre mice.53 One of the differences is that Vav1-cre deletes in embryonic stage, whereas Mx1-cre-mediated deletion can be induced by pIpC in adults. In this case, young adult Mx1-cre+; Sel1Lfl/fl mice were used. Deletion of Sel1L at an embryonic stage can have more dramatic effects on HSCs given the higher proliferative potential of HSCs at this stage and the need for HSCs to migrate to the bone marrow and expand during early development. This could at least partially explain the different, and often more severe phenotype we observed in Vav1-cre+; Sel1Lfl/fl mice. Furthermore, Vav1-cre has been reported to be active in vascular endothelial cells and Mx1-cre can lead to gene deletion in the liver.53 In addition, Sel1L KO seems to have differential effects on different myeloid and lymphoid progenitors, which are different from the effects on HSCs. Further studies are required to determine the role of ERAD in progenitor populations.
Studies of Sel1L/Hrd1 ERAD in many differentiated cell types, including liver, adipocytes, and B cells,33,35,54-58 demonstrate that loss of Sel1L causes dysregulated ERAD targets. Our study shows that Hrd1 binds to and promotes ubiquitination of Rheb, and ERAD deficiency via Sel1L knockout leads to accumulation of Rheb proteins to activate mTOR in HSCs. More importantly, inhibition of either mTOR or Rheb rescues HSC defects induced by Sel1L KO. Thus, protein quality control via Sel1L/Hrd1 ERAD preserves HSC quiescence and self-renewal by Rheb-mediated restriction of mTOR activity. Our results are consistent with other studies that show mTOR activation, via constitutively activation of AKT or knockout of PTEN or TSC1, drives HSCs into proliferation cycle that leads to HSC differentiation and exhaustion.41-43 We therefore identify mTOR activator Rheb as a protein substrate of Sel1L/Hrd1 and discover a previously unknown direct link between mTOR signaling and ERAD.
All other data supporting the findings of this study are available from the corresponding author upon reasonable request.
The online version of this article contains a data supplement.
The publication costs of this article were defrayed in part by page charge payment. Therefore, and solely to indicate this fact, this article is hereby marked “advertisement” in accordance with 18 USC section 1734.
Acknowledgments
The authors thank Markus A. Rüegg and Michael N. Hall for generously providing the Rictor and Raptor conditional knockout mice.
This work was supported by the University of Michigan Protein Folding Disease Initiative, grants from the National Institutes of Health National Heart, Lung, and Blood Institute (1R01HL132392 and 1R01HL150707) (Q.L.), American Cancer Society (125080-RSG-13-253-01-LIB), American Society of Hematology, the V Foundation for Cancer Research, Gabrielle’s Angel Foundation, and Leukemia Research Foundation.
Authorship
Contribution: L.L. performed most of the experiments; A.I., K.F., X.J., M.Z., G.N., and M.J. performed some of the experiments with help from L.L. and Q.L.; G.S., S.S., and L.Q. contributed to the Sel1L knockout mouse design and analysis; F.M., and Y.D. contributed to analysis of RNAseq database; K.I. contributed to the experiments with mTOR activity and rapamycin treatment; and L.L and Q.L. conceived the project, designed experiments, interpreted results, and wrote the manuscript.
Conflict-of-interest disclosure: The authors declare no competing financial interests.
Correspondence: Qing Li, Department of Medicine, University of Michigan, 109 Zina Pitcher, BSRB 1520, Ann Arbor, MI 48109; e-mail: lqing@umich.edu.

This feature is available to Subscribers Only
Sign In or Create an Account Close Modal