

TO THE EDITOR:
The interaction between menin and the mixed lineage leukemia 1 (MLL1) protein plays an important role in aggressive acute leukemia with translocations of the MLL1 (KMT2A) gene1,2 and with mutations in the nucleophosmin (NPM1) gene.3 We and others have recently shown that small-molecule inhibitors of the menin-MLL1 interaction can effectively block leukemia progression in these leukemia subtypes.4-11 This resulted in phase 1 clinical trials with menin inhibitors, including KO-539 (registered at www.clinicaltrials.gov as #NCT04067336), in acute myeloid leukemia (AML) patients. Activating mutations in FLT3 kinase, including internal tandem duplications (FLT3-ITDs), are found in a substantial fraction of AML patients, leading to poor clinical outcomes.12-17 Because overexpression or mutations in FLT3 often cooccur with MLL1 translocations (16%) or MLL1 partial tandem duplications (>50%)15,18-21 and NPM1 mutations (>40%),16,22,23 we hypothesized that the antileukemic activity of menin inhibitors may synergize with FLT3 inhibitors, paving the way for clinical translation of such drug combinations in leukemia.
To pursue combination studies, we selected our recently developed subnanomolar menin-MLL1 inhibitor MI-3454 (supplemental Figure 1A, available on the Blood Web site), a close structural analog of KO-539,9 and the US Food and Drug Administration–approved FLT3 inhibitor gilteritinib or AC220 (quizartinib)17 and performed studies in leukemia cell lines harboring both MLL fusions and FLT3-ITDs (MV4;11 and MOLM13). Indeed, simultaneous treatment with MI-3454 and gilteritinib or AC220 resulted in much stronger cell growth inhibition vs single agents in both cell lines, but not in control cells (Figure 1A-B; supplemental Figures 1B-E and 2A-E). Furthermore, combination of MI-3454 with gilteritinib resulted in much more pronounced apoptosis (60% to 80% of annexin V+ cells), differentiation (increased levels of CD11b and CD14 and elevated expression of MNDA), and stronger reduction in FLT3 protein level over single agents (Figure 1C-D; supplemental Figures 3A-D and 4A-B). Next, we assessed the expression levels of HOXA9 and MEIS1, the key genes implicated in MLL1-rearranged leukemia,9 and found that the combination of MI-3454 and gilteritinib led to significantly stronger downregulation of MEIS1 in both cell lines and HOXA9 in MV4;11 cells than the single-agent treatment (Figure 1E; supplemental Figure 4C).
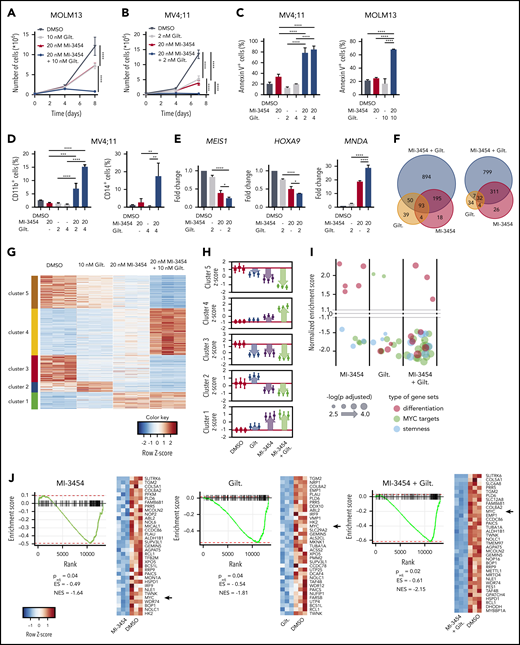
Effect of combinatorial treatment with menin and FLT3 inhibitors in leukemia cells. (A-B) Growth inhibition in MOLM13 (expressing MLL-AF9 and FLT3-ITD) (A) and MV4;11 cells (expressing MLL-AF4 and FLT3-ITD) (B) treated with MI-3454, gilteritinib (Gilt), or their combination. (C) Flow cytometric analysis of apoptosis (annexin V+ cells) induced after 8 days of treatment of MOLM13 and MV4;11 cells with MI-3454, Gilt, or their combination. (D) Flow cytometric quantification of differentiation markers (CD11b+ and CD14+) in MV4;11 cells after single-agent or combinatorial treatment with MI-3454 and Gilt. (E) Gene expression studies in MV4;11 cells after 8 days of treatment with MI-3454, Gilt, or their combination. (A-E) Graphs are representative of 2 independent experiments performed in triplicate. (F-H) Comparison of differentially expressed (DE) genes (adjusted P < .05; fold change >|1.5|) from RNA sequencing (RNA-seq) studies in MOLM13 cells after 8 days of treatment with dimethyl sulfoxide (DMSO), MI-3454, Gilt, or their combination (n = 3 samples per treatment group). (F) Venn diagrams show the overlap of upregulated DE genes (right) and downregulated DE genes (left) relative to DMSO. (G) Heatmap of DE genes after k-means clustering of DE genes using a priori–determined 5 clusters. (H) Average z scores for all treatment groups calculated within each k-means cluster. (I) Summary of fast gene set enrichment analysis results for gene sets relating to targets of MYC, differentiation, or stemness from the RNA-seq studies in MOLM13. Each bubble represents a gene set. Size of bubbles on the plot indicates the level of significance, and y-axis indicates the normalized enrichment score (NES) for the gene sets. (J) Representative gene set enrichment plots for MYC targets for each treatment condition relative to DMSO for the Bild_Myc_Oncogenic_Signature gene set from MSigDB. The heatmaps show genes comprising the leading edge of the gene set enrichment plots. Red indicates high expression; blue indicates low expression; black arrows indicate MYC. *P < .05, **P < .01, ***P < .001, ****P < .0001 by 2- (A-B) or 1-way (C-E) analysis of variance with Tukey multiple comparison test. adj, adjusted; ES, enrichment score.
Effect of combinatorial treatment with menin and FLT3 inhibitors in leukemia cells. (A-B) Growth inhibition in MOLM13 (expressing MLL-AF9 and FLT3-ITD) (A) and MV4;11 cells (expressing MLL-AF4 and FLT3-ITD) (B) treated with MI-3454, gilteritinib (Gilt), or their combination. (C) Flow cytometric analysis of apoptosis (annexin V+ cells) induced after 8 days of treatment of MOLM13 and MV4;11 cells with MI-3454, Gilt, or their combination. (D) Flow cytometric quantification of differentiation markers (CD11b+ and CD14+) in MV4;11 cells after single-agent or combinatorial treatment with MI-3454 and Gilt. (E) Gene expression studies in MV4;11 cells after 8 days of treatment with MI-3454, Gilt, or their combination. (A-E) Graphs are representative of 2 independent experiments performed in triplicate. (F-H) Comparison of differentially expressed (DE) genes (adjusted P < .05; fold change >|1.5|) from RNA sequencing (RNA-seq) studies in MOLM13 cells after 8 days of treatment with dimethyl sulfoxide (DMSO), MI-3454, Gilt, or their combination (n = 3 samples per treatment group). (F) Venn diagrams show the overlap of upregulated DE genes (right) and downregulated DE genes (left) relative to DMSO. (G) Heatmap of DE genes after k-means clustering of DE genes using a priori–determined 5 clusters. (H) Average z scores for all treatment groups calculated within each k-means cluster. (I) Summary of fast gene set enrichment analysis results for gene sets relating to targets of MYC, differentiation, or stemness from the RNA-seq studies in MOLM13. Each bubble represents a gene set. Size of bubbles on the plot indicates the level of significance, and y-axis indicates the normalized enrichment score (NES) for the gene sets. (J) Representative gene set enrichment plots for MYC targets for each treatment condition relative to DMSO for the Bild_Myc_Oncogenic_Signature gene set from MSigDB. The heatmaps show genes comprising the leading edge of the gene set enrichment plots. Red indicates high expression; blue indicates low expression; black arrows indicate MYC. *P < .05, **P < .01, ***P < .001, ****P < .0001 by 2- (A-B) or 1-way (C-E) analysis of variance with Tukey multiple comparison test. adj, adjusted; ES, enrichment score.
To explore the mechanism of the enhanced antileukemic effect of combining MI-3454 and gilteritinib, we performed RNA sequencing studies in MOLM13 cells. We observed that the combination resulted in a doubling of the number of down- and upregulated genes when compared with single agents (Figure 1F; supplemental Figure 5A; supplemental Table 1). Using k-means clustering,24 differentially expressed genes were grouped into 5 clusters of genes with similar expression profiles (Figure 1G). Gene ontology analysis showed that clusters 1 and 4 comprised genes upregulated in all treatment conditions vs dimethyl sulfoxide control, with the combination showing a more pronounced effect than single agents, particularly in cluster 4 (Figure 1G-H). Cluster 1 comprised genes associated with leukocyte or myeloid cell activation and pathways involved in immune response, including differentiation genes MPO, CEBPE, and MAPK14 (supplemental Tables 2 and 3). Genes in cluster 4 also suggested activation of signal transduction pathways, including TLR8, IL10RB, and IL16. In contrast, clusters 3 and 5 contained genes downregulated in all treatment conditions, with the combination inducing a markedly more pronounced effect over single agents, particularly in cluster 5 (Figure 1G-H). This cluster comprised genes associated with proliferation and apoptosis (FLT3, MEF2C, BCL2) as well as with development (supplemental Tables 2 and 3), in agreement with the enhanced antiproliferative effect and apoptosis induced by combinatorial treatment. Finally, cluster 2 involved genes differentially changed by single agents: upregulated by gilteritinib and downregulated by MI-3454, but demonstrating even stronger downregulation by combinatorial treatment. This cluster included genes critical for leukemogenesis, such as MEIS1, HOXA3, HOXA7, HOXA11, and RUNX2 (Figure 1G-H; supplemental Tables 2 and 3), providing evidence of an enhanced antileukemic effect of the combination. Gene set enrichment analysis revealed that the combination of gilteritinib and MI-3454 strongly affected many gene programs, including those related to loss of stemness and induction of differentiation as well as suppression of oncogenic MYC pathways (Figure 1I-J; supplemental Figure 5B; supplemental Table 4), further rationalizing the enhanced antileukemic effect observed with the combination.
We then assessed the in vivo effect of combining menin and FLT3 inhibitors. First, we used the aggressive MOLM13 xenotransplantation model and found that both single-agent (MI-3454 and AC-220) and combinatorial treatment blocked leukemia progression during the treatment period, reflected by a very low level of leukemic blasts (human CD45+ [hCD45+]) in peripheral blood (PB; Figure 2A; supplemental Figure 6A-C). However, once the treatment was stopped, the single agent–treated mice developed leukemia, resulting in a doubling of survival over vehicle (Figure 2A-B). Remarkably, 6 of 8 mice in the combination group did not show any signs of leukemia and had no measurable disease even 9 months after stopping the treatment (Figure 2B; supplemental Figure 6D). These mice had also small spleens and demonstrated highly differentiating phenotypes of bone marrow cells (Figure 2C-D; supplemental Figure 6E). Importantly, the complete remission observed in this aggressive model of MLL1-rearranged leukemia was achieved only in the combination group, with a majority of mice cured of leukemia.
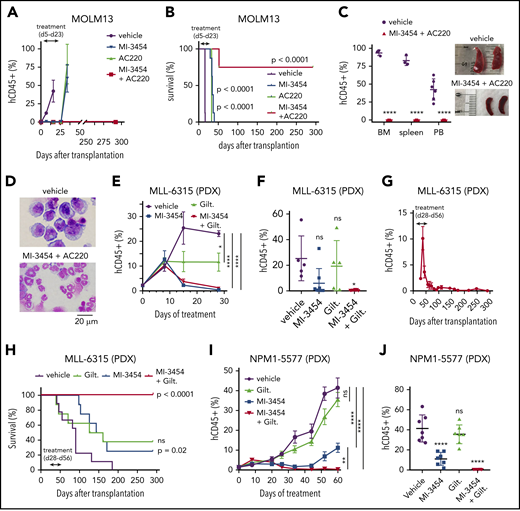
In vivo combinatorial treatment with menin and FLT3 inhibitors. (A) Flow cytometric quantification of hCD45+ cells in PB of mice during treatment with vehicle, MI-3454 (100 mg/kg orally twice daily), AC220 (10 mg/kg orally once daily), or a combination of the 2 agents (doses same as for single agents) in the MOLM13 xenotransplantation model. Mean ± standard error of the mean (SEM; n = 8). (B) Kaplan-Meier survival curves in the MOLM13 xenotransplantation model. Doses as in panel A. P values were calculated using log-rank (Mantel-Cox) test. (C) Left: flow cytometric quantification of hCD45+ cells in PB, spleen, and bone marrow (BM) samples harvested from the vehicle-treated mice (at the terminal stage of leukemia: day 16 posttransplantation) and mice treated with the combination of MI-3454 and AC220 (samples collected at day 292 posttransplantation) in the MOLM13 model. Mean ± standard deviation (SD; n = 3-6 [vehicle: n = 6 for PB, n = 3 for BM and spleen; MI-3454 + AC220 group: n = 6). Right: images of spleens collected from the vehicle and combination cohorts of mice. (D) Wright-Giemsa–stained cytospins for BM samples isolated from the vehicle and MI-3454 + AC220 cohorts of MOLM13 mice at the same time points as in panel C. (E) Flow cytometric quantification of hCD45+ cells in PB of MLL-6315 patient-derived xenograft (PDX) mice during treatment with vehicle, MI-3454 (80 mg/kg orally twice daily), gilteritinib (Gilt; 35 mg/kg orally once daily), or the combination of MI-3454 and Gilt (doses same as for single agents). Mean ± SEM (n = 8). (F) Flow cytometric quantification of hCD45+ cells in PB from MLL-6315 PDX mice 27 days after treatment was stopped (day 82 posttransplantation). Doses as in panel E. Mean ± SD. (G) Flow cytometric quantification of hCD45+ cells in PB of MLL-6315 PDX mice treated with the combination of MI-3454 and Gilt. Mean ± SEM (n = 8). (H) Kaplan-Meier survival curves for MLL-6315 PDX mice (n = 8). Treatment doses as in panel E. Treatment time is indicated by the arrow. P values were calculated using the log-rank (Mantel-Cox) test. (I) Flow cytometric quantification of hCD45+ cells in PB of NPM1-5577 PDX mice during 60 days of treatment with vehicle, Gilt (35 mg/kg orally once daily), MI-3454 (80 mg/kg twice daily for the first 28 days, followed by 80 mg/kg orally once daily for an additional 32 days; treatment with MI-3454 was reduced to once-daily administration because of limited tolerance of prolonged treatment in the combination group), or combination of MI-3454 and Gilt (doses same as for single agents). Mean ± SD (n = 7). (J) Flow cytometric quantification of hCD45+ cells in PB of NPM1-5577 PDX mice at the last day of treatment. Mean ± SD. *P < .05, **P < .01, ****P < .0001 by 2-tailed Student t test (C) or 2- (E,I) or 1-way (F,J) analysis of variance with Tukey multiple comparison test. ns, not significant.
In vivo combinatorial treatment with menin and FLT3 inhibitors. (A) Flow cytometric quantification of hCD45+ cells in PB of mice during treatment with vehicle, MI-3454 (100 mg/kg orally twice daily), AC220 (10 mg/kg orally once daily), or a combination of the 2 agents (doses same as for single agents) in the MOLM13 xenotransplantation model. Mean ± standard error of the mean (SEM; n = 8). (B) Kaplan-Meier survival curves in the MOLM13 xenotransplantation model. Doses as in panel A. P values were calculated using log-rank (Mantel-Cox) test. (C) Left: flow cytometric quantification of hCD45+ cells in PB, spleen, and bone marrow (BM) samples harvested from the vehicle-treated mice (at the terminal stage of leukemia: day 16 posttransplantation) and mice treated with the combination of MI-3454 and AC220 (samples collected at day 292 posttransplantation) in the MOLM13 model. Mean ± standard deviation (SD; n = 3-6 [vehicle: n = 6 for PB, n = 3 for BM and spleen; MI-3454 + AC220 group: n = 6). Right: images of spleens collected from the vehicle and combination cohorts of mice. (D) Wright-Giemsa–stained cytospins for BM samples isolated from the vehicle and MI-3454 + AC220 cohorts of MOLM13 mice at the same time points as in panel C. (E) Flow cytometric quantification of hCD45+ cells in PB of MLL-6315 patient-derived xenograft (PDX) mice during treatment with vehicle, MI-3454 (80 mg/kg orally twice daily), gilteritinib (Gilt; 35 mg/kg orally once daily), or the combination of MI-3454 and Gilt (doses same as for single agents). Mean ± SEM (n = 8). (F) Flow cytometric quantification of hCD45+ cells in PB from MLL-6315 PDX mice 27 days after treatment was stopped (day 82 posttransplantation). Doses as in panel E. Mean ± SD. (G) Flow cytometric quantification of hCD45+ cells in PB of MLL-6315 PDX mice treated with the combination of MI-3454 and Gilt. Mean ± SEM (n = 8). (H) Kaplan-Meier survival curves for MLL-6315 PDX mice (n = 8). Treatment doses as in panel E. Treatment time is indicated by the arrow. P values were calculated using the log-rank (Mantel-Cox) test. (I) Flow cytometric quantification of hCD45+ cells in PB of NPM1-5577 PDX mice during 60 days of treatment with vehicle, Gilt (35 mg/kg orally once daily), MI-3454 (80 mg/kg twice daily for the first 28 days, followed by 80 mg/kg orally once daily for an additional 32 days; treatment with MI-3454 was reduced to once-daily administration because of limited tolerance of prolonged treatment in the combination group), or combination of MI-3454 and Gilt (doses same as for single agents). Mean ± SD (n = 7). (J) Flow cytometric quantification of hCD45+ cells in PB of NPM1-5577 PDX mice at the last day of treatment. Mean ± SD. *P < .05, **P < .01, ****P < .0001 by 2-tailed Student t test (C) or 2- (E,I) or 1-way (F,J) analysis of variance with Tukey multiple comparison test. ns, not significant.
Next, we developed and used a PDX model derived from the AML patient sample harboring MLL-ENL, FLT3 S451, and NRAS mutations (MLL-6315 PDX; supplemental Table 5). Treatment of mice with MI-3454, gilteritinib, or their combination was initiated when the level of hCD45+ cells in PB reached ∼2% and was continued for 28 days, resulting in no substantial toxicity (supplemental Figure 7A-B). Interestingly, during the treatment period, the blast level in PB initially increased in all treatment groups (day 8 of treatment), but later, it dropped substantially in MI-3454 and combination groups (Figure 2E). The vehicle- and gilteritnib-treated mice developed terminal leukemia, with no significant difference in survival (Figure 2H; supplemental Figure 7C). Interestingly, despite a strong reduction in the blast level of MI-3454–treated mice (days 8-28 of treatment), these mice eventually developed leukemia, with survival double that of vehicle control (Figure 2E-F,H). Remarkably, complete remission was achieved in the combination group, with no blasts detected in PB even at 7.5 months after completion of treatment, supporting no measurable disease (Figure 2E-H; supplemental Figure 7D), and with all mice cured of leukemia.
To assess whether combinatorial treatment with menin and an FLT3 inhibitor is effective in NPM1-mutated leukemia with an FLT3-ITD, we used a PDX model derived from the AML primary sample harboring both mutations (NPM1-5577 PDX; supplemental Table 5). Gilteritinib as a single agent did not show a significant effect on leukemia progression in this PDX model (Figure 2I-J). Interestingly, although MI-3454 was initially very effective in reducing leukemia progression, after 40 days of treatment, the level of hCD45+ cells increased in this group, likely because of the reduced dose (from a twice- to once-daily schedule) administered as a result of limited tolerability in the combination group (Figure 2I-J; supplemental Figure 8A-B). Remarkably, in the combination group, the blast level remained very low (<0.5%) over the entire course of the experiment, demonstrating a superior effect of combination over menin or FLT3 inhibitors in the NPM1-mutated leukemia model (Figure 2I-J; supplemental Figure 8C-D).
In summary, our study demonstrates the strong synergistic effect of the combination of menin and FLT3 inhibitors. Although the MI-3454 developed by us as well as the recently published VTP-50469 manifested potent antileukemic activity in MLL1-rearranged and NPM1-mutated leukemias as single agents, they led to complete remission only in selected leukemia models.9,10 In this study, we discovered that only the combination of menin and FLT3 inhibitors could cure mice in aggressive leukemia models harboring activating FLT3 mutations in addition to MLL1 translocations or NPM1 mutations. Mechanistically, this combination induced stronger downregulation of MEIS1 and HOXA cluster genes and demonstrated a more pronounced effect on MYC, stemness, and differentiation pathways over single agents, concurring with a recent report.25 Importantly, we found that the combination of potent menin and FLT3 inhibitors was particularly effective in vivo, leading to complete and long-lasting remission of leukemia in mice. Our findings can be directly translated to initiate clinical trials with this combination in AML patients.
RNA sequencing data for MOLM13 cells treated with dimethyl sulfoxide, MI-3454, gilteritinib, or combination of MI-3454 and gilteritinib were submitted to the Gene Expression Omnibus database (accession code GSE149049).
The online version of this article contains a data supplement.
Acknowledgments
The authors thank Martin Carroll from the Stem Cell and Xenograft Core at the University of Pennsylvania for providing patient samples for these studies. The mouse work was performed under the oversight of the University Committee on Use and Care of Animals at the University of Michigan.
This work was supported by Kura Oncology, Inc.; National Institutes of Health (NIH), National Cancer Institute (NCI) R01 grants 1R01CA160467 and 1R01CA201204 (J.G.); NIH, NCI R01 grants 1R01 CA207272 and 1R01 CA226759 (T.C.); a Leukemia & Lymphoma Society (LLS) Scholar Award (1215-14; J.G.); an LLS Scholar Award (T.C.); American Cancer Society Mission Boost grant MBG-19-095-01-COUN (J.G.); and NIH T32 training grant T32DK007519 (J.R.) from National Institute of Diabetes and Digestive and Kidney Diseases.
Authorship
Contribution: S.K. and D.C. designed and synthesized compounds; H.M., K.K., and E.K. designed and performed in vivo efficacy studies and biological studies in leukemia cell lines and primary patient samples; T.P. performed cell biology experiments; G.D.-D. and W.T. supported the project with primary patient samples and interpreted data; J.R. analyzed RNA sequencing data; and J.G. and T.C. directed the entire project, designed the experiments, analyzed the results, and wrote the manuscript, with input from all authors.
Conflict-of-interest disclosure: J.G. and T.C. have received research support from Kura Oncology, Inc.; have served as consultants for Kura Oncology, Inc., and have equity ownership in the company; and are coinventors on patent applications covering MI-3454. S.K. and H.M. are coinventors on patent applications covering MI-3454 or related compounds, which were licensed by Kura Oncology, Inc. J.G., T.C., S.K., and H.M. receive royalties from the University of Michigan on patents covering menin inhibitors, which were licensed to Kura Oncology, Inc. The remaining authors declare no competing financial interests.
Correspondence: Jolanta Grembecka, Department of Pathology, University of Michigan, 1150 West Medical Center Dr, MSRB I, Room 4510D, Ann Arbor, MI, 48108; e-mail: jolantag@umich.edu; or Tomasz Cierpicki, Department of Pathology, University of Michigan, 1150 West Medical Center Dr, MSRB I, Room 4510C, Ann Arbor, MI, 48108; e-mail: tomaszc@umich.edu.
