

TO THE EDITOR:
Polyethylene glycol conjugated asparaginase (pegaspargase) is used for acute lymphoblastic leukemia (ALL). Pharmacokinetics of pegaspargase is affected by antiasparaginase antibodies,1,2 but other factors affecting asparaginase pharmacokinetics should be investigated. In a frontline ALL trial, we showed no difference in treatment outcome between pegaspargase 2500 U/m2 and 3500 U/m2.3
On St. Jude Children’s Research Hospital Total XVI protocol (NCT00549848), patients received 3000 U/m2 pegaspargase (Oncaspar) IV on day 3 of induction. After induction, pegaspargase differed by risk arm (supplemental Figure 1, available on the Blood Web site); 411 patients were randomized to receive 2500 or 3500 U/m2 during continuation3 and nonrandomized patients were assigned to 2500 U/m2 (supplemental Figure 2). Serum pharmacokinetics were assessed on 3 occasions: induction, week 7 of continuation, and week 17 of continuation treatment (supplemental Figure 1). The data were well fit by a nonlinear 1-compartment model (supplemental Methods). We found that 99.7%, 97.7%, and 99.8% of doses resulted in day 14 trough concentrations >0.1 U/mL at induction, week 7, and week 17, respectively (supplemental Figure 5; Figure 1A-B), with a median time >0.1 U/mL (threshold time or TT) for each dose estimated at more than 22 days for all occasions, risk groups, and dosages (supplemental Table 4; Figure 1C-D).

Individual post hoc pegaspargase pharmacokinetic estimates day 14 activity, threshold time, Vmax , and CLint during continuation week 7 and week 17 differed by risk arm and randomized pegaspargase dosage levels. There were 84, 89, 82, and 96 patients in low risk (LR, intermittent dosing) 2500 U/m2, standard/high risk (SHR, continuous dosing) 2500 U/m2, LR 3500 U/m2, and SHR 3500 U/m2 group, respectively, for week 7; and 63, 74, 66, and 79 in LR 2500, SHR 2500, LR 3500, and SHR 3500 group, respectively, for week 17. In each plot, red P values compare between different randomized dosage levels within SHR patients; blue P values compare between different randomized dosage levels within LR patients. P values below each plot in black compare between different risk arms randomized to receive the same dosage level. All P values were generated using linear mixed-effect model adjusting for antibody status and clinical reaction. Only randomized patients were included in these analyses.
Individual post hoc pegaspargase pharmacokinetic estimates day 14 activity, threshold time, Vmax , and CLint during continuation week 7 and week 17 differed by risk arm and randomized pegaspargase dosage levels. There were 84, 89, 82, and 96 patients in low risk (LR, intermittent dosing) 2500 U/m2, standard/high risk (SHR, continuous dosing) 2500 U/m2, LR 3500 U/m2, and SHR 3500 U/m2 group, respectively, for week 7; and 63, 74, 66, and 79 in LR 2500, SHR 2500, LR 3500, and SHR 3500 group, respectively, for week 17. In each plot, red P values compare between different randomized dosage levels within SHR patients; blue P values compare between different randomized dosage levels within LR patients. P values below each plot in black compare between different risk arms randomized to receive the same dosage level. All P values were generated using linear mixed-effect model adjusting for antibody status and clinical reaction. Only randomized patients were included in these analyses.
Patients randomized to 3500 U/m2 did not have more pancreatitis, thrombosis, osteonecrosis, or serious hepatotoxicity than patients randomized to 2500 U/m2 (Figure 2), nor did they receive fewer doses of pegaspargase (13.8 vs 13.3 doses among standard/high-risk [SHR] patients, P = .43; 4.5 vs 4.6 doses among low-risk (LR) patients, P = .56). At induction, there were no associations between systemic exposure and serum total bilirubin or creatinine, but greater exposure (lower initial maximum velocity [Vmax], lower intrinsic clearance [CLint], higher estimated day 14 serum asparaginase activity, and longer TT) was associated with higher serum alanine aminotransferase level, adjusting for age and sex (P ≤ .010; supplemental Figure 7).
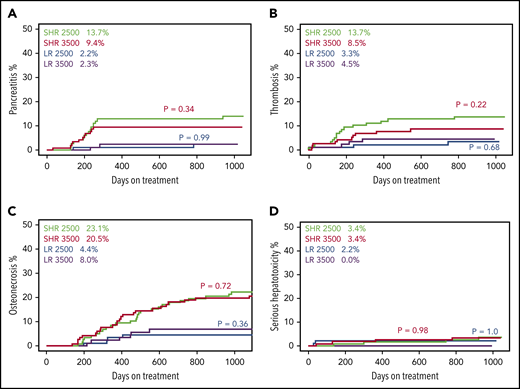
Randomization to 2500 vs 3500 U/m2 pegaspargase dosage did not affect incidence of pancreatitis, thrombosis, osteonecrosis, and serious hepatotoxicity. (A) Grade ≥2. (B) Grade ≥2. (C) Grade ≥2. (D) Grade ≥3. Green lines are standard/high risk (SHR) patients randomized to receive pegaspargase 2500 U/m2 (n = 117), red lines are SHR patients randomized to receive pegaspargase 3500 U/m2 (n = 116), blue lines are low risk (LR) patients randomized to receive pegaspargase 2500 U/m2 (n = 88), purple lines are LR patients randomized to receive pegaspargase 3500 U/m2 (n = 90). Red P values compare between SHR 2500 U/m2 and SHR 3500 U/m2 patients. Blue P values compare between LR 2500 U/m2 and LR 3500 U/m2 patients. Percentage values show the cumulative incidence of the corresponding toxicity in each risk/dosage group. Only randomized patients were included in these analyses.
Randomization to 2500 vs 3500 U/m2 pegaspargase dosage did not affect incidence of pancreatitis, thrombosis, osteonecrosis, and serious hepatotoxicity. (A) Grade ≥2. (B) Grade ≥2. (C) Grade ≥2. (D) Grade ≥3. Green lines are standard/high risk (SHR) patients randomized to receive pegaspargase 2500 U/m2 (n = 117), red lines are SHR patients randomized to receive pegaspargase 3500 U/m2 (n = 116), blue lines are low risk (LR) patients randomized to receive pegaspargase 2500 U/m2 (n = 88), purple lines are LR patients randomized to receive pegaspargase 3500 U/m2 (n = 90). Red P values compare between SHR 2500 U/m2 and SHR 3500 U/m2 patients. Blue P values compare between LR 2500 U/m2 and LR 3500 U/m2 patients. Percentage values show the cumulative incidence of the corresponding toxicity in each risk/dosage group. Only randomized patients were included in these analyses.
In the population pharmacokinetic model, both continuity of dosing (SHR vs LR) and dosage randomization affected pegaspargase pharmacokinetics (P < 1.1 × 10⁻¹⁶ for both; supplemental Table 2). Among patients randomized to receive 2500 U/m2, SHR (continuous dosing) patients had higher Vmax and CLint than LR patients (intermittent dosing) during both weeks 7 and 17 (P = 1.5 × 10⁻²⁹ and 2.1 × 10⁻²² for Vmax and CLint at week 7; P = 1.7 × 10−39 and 3.2 × 10⁻³¹ for Vmax and CLint at week 17; Figure 1E-H). The same difference by risk arm was observed in patients receiving 3500 U/m2 (P = 7.1 × 10⁻²⁶ and 1.6 × 10⁻¹⁹ for Vmax and CLint at week 7; P = 9.4 × 10−50 and 2.6 × 10−40 for Vmax and CLint at week 17; Figure 1E-H). Moreover, SHR patients had higher Vmax and CLint during week 17 than week 7 when comparing within the same dosage level (P ≤ 1.1 × 10⁻⁶; supplemental Figure 8B,D). This difference in pharmacokinetics from week 7 to week 17 was not observed in LR patients at either dosage, whose asparaginase treatment was given intermittently (not continuously) (P ≥ .22; supplemental Figure 8A,C). These results indicate that continuous dosing may accelerate clearance of pegaspargase over time.
Pegaspargase dosage also affected clearance. For both continuation weeks 7 and 17, patients randomized to receive 3500 U/m2 had higher Vmax and CLint than those randomized to 2500 U/m2 on the same risk arm (Figure 1E-H; supplemental Results). In addition, LR patients randomized to receive 2500 U/m2 had lower Vmax and CLint during continuation week 7 than they did during induction, when they received the higher 3000 U/m2 dosage (supplemental Figure 8A,C). Similarly, LR patients receiving 3500 U/m2 had higher Vmax and CLint during continuation week 7 than they did during induction (supplemental Figure 8A,C).
Systemic exposure to pegaspargase was affected by dosage, dosing continuity, and clearance. Because of higher clearance with continuous dosing, SHR patients had lower day 14 activity and shorter TT during week 17 than week 7 (P ≤ 2.2 × 10⁻⁸; supplemental Figure 8F,H). In contrast, no such difference was observed for LR patients (P ≥ .28; supplemental Figure 8E,G). Moreover, SHR patients (continuous dosing) had shorter TT for continuation week 17 than LR patients (intermittent dosing) randomized to the same dosage arm (P = 6.3 × 10⁻⁸ for 2500 U/m2 arm; P = 1.3 × 10⁻¹¹ for 3500 U/m2 arm; Figure 1D). As a result of faster clearance with the higher dosage, TT was not longer at 3500 U/m2 than 2500 U/m2 among LR or among SHR patients at continuation weeks 7 or 17 (supplemental Results; Figure 1; supplemental Figure 5).
Both hypersensitivity (P < 2.2 × 10⁻¹⁶) and antipegaspargase antibodies (P = 9.7 × 10⁻⁴) were associated with faster elimination (supplemental Table 1), but associations differed by risk arm, dosage randomization, and occasion. For continuation week 7, antipegaspargase positivity was associated with lower day 14 activity (P = 2.4 × 10⁻²⁰), and shorter TT (P = 7.8 × 10⁻²¹; supplemental Figure 9A) adjusting for hypersensitivity and dosage among LR patients (intermittent dosing); this was also true for continuation week 17 among LR patients (supplemental Results). For continuation weeks 7 and 17 among SHR patients (continuous dosing), none of the post hoc parameters were associated with antipegaspargase positivity adjusting for hypersensitivity and dosage randomization (P ≥ .17, supplemental Results; supplemental Figure 9B). No other factors, including age, sex, genetic ancestry, or ALL lineage, were associated with pharmacokinetics.
In summary, in this trial that randomized patients to receive 3500 U/m2 vs a standard dosage of 2500 U/m2, we did not observe any difference in toxicities between the 2 dosages (Figure 2). Interestingly, a prior study of pegaspargase dosages (with highest dosage of only 1500 U/m2) individualized based on trough plasma levels also did not find toxicity associated with dosage.4 This is consistent with and could be explained by the surprising effects of pegaspargase dosage and dosing continuity on pharmacokinetics, which resulted in a lack of difference in number of days with asparaginase activity >0.1 U/mL (TT) by dosage randomization (supplemental Figure 5; Figure 1C-D). Although alanine aminotransferase levels during induction were associated with asparaginase exposure (supplemental Figure 7), as we reported previously,5 this did not translate into more clinically significant hepatotoxicity and were not observed after remission induction. The lack of difference in TT by dosage was caused by accelerated clearance with higher dosage or continuous dosing (Figure 1; supplemental Figure 8). This effect of dosage and dosing continuity on clearance is termed “accelerated blood clearance” (ABC) and has been reported in animals treated with PEGylated reagents.6,7 We observed for the first time an ABC phenomenon in humans. Whether ABC occurs for other PEGylated therapeutics in humans is not known. To our knowledge, this is the first report of faster clearance of pegaspargase, or any PEGylated medications, when administered at higher dosages.
Here, we used a nonlinear model that reasonably described pegaspargase pharmacokinetics; nonlinear models have been reported by others.8,9 Our volume of distribution was comparable to a previous report.10 This concordance indicates that population modeling, using limited rather than extensive sampling, could be used in future pegaspargase studies.
In conclusion, our data show that dosages >2500 U/m2 are not necessary, consistent with our treatment outcome.3 Several ALL trial groups are investigating even lower dosages of pegaspargase.4 Given the effect of continuity of dosing and nonlinearity of elimination, pharmacokinetic evaluations should accompany new dosing strategies for this drug.
The online version of this article contains a data supplement.
Acknowledgments
The authors thank Pam McGill, Xiangjun Cai, and May Chung for their technical assistance; all patients and their families for their participation; and participating clinicians and research staff, including Deqing Pei.
This work was supported by National Institutes of Health, National Cancer Institute (CA142665, CA21765), investigator-initiated research funding from Servier, and the American Lebanese Syrian Associated Charities (ALSAC).
Authorship
Contribution: Y.L., J.C.P., and M.V.R. developed the pharmacokinetic model, analyzed and interpreted the data, and wrote the manuscript; S.J., C.-H.P., H.I., C.C., M.V.R., and W.E.E. developed the protocol; S.J., C.-H.P., and H.I. recruited patients and interpreted the data; C.C. and W.Y. analyzed the data; and J.J.Y., S.E.K., and W.E.E. interpreted the data.
Conflict-of-interest disclosure: M.V.R., H.I., C.-H.P., and St. Jude Children’s Research Hospital receive investigator-initiated research funding from Servier Pharmaceuticals. C.-H.P. also received an honorarium from Servier Pharmaceuticals. The remaining authors declare no competing financial interests.
Correspondence: Mary V. Relling, St. Jude Children’s Research Hospital, 262 Danny Thomas Pl, Room I5112, Memphis, TN 38105; e-mail: mary.relling@stjude.org.

This feature is available to Subscribers Only
Sign In or Create an Account Close Modal