

Key Points
Frequent losses at chromosome 20q13.13 provide genetic justification to recognize BIA-ALCL as a separate disease entity.
Omnipresent chromosomal aberrations in BIA-ALCL may be a basis for a sensitive screening assay for women with breast implant–related seroma.

Abstract
Breast implant–associated anaplastic large cell lymphoma (BIA-ALCL) is a very rare type of T-cell lymphoma that is uniquely caused by a single environmental stimulus. Here, we present a comprehensive genetic analysis of a relatively large series of BIA-ALCL (n = 29), for which genome-wide chromosomal copy number aberrations (CNAs) and mutational profiles for a subset (n = 7) were determined. For comparison, CNAs for anaplastic lymphoma kinase (ALK)− nodal anaplastic large cell lymphomas (ALCLs; n = 24) were obtained. CNAs were detected in 94% of BIA-ALCLs, with losses at chromosome 20q13.13 in 66% of the samples. Loss of 20q13.13 is characteristic of BIA-ALCL compared with other classes of ALCL, such as primary cutaneous ALCL and systemic type ALK+ and ALK− ALCL. Mutational patterns confirm that the interleukin-6–JAK1–STAT3 pathway is deregulated. Although this is commonly observed across various types of T-cell lymphomas, the extent of deregulation is significantly higher in BIA-ALCL, as indicated by phosphorylated STAT3 immunohistochemistry. The characteristic loss of chromosome 20 in BIA-ALCL provides further justification to recognize BIA-ALCL as a separate disease entity. Moreover, CNA analysis may serve as a parameter for future diagnostic assays for women with breast implants to distinguish seroma caused by BIA-ALCL from other causes of seroma accumulation, such as infection or trauma.
Medscape Continuing Medical Education online
In support of improving patient care, this activity has been planned and implemented by Medscape, LLC and the American Society of Hematology. Medscape, LLC is jointly accredited by the Accreditation Council for Continuing Medical Education (ACCME), the Accreditation Council for Pharmacy Education (ACPE), and the American Nurses Credentialing Center (ANCC), to provide continuing education for the healthcare team.
Medscape, LLC designates this Journal-based CME activity for a maximum of 1.00 AMA PRA Category 1 Credit(s)™. Physicians should claim only the credit commensurate with the extent of their participation in the activity.
Successful completion of this CME activity, which includes participation in the evaluation component, enables the participant to earn up to 1.0 MOC points in the American Board of Internal Medicine's (ABIM) Maintenance of Certification (MOC) program. Participants will earn MOC points equivalent to the amount of CME credits claimed for the activity. It is the CME activity provider's responsibility to submit participant completion information to ACCME for the purpose of granting ABIM MOC credit.
All other clinicians completing this activity will be issued a certificate of participation. To participate in this journal CME activity: (1) review the learning objectives and author disclosures; (2) study the education content; (3) take the post-test with a 75% minimum passing score and complete the evaluation at http://www.medscape.org/journal/blood; and (4) view/print certificate. For CME questions, see page 2966.
Disclosures
Associate Editor Laurie H. Sehn served as advisor or consultant for AbbVie Inc., Acerta Pharma, Amgen Inc., Apobiologix, AstraZeneca Pharmaceuticals LP, Celgene Corporation, Gilead Sciences, Inc., Lundbeck Inc., Janssen Pharmaceuticals, Inc., Karyopharm Therapeutics, Kite Pharma Inc., Merck & Co., Inc., MorphoSys, Roche/Genentech, Inc., SeaGen Inc., Teva, TG Therapeutics, Inc., and Verastem Oncology and received grants for clinical research from Lundbeck, Inc. and Roche/Genentech, Inc. CME questions author Laurie Barclay, freelance writer and reviewer, Medscape, LLC and the authors declare no competing financial interests.
Learning objectives
Upon completion of this activity, participants will be able to:
Describe copy number aberrations (CNAs) identified by shallow whole-genome sequencing in a well-defined series of patients with breast implant-associated anaplastic large cell lymphoma (BIA-ALCL) and compare the CNAs to those in a control cohort of patients with anaplastic lymphoma kinase-negative ALCL
Determine differences between tumor and seroma BIA-ALCL and mutations identified by whole-exome sequencing in a well-defined series of patients with BIA-ALCL
Identify clinical implications of the genomic landscape of BIA-ALCL, according to findings from a well-defined series of patients with BIA-ALCL
Release date: December 17, 2020; Expiration date: December 17, 2021
Introduction
Breast implant–associated anaplastic large cell lymphoma (BIA-ALCL) is a rare class of T-cell lymphoma and is listed as separate provisional entity in the World Health Organization classification.1 In the past 10 years, the incidence of BIA-ALCL has dramatically increased, and lymphoma risk has become a matter of concern for national public health regulatory bodies worldwide. Previously, we showed that women with breast implants have a >400-fold increased relative risk to develop breast anaplastic large cell lymphoma (ALCL) than do women without breast implants, with an absolute lifetime risk of 1 in 7000.2
In most patients, BIA-ALCL is limited to the periprosthetic seroma space (seroma BIA-ALCL); progression is seen into the capsule or breast tissue (tumor BIA-ALCL) in only ∼20% of patients.
BIA-ALCL belongs to the family of ALCL, which also includes systemic anaplastic lymphoma kinase (ALK)+ and ALK-negative or nodal-type ALCL (nALCL), and primary cutaneous ALCL (pcALCL).1,3
The first molecular evidence for BIA-ALCL as a separate entity was published in 2019, based on gene expression in a set of 12 samples.4 Comprehensive molecular data for BIA-ALCL have been limited.4-9 Recently, a cohort of 34 BIA-ALCL cases analyzed by whole-exome sequencing (WES) showed recurrent mutations in the JAK-STAT pathway, epigenetic modifiers, and TP53.10 This study confirms findings from previous smaller series.5-9 Together, these reports demonstrate that recurrent activating mutations in the JAK-STAT pathway and epigenetic modifiers have major oncogenic importance. However, they are common among all ALCL family members4,10,11 and other T-cell lymphoma entities, including peripheral T-cell lymphoma-not otherwise specified (PTCL-NOS),11 and are not specific for BIA-ALCL.5-10 Because no statistically significant defining genomic characteristic unique to BIA-ALCL has been determined thus far, we complemented information on the genomic landscape of BIA-ALCL by analyzing chromosomal copy number aberrations (CNAs) using shallow whole-genome sequencing (WGS) (n = 29), as well as mutations by WES (n = 7), in a well-defined series of BIA-ALCL patients and compared the CNAs with a control cohort of ALK− nALCL patients (n = 24).
Study design
We identified all patients with BIA-ALCL diagnosed between 1990 and 2018 in The Netherlands (n = 50).2 Sufficient DNA could be isolated from 35 formalin-fixed paraffin-embedded samples from 29 patients, including seroma BIA-ALCL (n = 13), tumor BIA-ALCL (n = 10), and paired samples of seroma BIA-ALCL and tumor BIA-ALCL (n = 6). As a control cohort, 24 ALK− nALCL samples, of which 7 had localized in the breast but were not implant associated, and 17 were from other sites, were collected from the archives of the Department of Pathology Amsterdam UMC.
DNA was processed for 50-bp single-ended shallow WGS on a HiSeq 4000 (Illumina, San Diego CA), and CNAs and copy number load were calculated as previously described.12 Based on the CNA profiles, the intratumoral heterogeneity was estimated (E.v.D., Tom van den Bosch, Kristiaan J. Lenos, Khalid El Makrini, Lisanne E. Nijman, Hendrik F. B. van Essen, Nico Lansu, Michiel Boekhout, Joris H. Hageman, Rebecca C. Fitzgerald, Jurriaan B. Tuynman, Hugo J. G. Snippert, Geert J. P. L. Kops, Jan Paul Medema, B.Y., Louis Vermeulen, and D.M.M., manuscript submitted May 2020). For WES, a SeqCap EZ MedExome targeted enrichment kit (Roche, Pleasanton, CA) was used. Detailed methods can be found as supplemental Methods (available on the Blood Web site).
Results and discussion
From 29 patients, 35 formalin-fixed paraffin-embedded samples, including 6 paired seroma and tumor pairs, could be included in this study. Twenty patients had breast implants for cosmetic reasons, 8 had implants after mastectomy for breast cancer, and 1 patient had implants after preventive mastectomy. Further clinicopathological information is listed in supplemental Tables 1 and 2.
CNAs in BIA-ALCL
Shallow WGS was performed for all BIA-ALCLs and 24 ALK− nALCLs. CNAs were detected in 27 of 29 BIA-ALCL patients (94%) and in 23 of 24 ALK− nALCL patients (96%) (supplemental Figure 1). The most frequent CNAs in BIA-ALCL were gain of chromosome 2p25-pter (48%) and losses of 8p (48%), 20p13-p12 (48%), and 20q13.12-q12.2 (66%) (Figure 1A). Chromosome 9p24 gains are detected in 27.5% of BIA-ALCLs, as also reported previously.13 The most frequent CNA, 20q13.12-q13.2 loss, had a smallest region of overlap of 3 Mb (Figure 1B). In 7 patients, this was combined with a 1.4-Mb subcentromeric gain of 20q11.21. Because these regions are highly gene dense, no specific or obvious driver-gene candidate could readily be identified. Only limited CNA data are available from published case series; chromosome 20 loss is reported in 10 of 15 cases.6,10,14 This further supports that chromosome 20 loss is indeed characteristic for BIA-ALCL and is not restricted to Dutch patients.
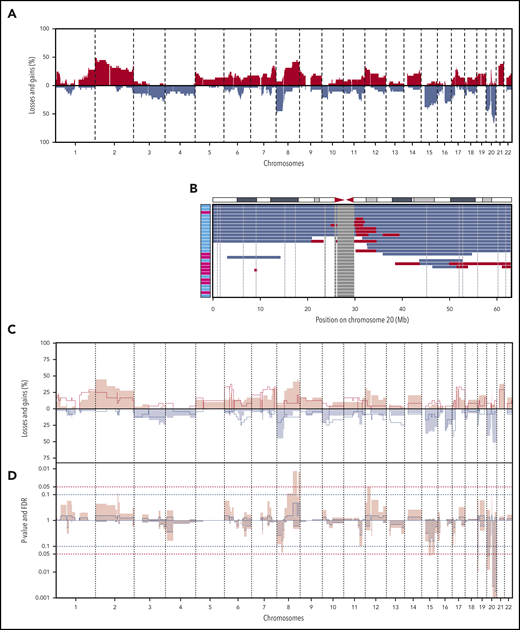
CNAs in 29 BIA-ALCL and ALK−nALCL cases. (A) CNA frequencies of 29 BIA-ALCL patient samples. Frequency of gains (red) and losses (blue) are shown on the y-axis, sorted in chromosomal order and by chromosomal position on the x-axis. The top 5 most frequent CNAs in BIA-ALCL are gains of chromosome 2p25-pter (48%) and 8q24-qter (45%) and losses of chromosome 8p (48%), 20p13-p12 (48%), and 20q13.12-q13.2 (66%). Of the 6 paired samples, only CNA of the seromas are included. (The same frequency plot is created for the CNAs of matching tumors; see supplemental Figure 2.) (B) Chromosome 20 CNAs with seroma BIA-ALCL (light blue) and tumor BIA-ALCL (magenta) on the y-axis and gains (red), losses (blue), and blacklisted regions (gray) by chromosomal position on the x-axis. The ideogram of chromosome 20 is given above the graph. The smallest region of overlap and, hence, the most frequently lost region, is at chromosomal band 20q13.13-13.2. (C) Comparison plot for CNAs between BIA-ALCL (filled; n = 29) and ALK− nALCL (lines, n = 24). Gains (positive value, red) and losses (negative value, blue) are depicted, sorted by chromosomal position (x-axis). (D) Frequency plot of P value (pink) calculated with a 2-sided Wilcoxon rank-sum test with 10 000 permutations and false discovery rate (FDR, striped segments) of the difference in CNAs; the horizontal dotted lines show the significance thresholds (red: P < .05; blue: FDR <0.1). If the difference in CNA level crosses the P value, and the FDR level is <0.1, the difference is considered significant. Significant differences are seen for losses at chromosome 19, 20p, and 20q.
CNAs in 29 BIA-ALCL and ALK−nALCL cases. (A) CNA frequencies of 29 BIA-ALCL patient samples. Frequency of gains (red) and losses (blue) are shown on the y-axis, sorted in chromosomal order and by chromosomal position on the x-axis. The top 5 most frequent CNAs in BIA-ALCL are gains of chromosome 2p25-pter (48%) and 8q24-qter (45%) and losses of chromosome 8p (48%), 20p13-p12 (48%), and 20q13.12-q13.2 (66%). Of the 6 paired samples, only CNA of the seromas are included. (The same frequency plot is created for the CNAs of matching tumors; see supplemental Figure 2.) (B) Chromosome 20 CNAs with seroma BIA-ALCL (light blue) and tumor BIA-ALCL (magenta) on the y-axis and gains (red), losses (blue), and blacklisted regions (gray) by chromosomal position on the x-axis. The ideogram of chromosome 20 is given above the graph. The smallest region of overlap and, hence, the most frequently lost region, is at chromosomal band 20q13.13-13.2. (C) Comparison plot for CNAs between BIA-ALCL (filled; n = 29) and ALK− nALCL (lines, n = 24). Gains (positive value, red) and losses (negative value, blue) are depicted, sorted by chromosomal position (x-axis). (D) Frequency plot of P value (pink) calculated with a 2-sided Wilcoxon rank-sum test with 10 000 permutations and false discovery rate (FDR, striped segments) of the difference in CNAs; the horizontal dotted lines show the significance thresholds (red: P < .05; blue: FDR <0.1). If the difference in CNA level crosses the P value, and the FDR level is <0.1, the difference is considered significant. Significant differences are seen for losses at chromosome 19, 20p, and 20q.
The CNAs of BIA-ALCL were compared with ALK− nALCL. Statistically significant differences were found for chromosome 19p13.3 loss (0% vs 25%; P = .01; false discovery rate [FDR], 0.03), 20p13-p12 loss (45% vs 8%; P = .01; FDR, 0.04), and 20q loss, with a peak at q13.13 (66% vs 13%; P < .0001; FDR < 0.0001). Chromosome 20 loss was not observed in any of the 7 primary breast ALK− nALCLs outside of the breast implant context, indicating that this is not a site/organ-specific feature but is implant associated (supplemental Figure 2C).
Next, we studied the CNA profile of BIA-ALCL in relation to pcALCL, ALK+ nALCL, and PTCL-NOS, based on publicly available CNA data from large series (supplemental Table 3).15-18 In pcALCL, ALK+ nALCL, and PTCL-NOS, chromosome 20q loss is a rare finding (9%, 10%, and 4%, respectively) and, therefore, can be considered highly characteristic for BIA-ALCL (all P < .001). In conclusion, partial loss of chromosome 20q provides further genetic justification to recognize BIA-ALCL as a separate disease entity.
Differences between tumor BIA-ALCL and seroma BIA-ALCL
In comparison with tumor BIA-ALCL (n = 16), seroma BIA-ALCL showed a significantly higher copy number load (P = .008) (Figure 2A). Individual seroma BIA-ALCL and tumor BIA-ALCL copy number profiles were marked by noninteger sublevels of CNAs, which are indicative of intratumoral copy number heterogeneity, hence multiple subclones (supplemental Figure 3). A heterogeneity measure (E.v.D., Tom van den Bosch, Kristiaan J. Lenos, Khalid El Makrini, Lisanne E. Nijman, Hendrik F. B. van Essen, Nico Lansu, Michiel Boekhout, Joris H. Hageman, Rebecca C. Fitzgerald, Jurriaan B. Tuynman, Hugo J. G. Snippert, Geert J. P. L. Kops, Jan Paul Medema, B.Y., Louis Vermeulen, and D.M.M., manuscript submitted May 2020) was significantly higher for seroma BIA-ALCL than for tumor BIA-ALCL (P = .002) (Figure 2B). This indicates that the higher copy number load of seroma BIA-ALCL is related to a higher level of subclonal variation with the synchronous presence of multiple subclones in seroma BIA-ALCL, with clonal selection upon infiltration in the breast parenchyma. In contrast, subcentromeric gains at chromosome 20 seem to be exclusively associated with seroma BIA-ALCL (P = .007; FDR, 0.09) (Figure 2C).
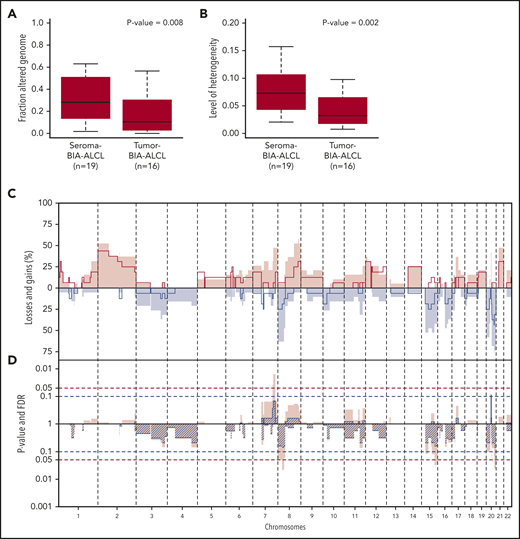
CNA comparison of seroma BIA-ALCL and tumor BIA-ALCL. (A) Box plots of the percentage of the genome gained or lost in seroma BIA-ALCL (average 31%) and tumor BIA-ALCL (average 19%). Seroma BIA-ALCL has a significantly higher copy number load. Significance was calculated using the Wilcoxon rank-sum test for independent samples and paired samples separately, after which a weighted pooled P value was calculated (P = .008) (supplemental Table 2). (B) Heterogeneity of seroma BIA-ALCL (average 0.074) and tumor BIA-ALCL (average 0.041). Seroma BIA-ALCL is significantly more heterogeneous. A Wilcoxon rank-sum test was performed for independent samples and paired samples separately, after which a weighted pooled P value was calculated (P = .002) (supplemental Table 2). (C) Comparison plot for CNAs between seroma BIA-ALCL (filled) and tumor BIA-ALCL (lines). Gains (positive value, red) and losses (negative value, blue) are depicted, which are sorted by chromosomal position (x-axis). (D) Plot of P value calculated with a 2-sided Wilcoxon rank-sum test with 10 000 permutations (pink) and FDR (striped segments) of the difference in CNA frequencies. The horizontal dotted lines show the significance thresholds (red: P < .05; blue: FDR < 0.1). When the difference in CNA level crosses the P value and the FDR level is <0.1, the difference is considered significant. A significant difference is seen for the subcentromeric gain of chromosome 20, which is present in 8 seroma BIA-ALCLs and missing in all tumor BIA-ALCLs. No statistically significant difference was observed for any other region.
CNA comparison of seroma BIA-ALCL and tumor BIA-ALCL. (A) Box plots of the percentage of the genome gained or lost in seroma BIA-ALCL (average 31%) and tumor BIA-ALCL (average 19%). Seroma BIA-ALCL has a significantly higher copy number load. Significance was calculated using the Wilcoxon rank-sum test for independent samples and paired samples separately, after which a weighted pooled P value was calculated (P = .008) (supplemental Table 2). (B) Heterogeneity of seroma BIA-ALCL (average 0.074) and tumor BIA-ALCL (average 0.041). Seroma BIA-ALCL is significantly more heterogeneous. A Wilcoxon rank-sum test was performed for independent samples and paired samples separately, after which a weighted pooled P value was calculated (P = .002) (supplemental Table 2). (C) Comparison plot for CNAs between seroma BIA-ALCL (filled) and tumor BIA-ALCL (lines). Gains (positive value, red) and losses (negative value, blue) are depicted, which are sorted by chromosomal position (x-axis). (D) Plot of P value calculated with a 2-sided Wilcoxon rank-sum test with 10 000 permutations (pink) and FDR (striped segments) of the difference in CNA frequencies. The horizontal dotted lines show the significance thresholds (red: P < .05; blue: FDR < 0.1). When the difference in CNA level crosses the P value and the FDR level is <0.1, the difference is considered significant. A significant difference is seen for the subcentromeric gain of chromosome 20, which is present in 8 seroma BIA-ALCLs and missing in all tumor BIA-ALCLs. No statistically significant difference was observed for any other region.
The mutational landscape of BIA-ALCL
Seven BIA-ALCL tumor and matched normal sample pairs were subjected to WES analysis. Mutations were detected in 400 genes across the 7 patient samples, of which 38 known pathogenic mutations, including STAT3 (n = 2), JAK1, KMT2C, and MEF2A, which were also reported by other investigators5-10 (supplemental Figure 5; supplemental Table 5). Integration of mutation and CNA data show that the JAK1-STAT3 pathway was activated by gain-of-function mutations, as well as by chromosomal amplification (supplemental Figure 5C). Systemic deregulation of the JAK1-STAT3 pathway in BIA-ALCL is further underpinned by strong and uniform expression of phosphorylated STAT3, which is in contrast to a significantly lower and more heterogeneous phosphorylated STAT3 expression pattern within and between tumors in ALK− nALCL (P < .0001) (supplemental Figure 6; supplemental Table 6). Further, combined chromosome 20 loss and mutation of local genes (NFATC2, NEURL2) was observed in 1 case.
Conclusions
We found that BIA-ALCL is characterized by loss of (part of) chromosome 20q and is present in a high percentage of patients, distinguishing this disease from other types of ALCL and PTCL-NOS. This feature may provide a supporting argument in diagnostically equivocal cases, especially in the differential diagnosis with other ALCL subtypes. CNA detection by next-generation sequencing has been shown to be a sensitive method in liquid biopsy analysis,19 whereas routine cytological assessment of seroma aspirates for cytomorphological features and CD30 immunocytology can be difficult to interpret. Therefore, omnipresent CNAs in BIA-ALCL may serve as a basis for a complementary diagnostic assay to differentiate lymphoma-associated seroma fluid from reactive effusions related to infection, trauma, or inflammatory response to implant rupture.20
All shallow WGS and WES data have been deposited in the European Genome-phenome Archive (http://www.ebi.ac.uk/ega/) (accession number EGAS00001003962).
Data sharing requests should be sent to Daphne de Jong (e-mail: d.dejong2@amsterdamumc.nl).
The online version of this article contains a data supplement.
The publication costs of this article were defrayed in part by page charge payment. Therefore, and solely to indicate this fact, this article is hereby marked “advertisement” in accordance with 18 USC section 1734.
Acknowledgments
The authors thank all pathologists, pathology laboratories, and the nationwide histo- and cytopathology registry of The Netherlands for providing tissue materials and data about patients who have been under their care. The authors also thank Yongsoo Kim for advice on WES analysis and Paul P. Eijk and H. (Dirk) F.B. van Essen (Tumor Genomic Analysis Core, Amsterdam UMC) for help and advice with next-generation sequencing experiments. They also thank Titus Lotgering for creating the visual abstract.
This work was supported by Dutch Cancer Society grants KWF 2015-7925, KWF 2015-7882, and KWF 2012-5711.
The funders had no role in the study design, material collection, analysis or interpretation of data, writing of the manuscript, or the decision to submit the manuscript for publication.
Authorship
Contribution: J.P.d.B., H.A.R., F.E.v.L., R.R.W.J.v.d.H., B.Y., and D.d.J. designed the study; G.T.L.-d.V., M.M., P.S., N.J.H., and D.M.M. performed experiments; G.T.L.-d.V., M.d.B., E.v.D., M.G.M.R., B.Y., and D.d.J. analyzed and interpreted the data; G.T.L.-d.V., M.d.B., B.Y., and D.d.J. wrote the manuscript; and all authors critically revised the manuscript and were involved in its editing and gave final approval of the submitted and published versions.
Conflict-of-interest disclosure: The authors declare no competing financial interests.
Correspondence: Daphne de Jong, Amsterdam UMC, Vrije Universiteit Amsterdam, Department of Pathology, Cancer Center Amsterdam, De Boelelaan 1117, 1081 HV Amsterdam, The Netherlands, e-mail: d.dejong2@amsterdamumc.nl.

This feature is available to Subscribers Only
Sign In or Create an Account Close Modal