

Key Points
MIF as a chaperone of SOD1 mediates MM cell resistance to PIs by modulating reactive oxygen species–induced mitochondrial dysfunction.
MIF and SOD1 are potential biomarkers for predicting MM patient response to PIs and promising targets for overcoming MM PI resistance.

Abstract
Multiple myeloma (MM) remains largely incurable despite significant advances in biotherapy and chemotherapy. The development of drug resistance is a major problem in MM management. Macrophage migration inhibitory factor (MIF) expression was significantly higher in purified MM cells from relapsed patients than those with sustained response, and MM patients with high MIF had significantly shorter progression-free survival (PFS) and overall survival (OS). MM cell lines also express high levels of MIF, and knocking out MIF made them more sensitive to proteasome inhibitor (PI)-induced apoptosis not observed with other chemotherapy drugs. Mechanistic studies showed that MIF protects MM cells from PI-induced apoptosis by maintaining mitochondrial function via suppression of superoxide production in response to PIs. Specifically, MIF, in the form of a homotrimer, acts as a chaperone for superoxide dismutase 1 (SOD1) to suppress PI-induced SOD1 misfolding and to maintain SOD1 activity. MIF inhibitor 4-iodo-6-phenylpyrimidine and homotrimer disrupter ebselen, which do not kill MM cells, enhanced PI-induced SOD1 misfolding and loss of function, resulting in significantly more cell death in both cell lines and primary MM cells. More importantly, inhibiting MIF activity in vivo displayed synergistic antitumor activity with PIs and resensitized PI-resistant MM cells to treatment. In support of these findings, gene-profiling data showed a significantly negative correlation between MIF and SOD1 expression and response to PI treatment in patients with MM. This study shows that MIF plays a crucial role in MM sensitivity to PIs and suggests that targeting MIF may be a promising strategy to (re)sensitize MM to the treatment.
Introduction
Multiple myeloma (MM) is a plasma cell cancer characterized by tumor cell accumulation and expansion in the bone marrow (BM).1 It accounts for 1% of all cancers and ∼10% of all hematologic malignancies.2 Patients can develop morbidity due to hypercalcemia, renal insufficiency, anemia, bony lesions, and infections.3 Fortunately, novel chemotherapies, including immune-modifying drugs such as thalidomide and lenalidomide and proteasome inhibitors (PIs) such as bortezomib (Btz) and carfilzomib (Cfz), combined with the traditional treatment regimens dexamethasone and alkylating agent melphalan, have dramatically improved the survival outcomes of patients with MM.3-5
PIs kill MM cells by disrupting the degradation of misfolded proteins, presumably derived from high-level immunoglobulin production, providing an appealing explanation for why MM cells are so uniquely sensitive to PIs.6-8 Endoplasmic reticulum (ER) stress is considered one of the major determinants of PI cytotoxicity.8,9 Oxidative stress, caused by overproduction of intracellular reactive oxygen species (ROS),10 is an important mediator of PI cytotoxicity in MM cells.9 However, despite the proven benefits of PIs, relapses are frequent, and acquired resistance to PI treatment eventually emerges in most, if not all, patients.6,11 Determining the mechanism underlying PI resistance in MM will aid in identifying targets for chemo-(re)sensitization and maximizing the outcomes of PI therapy. Several potential mechanisms of PI resistance in MM have been proposed. They include but are not limited to the “load vs capacity” model that MM cells with a low degradative workload (misfolded proteins) and high proteasomal capacity (cellular proteasome content) are more resistant to PIs,12-15 and metabolic adaptation with amino acid supplementation16,17 or increased mitochondrial energy production.18
We previously showed that macrophage migration inhibitory factor (MIF), a soluble proinflammatory cytokine expressed by various types of cells,19 is highly expressed in MM and regulates MM homing to and staying in the BM.20 Whether MIF directly regulates MM cell intrinsic resistance to chemotherapy has yet to be explored. The current study reports our new finding that MIF plays a pivotal role in human MM cell sensitivity to PI treatment. A series of in vitro and in vivo studies using human MM cell lines and primary MM cells and murine models were performed to elucidate the underlying mechanisms and to explore the translational potential of inhibiting MIF to (re)sensitize human MM cells to PIs and overcome drug resistance. Furthermore, analyses of published human MM transcriptomic and proteomic databases not only establish and validate the role of MIF and its downstream molecules in MM cell sensitivity to PI treatment but also suggest that MIF may be used as a biomarker for predicting patient responses to PI treatment.
Methods
Primary MM cells
This study was approved by the institutional review board at the Houston Methodist Hospital, and all patients provided written informed consent. BM aspirates were obtained from patients newly diagnosed with MM as part of their routine clinical evaluation; patients were asked if they wished to provide informed consent for use of their samples for research purposes. Patient CD138+ MM cells were isolated from BM aspirates by using the EasySep Human Whole Blood and CD138 Positive Selection Kit II (Stemcell Technologies).
Mouse MM models
NOD-scid IL2rgnull (NSG) mice were purchased from The Jackson Laboratory. All of the mouse studies were approved by the Institutional Animal Care and Use Committee of the Houston Methodist Research Institute and the Lerner Research Institute of the Cleveland Clinic.
Methods for transcriptomic analysis, mitochondrial function assay, superoxide dismutase 1 (SOD1) misfolding and activity assay, and mouse studies are provided in the supplemental Methods (available on the Blood Web site).
Results
MIF regulates MM cell sensitivity to PIs
To determine the impact and significance of MIF in human MM pathogenesis and drug response, we downloaded the gene-profiling data of 1143 patients with MM from MMRF CoMMpass study IA13. Our analyses showed that MIF expression was significantly higher in purified MM cells from relapsed patients compared with patients with sustained response (Figure 1A), and MM patients with high MIF expression had significantly shorter progression-free survival (PFS) and overall survival (OS) than those with low MIF expression (Figure 1B-C). Established MM cell lines also expressed higher levels of MIF than normal plasma cells (Figure 1D) and B cells (supplemental Figure 1A). We knocked out MIF in MM cells using a lentivirus containing MIF CRISPR guide RNA plus Cas9 and green fluorescent protein, and selected green fluorescent protein–positive stable cell lines that consistently expressed no MIF (MIF-KO) (supplemental Figure 1B-C). Although knocking out MIF did not affect MM cell viability (supplemental Figure 1D), these cells exhibited lower viability (Figure 1E-H) and more apoptosis (Figure 1I-J) in culture with Btz or Cfz, but not in culture with melphalan or lenalidomide, compared with control MM cells. Similar results were obtained from MIF knockdown experiments using short hairpin RNA (supplemental Figure 1E-F). Consistent with cell apoptosis, MIF-KO MM cells had enhanced expression of cleaved caspases-8, -9, and -3, poly (ADP-ribose) polymerase, and Mcl-121 compared with control knockout (CTR-KO) MM cells treated with Cfz (supplemental Figure 1G). Furthermore, we overexpressed MIF in KMS-12-PE cells22 (supplemental Figure 1H), which had low levels of MIF. MIF-knockin (MIF-KI) KMS-12-PE MM cells exhibited higher cell viability (supplemental Figure 1I-L) and less apoptosis (supplemental Figure 1M-N) in culture with Btz or Cfz, but not in culture with melphalan or lenalidomide, compared with CTR-KI KMS-12-PE MM cells, suggesting that MIF may be involved in MM sensitivity to PIs.
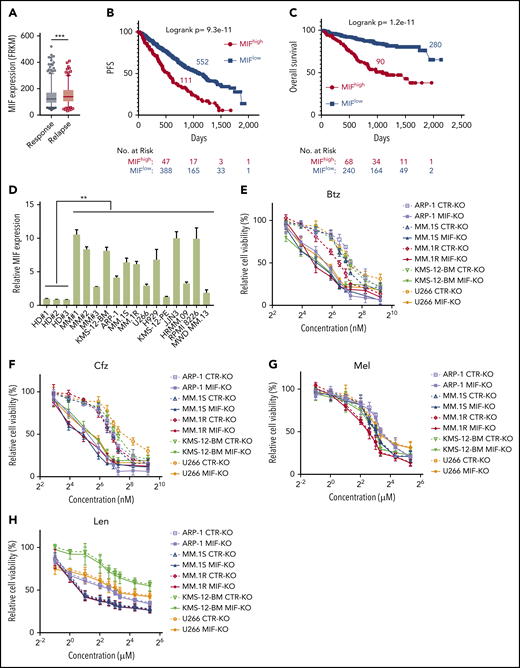
MIF regulates MM cell sensitivity to PIs. (A) Relationship between MIF expression from gene-profiling data of purified human MM cells and MM patient disease status, such as sustained response (Response, n = 375) versus Relapse (n = 184). PFS (B) and OS (C) of MM patients with high MIF (MIFhigh) and low MIF (MIFlow) expression in MMRF CoMMpass study IA13. (D) Relative MIF messenger RNA expression in plasma cells of healthy donor BMs (HD#1-3) or MM patient BMs (MM#1-3) and MM cell lines by quantitative polymerase chain reaction. Cell viability of CTR-KO or MIF-KO MM cell lines with pulse treatment with Btz (E) or Cfz (F) for 1 hour followed by 48 hours of culture in drug-free medium, or with continuous treatment with melphalan (Mel) (G) or lenalidomide (Len) (H) by MTS Assay, significance was analyzed by one-way analysis of variance with Tukey’s post hoc test at each concentration point. Apoptotic rate of CTR-KO or MIF-KO MM cell lines pulsed with 150 nM Btz (I) or 80 nM Cfz (J) for 1 hour and allowed to recover for 24 hours by Annexin V assay; values were normalized to DMSO-treated MM cells. Histogram (K) and summarized results (L) of apoptosis in KMS-11/Cfz or KMS-11 cells with 1 hour of pulse treatment with DMSO or 200 nM Cfz followed by exposure to drug-free medium for 24 hours. (M) Summary of apoptosis analysis of primary MM cells at 24 hours after pulse treatment with 100 nM Cfz. Expression of MIF in primary MM cells determined by flow cytometry for intercellular staining of MIF (n = 8 for each MIFhigh and MIFlow). For panel K, a representative result of 3 independent experiments is shown. The Student t test was used to compare 2 samples. Panels B and C show Kaplan-Meier estimates of PFS and OS with a P value from a log-rank test. *P < .05; **P < .01; ***P < .001. n.s., not significant.
MIF regulates MM cell sensitivity to PIs. (A) Relationship between MIF expression from gene-profiling data of purified human MM cells and MM patient disease status, such as sustained response (Response, n = 375) versus Relapse (n = 184). PFS (B) and OS (C) of MM patients with high MIF (MIFhigh) and low MIF (MIFlow) expression in MMRF CoMMpass study IA13. (D) Relative MIF messenger RNA expression in plasma cells of healthy donor BMs (HD#1-3) or MM patient BMs (MM#1-3) and MM cell lines by quantitative polymerase chain reaction. Cell viability of CTR-KO or MIF-KO MM cell lines with pulse treatment with Btz (E) or Cfz (F) for 1 hour followed by 48 hours of culture in drug-free medium, or with continuous treatment with melphalan (Mel) (G) or lenalidomide (Len) (H) by MTS Assay, significance was analyzed by one-way analysis of variance with Tukey’s post hoc test at each concentration point. Apoptotic rate of CTR-KO or MIF-KO MM cell lines pulsed with 150 nM Btz (I) or 80 nM Cfz (J) for 1 hour and allowed to recover for 24 hours by Annexin V assay; values were normalized to DMSO-treated MM cells. Histogram (K) and summarized results (L) of apoptosis in KMS-11/Cfz or KMS-11 cells with 1 hour of pulse treatment with DMSO or 200 nM Cfz followed by exposure to drug-free medium for 24 hours. (M) Summary of apoptosis analysis of primary MM cells at 24 hours after pulse treatment with 100 nM Cfz. Expression of MIF in primary MM cells determined by flow cytometry for intercellular staining of MIF (n = 8 for each MIFhigh and MIFlow). For panel K, a representative result of 3 independent experiments is shown. The Student t test was used to compare 2 samples. Panels B and C show Kaplan-Meier estimates of PFS and OS with a P value from a log-rank test. *P < .05; **P < .01; ***P < .001. n.s., not significant.
To validate the role of MIF in MM cell response to PIs, we examined published gene-profiling data of wild-type (WT) KAS-6/1 and Cfz-resistant (KAS-6/1 Cfz) MM cells and found elevated MIF expression in KAS-6/1 Cfz cells (supplemental Figure 2A). Higher MIF protein expression was also noted in another Cfz-resistant MM cell line, KMS-11/Cfz,23 compared with WT KMS-11 cells (supplemental Figure 2B-C); knocking out MIF not only sensitized KMS-11/Cfz cells to Cfz but also induced more cell death in WT KMS-11 cells (Figure 1K-L). To examine the expression of MIF in primary MM cells and Cfz response in patients, we developed intracellular MIF staining using CTR-KD and MIF-KD MM cells (supplemental Figure 2D). We analyzed 16 MM patient samples and found that primary MM cells with low MIF expression were more sensitive to Cfz ex vivo than MM cells with high MIF expression (Figure 1M; supplemental Figure 2E-F). Finally, we analyzed the comparative proteomic profiling data of purified MM plasma cells from patients with reduced responses to Btz (less than a very good partial response [VGPR]) vs those with good responses (VGPR/complete response).24 MIF protein expression ranked in the top 6 among all upregulated proteins in patients with less than a VGPR (supplemental Figure 2G). Taken together, these results strongly suggest that MIF plays an important role in MM response to PIs, and high MIF expression in MM cells protects cells from PI-induced cytotoxicity.
MIF protects MM cells against PIs by maintaining mitochondrial function
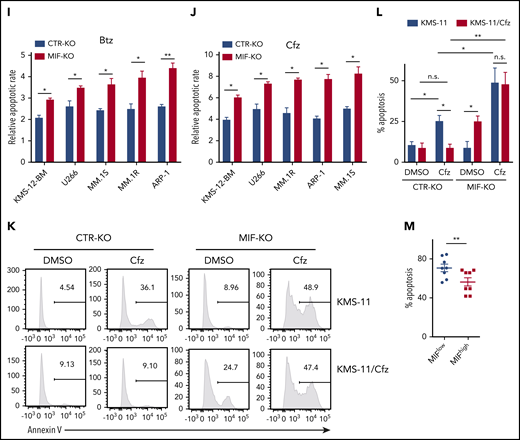
Because PI cytotoxicity in MM cells has been linked to the induction of ER stress,9,14 we first determined whether MIF mediates its effect by reducing PI-induced ER stress in MM cells. We examined the expression of the ER stress proteins ATF4, ATF6, and XBP1s and found that the basal level and Cfz-induced expression of these proteins were similar in MIF-depleting and CTR MM cells (supplemental Figures 1G and 2H); this finding suggests that MIF mediates MM resistance to PIs independently of ER stress. We then performed a microarray and Ingenuity Pathway Analysis designed to generate functional interpretation of microarray data.25 Using the Ingenuity Pathway Analysis Top Tox list tool, we identified a significant enrichment of toxicity-associated gene sets and dysregulated pathways involved in mitochondrial dysfunction, such as decreased mitochondrial membrane potential (Δψm) and mitochondrial biogenesis, in MIF-KO MM cells (Figure 2A). To verify the results, the Δψm was examined in CTR-KO and MIF-KO MM cells using tetramethylrhodamine ethyl ester, which accumulates in the mitochondria via a Δψm-driven process.26 Flow cytometry analysis27-29 of tetramethylrhodamine ethyl ester fluorescence showed that knocking out MIF decreased Δψm in MM cells, and Cfz-treated MM cells exhibited a depolarization of Δψm, which was significantly enhanced by knocking out MIF in MM cells (Figure 2B-C). On the contrary, MIF-KI KMS-12-PE cells displayed a higher Δψm compared with CTR-KI MM cells (supplemental Figure 3A-B). Because mitochondrial function is critical to cellular metabolism,30,31 untargeted metabolomic profiling analyses were performed on Cfz-treated CTR-KO and MIF-KO MM cells (supplemental Figure 3C-D). Among the top 22 upregulated metabolites in MIF-KO MM cells (supplemental Figure 3E), 7 are fatty acid oxidation disorder–related metabolites (Figure 2D-E).
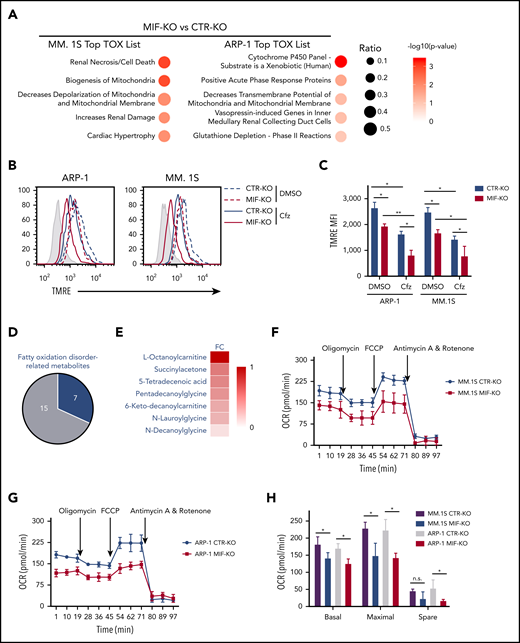
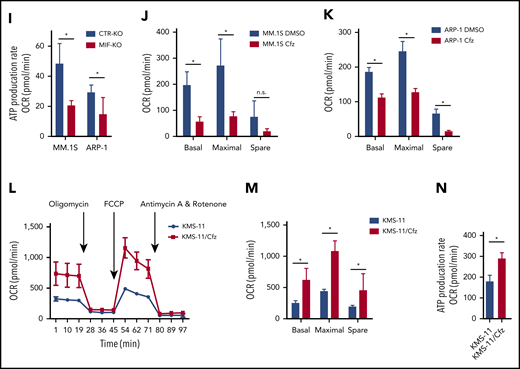
Knocking out MIF exacerbates Cfz-induced mitochondrial dysfunction in MM cells. (A) The top toxicologic and dysregulated cellular pathways predicted by Ingenuity Pathway Analysis based on differentially expressed genes in CTR-KO or MIF-KO ARP-1 or MM.1S MM cells. The circle surface area is proportional to ratio, and the color intensity of circles indicates -log (P value). Flow cytometry histogram (B) and summarized results (C) of the tetramethylrhodamine ethyl ester (TMRE) fluorescence of CTR-KO or MIF-KO ARP-1 or MM.1S MM cells after pulse treatment with DMSO or Cfz for 14 hours. (D) Pie chart showing the percentage of fatty oxidation disorder–related metabolites (blue) among the top 22 upregulated metabolites in Cfz-treated MIF-KO ARP-1 MM cells. (E) Heatmap showing the fold change (FC) of fatty oxidation disorder–related metabolites in Cfz-treated MIF-KO vs CTR-KO ARP-1 MM cells. Oxygen consumption rates (OCRs) for mitochondrial respiration function in CTR-KO or MIF-KO MM.1S (F), ARP-1 (G), KMS-11 or KMS-11/Cfz (L) MM cells were measured by using the Seahorse XF Cell Mito Stress Test, which consists of automated treatment with oligomycin, carbonyl cyanide 4-(trifluoromethoxy) phenylhydrazone (FCCP), and the combination of antimycin A and rotenone at the indicated times using the XF Extracellular Flux Analyzer. Summarized results of basal OCR, maximum OCR, spare OCR (H,M), or ATP production OCR (I,N) are shown for 3 independent replicates as described in panels F, G, and L. Summarized results showing basal OCR, maximum OCR, and spare OCR in DMSO- or Cfz-treated MM.1S (J) or ARP-1 MM (K) cells. For panel B, one representative result of at least 3 independent experiments is shown. The Student t test was used to compare 2 samples. *P < .05; **P < .01. n.s., not significant.
Knocking out MIF exacerbates Cfz-induced mitochondrial dysfunction in MM cells. (A) The top toxicologic and dysregulated cellular pathways predicted by Ingenuity Pathway Analysis based on differentially expressed genes in CTR-KO or MIF-KO ARP-1 or MM.1S MM cells. The circle surface area is proportional to ratio, and the color intensity of circles indicates -log (P value). Flow cytometry histogram (B) and summarized results (C) of the tetramethylrhodamine ethyl ester (TMRE) fluorescence of CTR-KO or MIF-KO ARP-1 or MM.1S MM cells after pulse treatment with DMSO or Cfz for 14 hours. (D) Pie chart showing the percentage of fatty oxidation disorder–related metabolites (blue) among the top 22 upregulated metabolites in Cfz-treated MIF-KO ARP-1 MM cells. (E) Heatmap showing the fold change (FC) of fatty oxidation disorder–related metabolites in Cfz-treated MIF-KO vs CTR-KO ARP-1 MM cells. Oxygen consumption rates (OCRs) for mitochondrial respiration function in CTR-KO or MIF-KO MM.1S (F), ARP-1 (G), KMS-11 or KMS-11/Cfz (L) MM cells were measured by using the Seahorse XF Cell Mito Stress Test, which consists of automated treatment with oligomycin, carbonyl cyanide 4-(trifluoromethoxy) phenylhydrazone (FCCP), and the combination of antimycin A and rotenone at the indicated times using the XF Extracellular Flux Analyzer. Summarized results of basal OCR, maximum OCR, spare OCR (H,M), or ATP production OCR (I,N) are shown for 3 independent replicates as described in panels F, G, and L. Summarized results showing basal OCR, maximum OCR, and spare OCR in DMSO- or Cfz-treated MM.1S (J) or ARP-1 MM (K) cells. For panel B, one representative result of at least 3 independent experiments is shown. The Student t test was used to compare 2 samples. *P < .05; **P < .01. n.s., not significant.
In line with this result, the citrate cycle (tricarboxylic acid cycle) was among the top affected pathways analyzed by using the MetaboAnalyst tool32 (supplemental Figure 3D). Because mitochondrial respiration is tightly coupled with the tricarboxylic acid cycle and fatty acid oxidation for energy production, the most prominent role of mitochondria,33 these results suggest that mitochondrial respiration may be significantly dysregulated in Cfz-treated MIF-KO MM cells. We therefore examined the oxygen consumption rate (OCR) using the Seahorse XF-24 extracellular flux analyzer to assess mitochondrial respiration capacity.34,35 MIF-KO MM cells had a significantly lower basal and maximal mitochondrial respiratory capacity and adenosine triphosphate (ATP) production rate compared with CTR-KO MM cells (Figure 2F-I). In line with these results, Cfz treatment decreased mitochondrial respiration capacity in MM cells (Figure 2J-K). Similarly, MIF-KI KMS-12-PE cells displayed a significantly higher basal and maximal mitochondrial respiratory capacity and ATP production rate than CTR-KI MM cells in culture with DMSO or Cfz (supplemental Figure 3F-H).
Furthermore, mitochondrial ATP concentration, although decreased by Cfz treatment, was higher in high MIF-expressing MM cells (supplemental Figure 3I-K). Interestingly, KMS-11/Cfz MM cells had significantly higher mitochondrial activity than WT KMS-11 cells (Figure 2L-N). In addition, the basal level of mitochondrial Ca2+ concentration [Ca2+]M36 was similar between high and low MIF-expressing MM cells, whereas Cfz treatment induced higher [Ca2+]M in low MIF-expressing MM cells (supplemental Figure 4A-E), which is consistent with the Δψm finding. These findings indicate that elevated [Ca2+]M in Cfz-treated low MIF-expressing MM cells is associated with collapse of Δψm. To determine the regulators of mitochondrial activity, we analyzed the expression of mitochondrial function–related genes such as CYPD, SOD2, and MCU.37 CYPD, which encodes a mitochondrial matrix petidyl-prolyl cis-trans isomerase important for mitochondrial permeability transition and Ca2+ retaining capacity,38,39 was highly expressed in low MIF-expressing MM cells compared with high MIF-expressing MM cells; however, Cfz treatment did not affect CYPD expression on either the messenger RNA or protein level in these cells (supplemental Figure 4F-I). These results show that depletion of MIF exacerbates mitochondrial dysfunction induced by Cfz and suggest that MIF is important for maintaining mitochondrial function in MM cells.
MIF restrains Cfz-induced mitochondrial damage by suppressing the production of superoxide
Using fluorescent confocal microscopy, we examined mitochondrial morphology in CTR-KO and MIF-KO MM cells. In Cfz-treated CTR-KO MM cells, mitochondrial functional damage was readily characterized by loss of the mitochondrial filamentous network and induction of swelling, whereas in Cfz-treated MIF-KO MM cells, the morphologic change was primarily swelling (Figure 3A-B). Because metabolomic analysis indicated that Cfz-treated MIF-KO MM cells were associated with the glutathione metabolism pathway (supplemental Figure 3D) important for protection against oxidative stress,40 and one-half of the top 22 upregulated metabolites in MIF-KO cells were oxidative stress related (Figure 3C-D), we hypothesized that MIF regulates oxidative stress by inhibiting the production of superoxide, which is one of the proximal mitochondrial ROS and contributes to mitochondrial damage.41 We therefore measured the mitochondrial superoxide level using MitoSox red, an oxidant-sensitive fluorescent dye.42 As expected, Cfz treatment resulted in a remarkable increase in mitochondrial ROS levels in low MIF-expressing cells compared with high MIF-expressing KMS-11/Cfz, ARP-1, MM.1S, or MIF-KI KMS-12-PE MM cells (Figure 3E-H; supplemental Figure 4J-K). Furthermore, by using the superoxide-scavenging antioxidant agent N-acetylcysteine,43,44 cell death induced by Cfz in MIF-KO (but not CTR-KO) MM cells was significantly reduced by N-acetylcysteine treatment (Figure 3I-K). Overall, these results indicate that knocking out MIF increases Cfz-induced superoxide production, which results in severe mitochondrial dysfunction and damage and sensitizes MM cells to PI treatment.

Knocking out MIF exacerbates Cfz-induced mitochondrial swelling and superoxide production in MM cells. Confocal immunofluorescent imaging (A) and summarized data (B) showing mitochondrial morphology of CTR-KO or MIF-KO MM.1S or ARP-1 MM cells using MitoTracker Red CMXRos (red) and 4′,6-diamidino-2-phenylindole (blue) staining after DMSO or Cfz treatment of 16 hours. One representative of at least 4 fields is shown. (C) Pie chart showing the percentage of oxidative stress–related metabolites (labeled as red) among the top 22 upregulated metabolites in supplemental Figure 3C. (D) Heatmap showing the fold change (FC) of oxidative stress–related metabolites in Cfz-treated MIF-KO vs CTR-KO ARP-1 MM cells. Flow cytometry histogram (E) and summarized data showing MitoSOX Red fluorescence in CTR-KO or MIF-KO MM.1S (F), ARP-1 (G), or KMS-11/Cfz (H) MM cells after pulse treatment with DMSO or Cfz for 16 hours. CTR-KO or MIF-KO MM.1S or ARP-1 MM cells were pulsed with DMSO or Cfz for 1 hour and cultured in Cfz-free medium without or with N-acetylcysteine (NAC) (N + C) for 24 hours; the apoptotic rates are shown in a flow cytometry histogram (I) and as summarized results (J-K). For panels E and I, one representative result of at least 3 independent experiments is shown. The Student t test was used to compare 2 samples. *P < .05; **P < .01. n.s., not significant.
Knocking out MIF exacerbates Cfz-induced mitochondrial swelling and superoxide production in MM cells. Confocal immunofluorescent imaging (A) and summarized data (B) showing mitochondrial morphology of CTR-KO or MIF-KO MM.1S or ARP-1 MM cells using MitoTracker Red CMXRos (red) and 4′,6-diamidino-2-phenylindole (blue) staining after DMSO or Cfz treatment of 16 hours. One representative of at least 4 fields is shown. (C) Pie chart showing the percentage of oxidative stress–related metabolites (labeled as red) among the top 22 upregulated metabolites in supplemental Figure 3C. (D) Heatmap showing the fold change (FC) of oxidative stress–related metabolites in Cfz-treated MIF-KO vs CTR-KO ARP-1 MM cells. Flow cytometry histogram (E) and summarized data showing MitoSOX Red fluorescence in CTR-KO or MIF-KO MM.1S (F), ARP-1 (G), or KMS-11/Cfz (H) MM cells after pulse treatment with DMSO or Cfz for 16 hours. CTR-KO or MIF-KO MM.1S or ARP-1 MM cells were pulsed with DMSO or Cfz for 1 hour and cultured in Cfz-free medium without or with N-acetylcysteine (NAC) (N + C) for 24 hours; the apoptotic rates are shown in a flow cytometry histogram (I) and as summarized results (J-K). For panels E and I, one representative result of at least 3 independent experiments is shown. The Student t test was used to compare 2 samples. *P < .05; **P < .01. n.s., not significant.
MIF suppresses ROS production by inhibiting SOD1 misfolding and activity
To determine the mechanism underlying MIF regulation of Cfz-induced superoxide production, RNA-sequencing analysis of dimethyl sulfoxide (DMSO)- and Cfz-treated MM cells was performed (supplemental Figure 5A-B). Gene set enrichment analysis identified prominent changes in p53, hypoxia, MTORC1, ROS, interferon-γ, and apoptosis pathways in Cfz-treated MM cells (Figure 4A). By examining the expression of ROS pathway genes in RNA-sequencing data, we found that SRXN1, FTL, GLRX, SOD1, and GSR were the top 5 upregulated genes in Cfz-treated MM cells (Figure 4B). Using quantitative polymerase chain reaction,45 we confirmed that Cfz increased the expressions of SRXN1, FTL, SOD1, and GSR but not GLRX (Figure 4C; supplemental Figure 5C-F). Knocking out MIF did not affect the expression of these 4 genes (Figure 4D; supplemental Figure 5G-I), indicating that MIF does not regulate their expression.
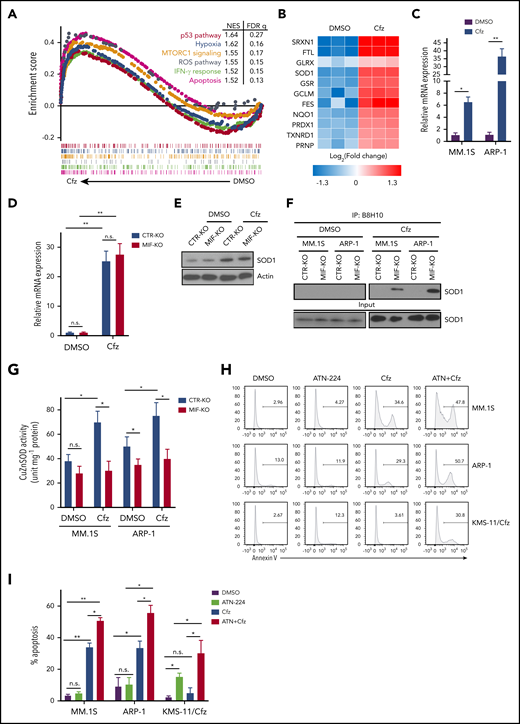
MIF regulates SOD1 folding and activity important for MM response to Cfz. (A) Gene set enrichment analysis of the top 6 representative Hallmark gene sets (with indicated colors) based on the normalized enrichment score (NES) from RNA-sequencing data of Cfz-treated vs DMSO-treated ARP-1 MM cells. (B) Heatmap illustrating the log2-fold change of the top 11 enrichment core genes involved in reactive oxygen species (ROS) pathways. Ratio in messenger RNA (mRNA) expression of SOD1 in MM.1S or ARP-1 MM cells (C), and in CTR-KO or MIF-KO ARP-1 MM cells (D) after DMSO or Cfz treatment of 16 hours. The housekeeping gene GAPDH was used for normalization of the quantitative reverse transcription polymerase chain reaction results. (E) Western blot showing SOD1 expression in CTR-KO or MIF-KO ARP-1 MM cells after DMSO or Cfz treatment of 16 hours. Representative results from 1 of 2 repeated experiments are shown. CTR-KO or MIF-KO MM.1S or ARP-1 MM cells were pulsed with DMSO or Cfz for 1 hour. After 16 hours, misfolded SOD1 (F) was detected by immunoblotting of immunoprecipitates with anti-misfolded SOD1 B8H10 monoclonal antibody, and SOD1 activity (G) was determined by using enzyme-linked immunosorbent assay. Histogram (H) and summarized data (I) showing apoptosis in MM.1S, ARP-1, and KMS-11/Cfz MM cells treated with DMSO, 0.5 μM ATN-224, Cfz, or ATN-224 plus Cfz (ATN+Cfz) for 24 hours. For panel H, 1 representative result of at least 3 independent experiments is shown. The Student t test was used to compare 2 samples. *P < .05; **P < .01. FDR, false discovery rate; n.s., not significant.
MIF regulates SOD1 folding and activity important for MM response to Cfz. (A) Gene set enrichment analysis of the top 6 representative Hallmark gene sets (with indicated colors) based on the normalized enrichment score (NES) from RNA-sequencing data of Cfz-treated vs DMSO-treated ARP-1 MM cells. (B) Heatmap illustrating the log2-fold change of the top 11 enrichment core genes involved in reactive oxygen species (ROS) pathways. Ratio in messenger RNA (mRNA) expression of SOD1 in MM.1S or ARP-1 MM cells (C), and in CTR-KO or MIF-KO ARP-1 MM cells (D) after DMSO or Cfz treatment of 16 hours. The housekeeping gene GAPDH was used for normalization of the quantitative reverse transcription polymerase chain reaction results. (E) Western blot showing SOD1 expression in CTR-KO or MIF-KO ARP-1 MM cells after DMSO or Cfz treatment of 16 hours. Representative results from 1 of 2 repeated experiments are shown. CTR-KO or MIF-KO MM.1S or ARP-1 MM cells were pulsed with DMSO or Cfz for 1 hour. After 16 hours, misfolded SOD1 (F) was detected by immunoblotting of immunoprecipitates with anti-misfolded SOD1 B8H10 monoclonal antibody, and SOD1 activity (G) was determined by using enzyme-linked immunosorbent assay. Histogram (H) and summarized data (I) showing apoptosis in MM.1S, ARP-1, and KMS-11/Cfz MM cells treated with DMSO, 0.5 μM ATN-224, Cfz, or ATN-224 plus Cfz (ATN+Cfz) for 24 hours. For panel H, 1 representative result of at least 3 independent experiments is shown. The Student t test was used to compare 2 samples. *P < .05; **P < .01. FDR, false discovery rate; n.s., not significant.
We were interested in SOD1 because it serves to scavenge cytotoxic superoxide to hydrogen peroxide and dioxygen.46,47 In motor neurons that express extremely low MIF, misfolded mutant SOD1 accumulates and binds to mitochondria, resulting in mitochondrial damage and cell death in patients with familiar amyotrophic lateral sclerosis that can be rescued by WT MIF as a chaperone of SOD1.48,49 We hypothesized that Cfz treatment causes WT SOD1 overexpression, misfolding, and loss of activity in MIF-depleted MM cells, which has never been explored in neurons or tumor cells. To test our hypothesis, we first examined SOD1 protein expression in MM cells. Cfz treatment significantly upregulated SOD1 expression in both CTR-KO and MIF-KO MM cells (Figure 4D-E). However, misfolded SOD1 protein accumulation, detected by immunoprecipitation using the B8H10 monoclonal antibody that recognizes a wide range of misfolded SOD1, including WT and mutants,49-51 was only observed in Cfz-treated MIF-KO MM cells (Figure 4F). We further determined whether WT SOD1 misfolding in Cfz-treated MIF-KO MM cells was associated with a reduced superoxide-scavenging activity. Interestingly, Cfz-treated CTR-KO MM cells displayed enhanced SOD1 activity compared with DMSO-treated CTR-KO MM cells (Figure 4G), which is consistent with upregulated SOD1 expression in Cfz-treated CTR-KO MM cells. SOD1 activity in Cfz-treated MIF-KO MM cells was significantly lower than that of Cfz-treated CTR-KO cells. Furthermore, Cfz-treated WT KMS-11, PI-sensitive primary MM cells, and CTR-KI KMS-12-PE cells all displayed misfolded SOD1 expression and decreased SOD1 activity compared with KMS-11/Cfz (supplemental Figure 6A-B), PI-resistant primary MM cells (supplemental Figure 6C-E), or MIF-KI KMS-12-PE cells (supplemental Figure 6F-G), respectively. Thus, these data indicate that SOD1 misfolding in Cfz-treated MIF-KO MM cells leads to the loss of SOD1 activity.
We also found that misfolded SOD1 was exclusively detected in the cytosol, but not the mitochondria, of Cfz-treated MIF-KO and CTR-KO MM cells, and the level of mitochondrial SOD1 was similar in both cells (supplemental Figure 6H). This finding excludes the possibility that PI-induced mitochondrial damage and cell death are caused by the association of misfolded WT SOD1 to mitochondria. To determine whether SOD1 activity is important for Cfz-induced MM cell apoptosis, the SOD1 inhibitor ATN-224 (ATN) was added to MM cell culture with Cfz. We found that ATN, which alone did not induce apoptosis in MM cells, had an additive effect with Cfz in killing MM cells (Figure 4H-I). Moreover, ATN not only induced apoptosis in KMS-11/Cfz cells but also sensitized KMS-11/Cfz cells to Cfz. Western blot52 revealed that KMS-11/Cfz had higher SOD1 expression than KMS-11 cells (supplemental Figure 6A), suggesting that high MIF and SOD1 expression may be required for inhibiting ROS production and ROS-induced apoptosis in KMS-11/Cfz MM cells.
Homotrimeric MIF inhibits SOD1 misfolding in Cfz-treated MM cells
We next sought to determine whether the ability of MIF to sustain WT SOD1 activity and protect MM cells against Cfz-induced apoptosis depends on its ability to suppress SOD1 misfolding. The thermostable locked-trimeric mutant MIFN110C, which covalently locks MIF into a trimer by forming a disulfide bond with Cys-80 of an adjacent subunit,53 is reported to strongly suppress the formation of misfolded mutant SOD1 in motor neuron cells.54 We infected MIF-KO MM cells with lentivirus expressing WT MIF, mutant MIFN110C, MIFC60S with reduced dimeric and trimeric forms,55 and 3 MIF mutants not thermostable by point mutations (A48P, L46A) or insertions (P107) at the monomer–monomer interfaces.56 In addition, we re-expressed a point-mutated variant of MIF that completely lacks evolutionarily conserved tautomerase (MIFP2A) activities57 in MIF-KO MM cells and treated the cells with Cfz. In MIF-KO MM cells without lentivirus infection or with an empty vector, Cfz treatment induced misfolded SOD1 accumulation (Figure 5A-B). Re-expressing WT and mutant MIFs, especially MIFN110C, significantly reduced the levels of misfolded SOD1 but did not affect the overall level of SOD1 expression in these cells. By contrast, mutant MIFC60S only partially rescued Cfz-induced SOD1 misfolding in MIF-KO MM cells. Furthermore, re-expressing WT and mutant MIFs, but not MIFC60S, increased SOD1 activity, and expressing MIFN110C in Cfz-treated MIF-KO MM cells achieved the highest SOD1 activity (Figure 5C). Cfz-induced apoptosis in MIF-KO MM cells was reversed by expressing WT MIF and mutant MIFs, especially MIFN110C but not MIFC60S (Figure 5D-E), suggesting that the MIF homotrimer, not tautomerase activity, is important for MIF chaperone and SOD1 activities and their cytoprotective effects. To further support this finding, we used the small molecule ebselen, an MIF trimer-disrupting agent.58 As expected, misfolded SOD1 was exclusively detected in MM cells treated with ebselen plus Cfz (Figure 5F). Ebselen treatment decreased SOD1 activity (Figure 5G) and further enhanced superoxide production and apoptosis in Cfz-treated MM cells (Figure 5H-I). The activity of ebselen was validated in primary MM cells (Figure 5J). These findings show that MIF, and especially its homotrimer, play an important role in reducing SOD1 misfolding and superoxide production in Cfz-treated MM cells.
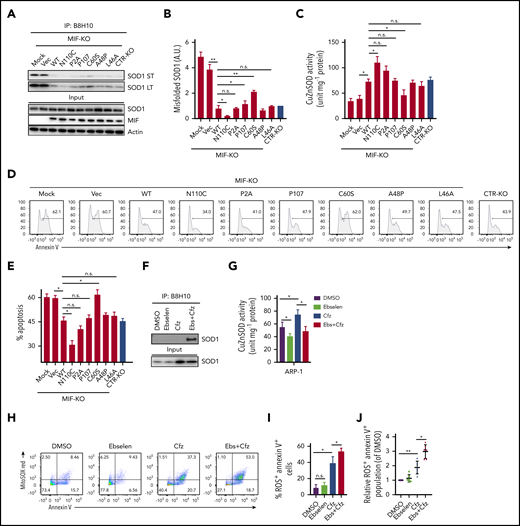
Role of MIF homotrimers in SOD1 folding and activity. MIF-KO ARP-1 MM cells were induced to re-express WT or indicated mutant MIFs or empty vectors (Vec) and treated with Cfz. Cfz-treated MIF-KO ARP-1 MM cells without lentivirus infection served as mock and CTR-KO ARP-1 MM cells treated with Cfz served as a control. (A) Western blot showing the expression of misfolded SOD1, detected by immunoblotting of immunoprecipitates using the B8H10 monoclonal antibody, and total SOD1, MIF, and β-actin. (B) Quantification of relative band density of misfolded SOD1/input SOD1 (n = 3). (C) SOD1 activity detected by using enzyme-linked immunosorbent assay. Cell apoptosis shown as flow cytometry histogram (D) or summarized results (E). ARP-1 MM cells were pulsed with DMSO or Cfz for 1 hour and then treated without or with ebselen (Ebs + Cfz). Misfolded SOD1 expression (F) and SOD1 activity (G) were examined at 16 hours’ posttreatment; the percentage of superoxide+Annexin V+ population in ARP-1 MM cells at 24 hours after treatment are shown by dot plot (H) and summarized results (I). (J) Summarized data showing superoxide+Annexin V+ population in primary MM cells (n = 6) treated with DMSO, 10 μM ebselen, Cfz, or Ebs+Cfz, normalized with DMSO-treated group. For panels D and H, 1 representative result of at least 3 independent experiments is shown. The Student t test was used to compare 2 samples. *P < .05; **P < .01. a.u., arbitrary units; LT, long exposure time; n.s., not significant; ST, short exposure time.
Role of MIF homotrimers in SOD1 folding and activity. MIF-KO ARP-1 MM cells were induced to re-express WT or indicated mutant MIFs or empty vectors (Vec) and treated with Cfz. Cfz-treated MIF-KO ARP-1 MM cells without lentivirus infection served as mock and CTR-KO ARP-1 MM cells treated with Cfz served as a control. (A) Western blot showing the expression of misfolded SOD1, detected by immunoblotting of immunoprecipitates using the B8H10 monoclonal antibody, and total SOD1, MIF, and β-actin. (B) Quantification of relative band density of misfolded SOD1/input SOD1 (n = 3). (C) SOD1 activity detected by using enzyme-linked immunosorbent assay. Cell apoptosis shown as flow cytometry histogram (D) or summarized results (E). ARP-1 MM cells were pulsed with DMSO or Cfz for 1 hour and then treated without or with ebselen (Ebs + Cfz). Misfolded SOD1 expression (F) and SOD1 activity (G) were examined at 16 hours’ posttreatment; the percentage of superoxide+Annexin V+ population in ARP-1 MM cells at 24 hours after treatment are shown by dot plot (H) and summarized results (I). (J) Summarized data showing superoxide+Annexin V+ population in primary MM cells (n = 6) treated with DMSO, 10 μM ebselen, Cfz, or Ebs+Cfz, normalized with DMSO-treated group. For panels D and H, 1 representative result of at least 3 independent experiments is shown. The Student t test was used to compare 2 samples. *P < .05; **P < .01. a.u., arbitrary units; LT, long exposure time; n.s., not significant; ST, short exposure time.
Inhibiting MIF sensitizes human MM cells to PIs
Based on our findings, the translational potential of inhibiting MIF to treat human MM was explored. We used MIF inhibitors (S,R)-3-(4-hydroxyphenyl)-4,5-dihydro-5-isoxazole acetic acid methyl ester (ISO-1) and 4-iodo-6-phenylpyrimidine (4-IPP), which alone do not affect cell viability or induce apoptosis in MM cells. These inhibitors not only promoted Cfz or Btz to kill significantly more MM cells (Figure 6A-B; supplemental Figure 7A) but also resensitized KMS-11/Cfz cells to Cfz treatment (Figure 6C). Moreover, 4-IPP enhanced Cfz-induced apoptosis in primary MM cells (Figure 6D-E). However, MIF-neutralizing monoclonal antibodies59 did not enhance the MM killing effect of Cfz (supplemental Figure 7B-C), indicating a critical role for intracellular MIF in MM cell resistance to Cfz. Mechanistic studies showed that the MIF inhibitor 4-IPP partially decreased mitochondrial respiration and synergized with Cfz to suppress mitochondrial respiration in MM cells (Figure 6F-H), and it increased the accumulation of misfolded SOD1 in Cfz-treated MM cells (Figure 6I); these findings indicate that 4-IPP affects MIF function not by inhibiting its enzymatic activities but by suppressing its chaperone activities. These findings signify that MIF inhibitors promote Cfz-mediated cytotoxicity in MM cells by inducing SOD1 misfolding and mitochondrial dysfunction.
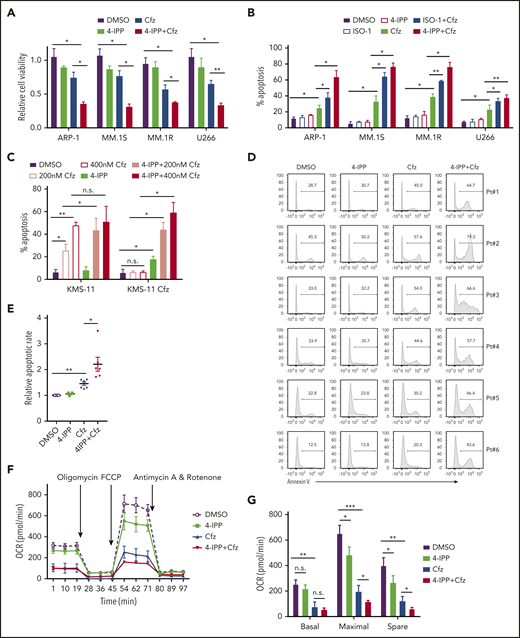
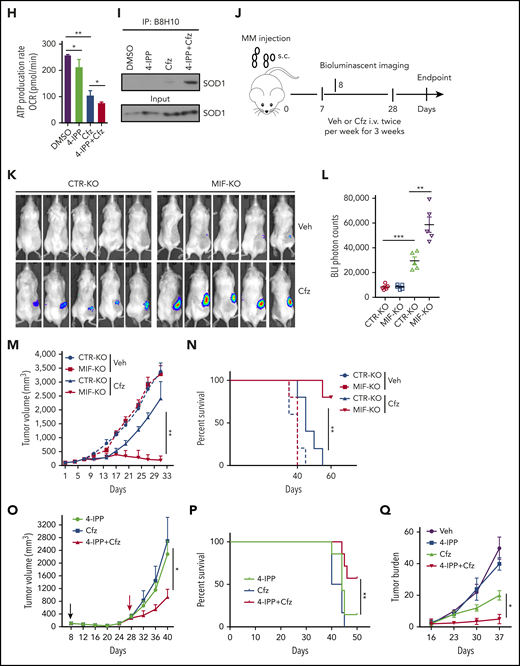
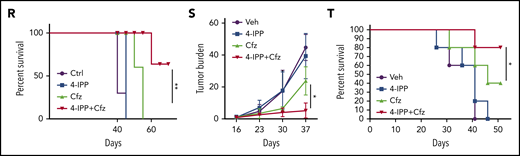
MIF inhibitors sensitize human MM cells to PIs in vitro and in vivo. (A) Cell viability of human MM cell lines pulsed with DMSO or 80 nM Cfz for 1 hour and treated without or with 10 μM 4-IPP (4-IPP+Cfz) for 48 hours, normalized with DMSO-treated group. (B) Summarized results of apoptosis of human MM cell lines at 24 hours after treatment with DMSO, 4-IPP, 10 μM ISO-1, Cfz, 4-IPP+Cfz, or ISO-1+Cfz. (C) Summarized results of apoptotic rates in KMS-11 or KMS-11/Cfz MM cells at 24 hours after treatment with DMSO, 4-IPP, and Cfz at the indicated concentrations, or 4-IPP+Cfz. Flow cytometry histogram (D) and summarized results (E) of apoptotic rates in primary MM cells (n = 6) treated with DMSO, 4-IPP, Cfz, or 4-IPP+Cfz for 24 hours. Mitochondrial respiration (OCR) (F) and summarized results of basal OCR, maximum OCR, spare OCR (G), or ATP production OCR (H) in ARP-1 MM cells treated with DMSO, 4-IPP, Cfz, or 4-IPP+Cfz for 16 hours. (I) Misfolded SOD1 expression in ARP-1 MM cells treated with DMSO, 4-IPP, Cfz, or 4-IPP+Cfz for 16 hours. (J) NSG mice were injected subcutaneously (s.c.) with 2 × 10⁶ CTR-KO or MIF-KO ARP-1 MM cells. At day 7 after tumor inoculation, vehicle (Veh) or 3 mg/kg Cfz were IV injected, 2 consecutive days in a week and repeated for 3 weeks, into MM-bearing mice (n = 5 for each group). At day 8, MM-bearing mice were intraperitoneally (IP) injected with L 012 sodium salt and detected in vivo for ROS signal by bioluminescent imaging (K,L). (M) Tumor volume was calculated from caliper measurements every 3 to 4 days. (N) Survival curves of CTR-KO or MIF-KO MM-bearing mice treated with Veh or Cfz. (O,P) NSG mice were injected s.c. with 2 × 10⁶ ARP-1 MM cells. At day 8 after tumor inoculation, Veh or 1 mg/kg Cfz was IV injected, 2 consecutive days weekly, into MM-bearing mice. At day 28 when the size of some tumors enlarged to 10 mm, MM-bearing mice received treatment with a high dose of Cfz (3 mg/kg for 2 consecutive days weekly; n = 6) or 4-IPP (0.5 mg per mouse for every 3 days; n = 7) alone, or their combinations (n = 6) until the end of the experiment. Tumor volume (O) and survival curves (P) were calculated. (Q-T) NSG mice were injected IV with 2 × 10⁶ MM.1S or ARP-1 MM cells. At day 14 after tumor inoculation, Veh, 4-IPP, Cfz, or 4-IPP+Cfz was injected into MM-bearing mice (n = 5 per group). Blood samples were collected weekly starting at day 16. Tumor burden (Q,S), analyzed by using enzyme-linked immunosorbent assay measuring human immunoglobulin light chain in mouse plasma which was normalized to control, and survival (R,T) in MM.1S or ARP-1 MM-bearing mice were calculated. The Student t test was used to compare 2 samples. Tumor burden was analyzed by one-way analysis of variance with Tukey’s post hoc test at each time point. The survival plots in panels N, P, R, and T show Kaplan-Meier estimates of survival and comparisons using the log-rank test.*P < .05; **P < .01; ***P < .001. n.s., not significant.
MIF inhibitors sensitize human MM cells to PIs in vitro and in vivo. (A) Cell viability of human MM cell lines pulsed with DMSO or 80 nM Cfz for 1 hour and treated without or with 10 μM 4-IPP (4-IPP+Cfz) for 48 hours, normalized with DMSO-treated group. (B) Summarized results of apoptosis of human MM cell lines at 24 hours after treatment with DMSO, 4-IPP, 10 μM ISO-1, Cfz, 4-IPP+Cfz, or ISO-1+Cfz. (C) Summarized results of apoptotic rates in KMS-11 or KMS-11/Cfz MM cells at 24 hours after treatment with DMSO, 4-IPP, and Cfz at the indicated concentrations, or 4-IPP+Cfz. Flow cytometry histogram (D) and summarized results (E) of apoptotic rates in primary MM cells (n = 6) treated with DMSO, 4-IPP, Cfz, or 4-IPP+Cfz for 24 hours. Mitochondrial respiration (OCR) (F) and summarized results of basal OCR, maximum OCR, spare OCR (G), or ATP production OCR (H) in ARP-1 MM cells treated with DMSO, 4-IPP, Cfz, or 4-IPP+Cfz for 16 hours. (I) Misfolded SOD1 expression in ARP-1 MM cells treated with DMSO, 4-IPP, Cfz, or 4-IPP+Cfz for 16 hours. (J) NSG mice were injected subcutaneously (s.c.) with 2 × 10⁶ CTR-KO or MIF-KO ARP-1 MM cells. At day 7 after tumor inoculation, vehicle (Veh) or 3 mg/kg Cfz were IV injected, 2 consecutive days in a week and repeated for 3 weeks, into MM-bearing mice (n = 5 for each group). At day 8, MM-bearing mice were intraperitoneally (IP) injected with L 012 sodium salt and detected in vivo for ROS signal by bioluminescent imaging (K,L). (M) Tumor volume was calculated from caliper measurements every 3 to 4 days. (N) Survival curves of CTR-KO or MIF-KO MM-bearing mice treated with Veh or Cfz. (O,P) NSG mice were injected s.c. with 2 × 10⁶ ARP-1 MM cells. At day 8 after tumor inoculation, Veh or 1 mg/kg Cfz was IV injected, 2 consecutive days weekly, into MM-bearing mice. At day 28 when the size of some tumors enlarged to 10 mm, MM-bearing mice received treatment with a high dose of Cfz (3 mg/kg for 2 consecutive days weekly; n = 6) or 4-IPP (0.5 mg per mouse for every 3 days; n = 7) alone, or their combinations (n = 6) until the end of the experiment. Tumor volume (O) and survival curves (P) were calculated. (Q-T) NSG mice were injected IV with 2 × 10⁶ MM.1S or ARP-1 MM cells. At day 14 after tumor inoculation, Veh, 4-IPP, Cfz, or 4-IPP+Cfz was injected into MM-bearing mice (n = 5 per group). Blood samples were collected weekly starting at day 16. Tumor burden (Q,S), analyzed by using enzyme-linked immunosorbent assay measuring human immunoglobulin light chain in mouse plasma which was normalized to control, and survival (R,T) in MM.1S or ARP-1 MM-bearing mice were calculated. The Student t test was used to compare 2 samples. Tumor burden was analyzed by one-way analysis of variance with Tukey’s post hoc test at each time point. The survival plots in panels N, P, R, and T show Kaplan-Meier estimates of survival and comparisons using the log-rank test.*P < .05; **P < .01; ***P < .001. n.s., not significant.
We next determined whether MIF inhibitors can be used to sensitize human MM to PI treatment in vivo. First, CTR-KO or MIF-KO MM cells were subcutaneously inoculated into NSG mice (Figure 6J). Cfz treatment resulted in a remarkable increase of ROS luminescence60 in MIF-KO tumors compared with CTR-KO tumors (Figure 6K-L), and a greater antitumor response in MIF-KO MM-bearing mice than in CTR-KO MM-bearing mice, measured as tumor volume (Figure 6M) and mouse survival (Figure 6N). Second, to examine whether MIF inhibitors plus Cfz treatment cause SOD1 misfolding and mitochondrial dysfunction in vivo, we sorted CD138+ MM cells from MM-bearing mice treated with vehicle, 4-IPP, Cfz, or their combination. Consistent with in vitro findings, MM cells receiving combinational therapy showed elevated ROS (supplemental Figure 7D-E), reduced Δψm (supplemental Figure 7F-G), SOD1 misfolding (supplemental Figure 7H), and decreased SOD1 activity (supplemental Figure 7I). Third, we examined whether the MIF inhibitor could overcome MM cell resistance to PI treatment in vivo. NSG mice bearing large (∼6 × 7 mm) established MM tumors were treated twice weekly with a low dose of Cfz at day 8 post-inoculation. The tumor volumes were slightly decreased after treatment by day 20, and by day 28, the size of some tumors increased to 10 mm. At that time, treatments were started with a high dose of Cfz or 4-IPP alone, or a combination of the two (supplemental Figure 7J). Interestingly, the combination treatment, not Cfz or 4-IPP alone, significantly slowed tumor growth (Figure 6O) and improved survival (Figure 6P) of mice bearing MM refractory to Cfz. Finally, because MM cells mainly accumulate in the BM, which protects MM from chemotherapy,2,61-63 we established systemic MM xenografts by injecting cells via the tail vein20 (supplemental Figure 7K). In this disseminated IV MM model, although 4-IPP alone had no therapeutic effect in vivo, it significantly enhanced the therapeutic effects of Cfz in suppressing tumor burden and prolonged survival of MM-bearing mice (Figure 6Q-T). Taken together, these results strongly suggest that MIF inhibitors may be used to sensitize human MM to PI treatment and to overcome PI resistance in human patients.
Clinical validation of the role of MIF in PI treatment in MM patients
Based on our findings, we wanted to determine whether MIF and SOD1 expression could be used as biomarkers to identify patients most likely to fail to respond to PI-based therapy. First, we evaluated the MIF expression profile of MM patients who received PIs or PI-containing regimens from the MMRF CoMMpass study IA13. Relapsed patients who had received Btz or Cfz treatment had significantly higher MIF (Figure 7A-B) and SOD1 expression (Figure 7C-D). Microarray profiles from the databases of Mulligan et al64 and Zhan et al65 both showed that SOD1 expression correlated positively with MIF expression in patient MM cells (Figure 7E-F), especially in Btz nonresponders compared with responders (Figure 7G). In the IA13 data sets, a significant linear correlation between SOD1 and MIF expression was observed in patients with Cfz-based therapy but not in the immunomodulatory imide drug–based therapy group (supplemental Figure 8A). Interestingly, in patients treated with Cfz-based regimens, a significant correlation between SOD1 and MIF expression was observed in patients with poor responses (including partial response, stable disease, and progressive disease) but not in patients with good responses (including complete response, stringent complete response, and very good partial response) (supplemental Figure 8B-E).
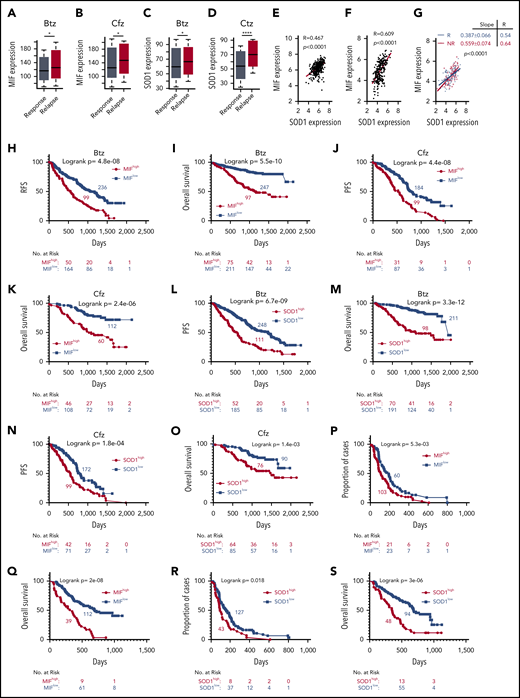
Correlation of MIF and SOD1 expression in purified MM cells with patient outcomes. Gene-profiling data from the MMRF CoMMpass study were analyzed. Box plot showing the relationship between MIF expression and disease status for patients treated with PIs or their combination regimens (panel A for Btz and panel B for Cfz), and the band in the box indicates the median. SOD1 expression in patients with different disease status, sustained response (Response) vs Relapse treated with Btz (242 response and 177 relapsed patients) (C) or Cfz (141 response and 78 relapsed patients) (D). The Wilcoxon test was used for calculating P value. (E-G) Dot plots showing the coexpression patterns of SOD1 and MIF by analyzing the microarray data from Zhan et al65 (E) and Mulligan et al64 (F), or nonresponder (NR) and responder (R) patient data from Mulligan et al (G). Correlations were analyzed by linear regression with R calculated. PFS (H,J) and OS (I,K) curves were evaluated in MM patients treated with PIs (panels H and I for Btz; panels J and K for Cfz) or their combination regimens based on high (red, MIFhigh) or low MIF (blue, MIFlow) expression in MM cells. PFS (L,N) and OS (M,O) of PI-treated patients with high (red, SOD1high) and low (blue, SOD1low) SOD1 expression in MM cells. Curves were plotted by using Kaplan-Meier analysis, and statistical significance was measured by using the log-rank test. Single-agent Btz data were from combined gene-expression sets of the phase 2 and 3 trials in relapsed and/or refractory MM. Time to progression (proportion of progress-free cases) (P,R) and OS (Q,S) after Btz treatment in the combined trial databases were analyzed by using the Kaplan-Meier method based on patients with high (red) or low (blue) MIF (P,Q) or SOD1 expression (R,S) in MM cells. *P < .05; ****P < .0001.
Correlation of MIF and SOD1 expression in purified MM cells with patient outcomes. Gene-profiling data from the MMRF CoMMpass study were analyzed. Box plot showing the relationship between MIF expression and disease status for patients treated with PIs or their combination regimens (panel A for Btz and panel B for Cfz), and the band in the box indicates the median. SOD1 expression in patients with different disease status, sustained response (Response) vs Relapse treated with Btz (242 response and 177 relapsed patients) (C) or Cfz (141 response and 78 relapsed patients) (D). The Wilcoxon test was used for calculating P value. (E-G) Dot plots showing the coexpression patterns of SOD1 and MIF by analyzing the microarray data from Zhan et al65 (E) and Mulligan et al64 (F), or nonresponder (NR) and responder (R) patient data from Mulligan et al (G). Correlations were analyzed by linear regression with R calculated. PFS (H,J) and OS (I,K) curves were evaluated in MM patients treated with PIs (panels H and I for Btz; panels J and K for Cfz) or their combination regimens based on high (red, MIFhigh) or low MIF (blue, MIFlow) expression in MM cells. PFS (L,N) and OS (M,O) of PI-treated patients with high (red, SOD1high) and low (blue, SOD1low) SOD1 expression in MM cells. Curves were plotted by using Kaplan-Meier analysis, and statistical significance was measured by using the log-rank test. Single-agent Btz data were from combined gene-expression sets of the phase 2 and 3 trials in relapsed and/or refractory MM. Time to progression (proportion of progress-free cases) (P,R) and OS (Q,S) after Btz treatment in the combined trial databases were analyzed by using the Kaplan-Meier method based on patients with high (red) or low (blue) MIF (P,Q) or SOD1 expression (R,S) in MM cells. *P < .05; ****P < .0001.
Next, patients with high MIF expression, whether treated with Btz or Cfz or multi-agent regimens containing PIs, reported an inferior PFS and OS (Figure 7H-K). SOD1 expression was also examined, and patients with higher SOD1 expressions had poor outcomes (Figure 7L-O). We therefore returned to the clinically annotated Btz data sets from Mulligan et al64 and analyzed the impact of MIF and SOD1 expression on time to progression, which was the primary end point for the Btz study,5 and OS of patients who received a single-agent Btz. Patients with higher expressions of MIF (Figure 7P-Q) or SOD1 (Figure 7R-S) had shorter time to progression and inferior OS. Taken together, the clinical data clearly indicate that the expression of MIF and SOD1 has a negative and significant impact on patient outcomes with PI therapy and may be used as biomarkers.
Discussion
The current study discovered that MIF is a novel regulator of MM cell response to PIs. Our results clearly show that MM cells expressed high levels of MIF associated with poorer responses to PIs or PI-containing regimens and shorter OS and PFS in patients. Although knockout of MIF in MM cells did not affect MM cell growth and survival, MIF-KO MM cells exhibited enhanced sensitivity to PI treatment. We further showed that MIF inhibited the production of superoxide in Cfz-treated MM cells, and MIF-KO MM cells exhibited accumulation of misfolded SOD1 and decreased superoxide-scavenging activity of SOD1, explaining why PI-treated MIF-KO MM cells displayed more mitochondrial dysfunction and damage. We previously discovered that knocking down MIF in MM cells impairs their ability to remain in the BM protective microenvironment, leading to formation of extramedullary tumors that are more easily eradicated by chemotherapies.20 Therefore, our studies here pave the way for the first substantial improvements in the current treatment of MM by targeting MIF to overcome both MM intrinsic and extrinsic microenvironment-mediated PI resistance.
PIs such as Btz and Cfz have been used extensively in MM treatment and are 2 of the most important chemotherapy drugs for patients.66,67 However, the response rates of Btz-naive patients in refractory and relapsed settings were only 27% and 43%, respectively.6,68 Similarly, the response rate of Cfz in PI-naive patients was 48%,6 indicating an urgent need to identify biomarkers that may predict responses to PI treatment. This will allow triage of patients who are less likely to benefit from PI treatments toward other more effective chemotherapies, thus reducing toxicity, inconvenience, and health care costs.12 Moreover, biomarkers that influence drug sensitivity could be targeted for chemosensitization, thereby maximizing the benefits of therapy in sensitive patients and providing options to overcome drug resistance. The results of this study strongly suggest that MIF may be a promising biomarker for MM response to PI treatment. Moreover, our findings that knocking out MIF or inhibiting MIF by its inhibitors (re)sensitized MM cells, including established cell lines, primary MM cells, and Cfz-resistant MM cells to PI treatment, indicate that MIF may also be a potential and viable therapeutic target for MM treatment.
In this study, we performed mutational analysis of MIF chaperone activity in Cfz-treated MIF-KO MM cells. The trimer-locked53 mutant MIFN110C achieved the best chaperone activity, but mutant MIFC60S, with decreased portion of trimmers,55 had lower chaperone activity than WT MIF. The MIFP107 mutant, which is not thermostable and enzyme-inactive but still forms trimmers, and mutant MIFP2A with defective tautomerase activity,57 had chaperone activity similar to that of WT MIF. These data suggest that the conformation of MIF homotrimers is important for suppressing SOD1 misfolding in Cfz-treated MM cells. Because the cystine residue at position 60 of MIF is reported to be important for Cys-Xaa-Xaa-Cys-based thiol-protein oxidoreductase (TPOR) activity,69 a question is raised of whether the loss of TPOR activity by C60S mutation causes the reduced MIF chaperone activity. Our results showed that ebselen, which disrupts MIF trimers but does not affect TPOR activity, suppressed chaperone activity of WT MIF. Moreover, MIFN110C, which does have normal TPOR activity, expressed better chaperone function. Thus, these data suggest that TPOR activity may not be required for the protective chaperone effect of MIF.
The MIF inhibitors 4-IPP70 and ISO-171 were designed to target the conserved tautomerase activity of MIF, considered as vestigial because its bona fide physiological substrates remain unknown.72 Interestingly, 4-IPP and ISO-1 were found to inhibit MIF-meditated inflammation73 and tumor-promoting effects70 through inhibiting MIF/CD74 signaling independent of tautomerase activity.74 These findings indicate that 4-IPP and ISO-1 binding to the tautomerase domain of MIF triggers conformational changes instead of inhibiting the enzymatic activity of MIF. We report in this study a novel function of 4-IPP for inhibiting MIF chaperone activity, which sensitizes MM cells to PI treatment in vitro and in vivo. Moreover, our previous study showed that 4-IPP led to formation of extramedullary MM tumors that are not protected by the BM microenvironment and were more sensitive to chemotherapy.20 MIF blocking antibodies and inhibitors have been tested in clinic trials for the treatment of solid tumors (clinicaltrials.gov, #NCT01765790) and progressive multiple sclerosis (clinicaltrials.gov, #NCT01982942). Therefore, treating MM by inhibiting MIF may be readily translatable in the clinic. We are conducting further studies to explore the potential of MIF-targeted treatment in human MM.
The microarray data of CTR-KO and MIF-KO MM cells and RNAseq data of MM cells treated with DMSO or Cfz have been deposited into the Gene Expression Omnibus database (accession numbers GSE141170 and GSE143406).
Requests for any materials in this study should be directed to Q.Y. and obtained through a Material Transfer Agreement.
The online version of this article contains a data supplement.
The publication costs of this article were defrayed in part by page charge payment. Therefore, and solely to indicate this fact, this article is hereby marked “advertisement” in accordance with 18 USC section 1734.
Acknowledgments
The authors thank Research Core services in the Lerner Research Institute of the Cleveland Clinic and in the Houston Methodist Research Institute for their support. They also thank Anny Mulya, Department of Cell Biology, Cleveland Clinic, for helpful assistance on seahorse assay.
This work was supported by grants from the National Institutes of Health, National Cancer Institute (R01 CA211073) and the Cancer Prevention & Research Institute of Texas Recruitment of Established Investigator Award (RR180044, Q.Y.), and MMRF Research Fellows Awards (978815400101, Q.W.). Q.Y. and his research group are also supported by National Cancer Institute grants (R01 CA200539, R01 CA214811, and R01 CA239255).
Authorship
Contribution: Q.Y., Q.W., and Z.C. initiated the study; Q.Y. and Q.W. designed the research and wrote the paper; Q.W., Z.W., M.X., E.B., and J.Q. performed experiments; Y.Z. and S.R.P. provided samples; P.S., X.M., M.Y., L.L., K.C., and Z.C. provided critical suggestions; and D.Z. planned and performed the bioinformatics analysis of the clinical microarray and RNA-sequencing data, prepared bioinformatics figures, and wrote the manuscript.
Conflict-of-interest disclosure: The authors declare no competing financial interests.
Correspondence: Qing Yi, Center for Translational Research in Hematological Malignancies, Cancer Center, Houston Methodist Research Institute, Houston, TX 77030; e-mail: qyi@houstonmethodist.org; or Zhen Cai, Bone Marrow Transplantation Center, The First Affiliated Hospital, College of Medicine, Zhejiang University, Hangzhou, 310003 Zhejiang China; e-mail: caiz@zju.edu.cn.

This feature is available to Subscribers Only
Sign In or Create an Account Close Modal