

TO THE EDITOR:
We describe here transdifferentiation of mantle cell lymphoma (MCL) into poorly differentiated sarcoma (Sarc) after immunotherapy with autologous chimeric-antigen receptor T-cells targeting CD19 (CART19). The patient had a 12-year history of MCL with presence of the lymphoma confirmed by lymph node biopsies performed either 2 years prior (early [MCL-E]) or shortly before (late [MCL-L]) CART19 therapy. The patient received multiple therapies including rituximab-hyper cyclophosphamide, vincristine, Adriamycin, and dexamethasone; BTK inhibitor ibrutinib1 ; and finally the CART192 infusion. Two months later, progressive enlargement of left supraclavicular lymph node was noted.
Evaluation of patient’s serum for soluble cytokine/receptors performed at that time failed to identify markers of MCL3,4 (supplemental Table 1, available on the Blood Web site), arguing against recurrence of MCL (supplemental Data). Biopsy of the enlarged lymph node revealed a diffuse infiltrate of medium-sized cells with condensed nuclear chromatin (Figure 1A). These malignant-appearing cells failed to express any markers of lymphoma, either B-cell lineage-specific (supplemental Figure 1) or MCL-associated5 CD5 and cyclin D1 (CCND1; supplemental Figure 2). They were also negative for other markers seen in cells of lymphoid, other hematopoietic, epithelial, or melanocytic origin (supplemental Figures 1 and 2; supplemental Table 2). Unexpectedly, the malignant cells expressed markers indicating muscle differentiation: myogenin and desmin (Figure 1A) and, less prominently, neural differentiation: CD56 (NCAM) and synaptophysin (supplemental Figure 2; supplemental Table 2). They also strongly expressed Ki-67 indicative of high proliferative rate (Figure 1A) and an anti-apoptotic protein BCL-2 (supplemental Figure 2). A diagnosis of Sarc with evidence of muscle and neural differentiation was rendered.
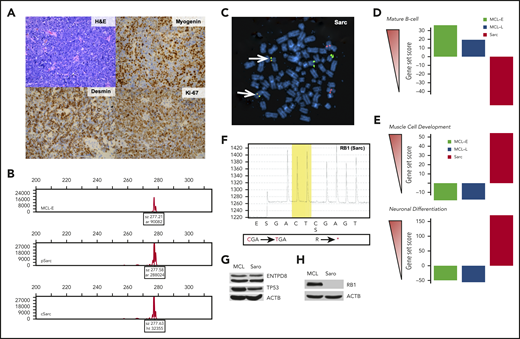
Immunophenotypic, cytogenetic, gene expression, and mutational profiling of Sarc (sarcoma) cells. (A) Morphology (hematoxylin and eosin stain) and immunohistologically detected expression of markers indicative of muscle differentiation (myogenin and desmin). Proliferative rate of the tumor was determined by expression of Ki-67. (B) Clonal rearrangement of immunoglobulin heavy chain (IGH) detected in primary (p) and cultured (c) Sarc cells matching the clonal IGH peak present in the control MCL-E cells. (C) IGH-CCND1 gene fusion (yellowish spots pointed to by arrows) detected in Sarc cells by fluorescence in situ hybridization (FISH). (D) Expression of genes associated with mature B-cell differentiation stage by the depicted cell populations identified by the genomic-scale RNA-Seq analysis. (E) Expression of genes associated with striated muscle (upper) or neuronal (lower) differentiation in the same cell populations detected also by RNA-Seq. (F) Whole-exome sequencing-identified nonsense mutation of RB1 gene confirmed in Sarc cells by pyrosequencing. (G) Loss of expression of the RB1 protein by Sarc cells with MCL-RL cells4 serving as positive control. (H) Expression of the ENTPD8 and TP53 proteins by Sarc cells with MCL-RL cell line4 serving as positive control.
Immunophenotypic, cytogenetic, gene expression, and mutational profiling of Sarc (sarcoma) cells. (A) Morphology (hematoxylin and eosin stain) and immunohistologically detected expression of markers indicative of muscle differentiation (myogenin and desmin). Proliferative rate of the tumor was determined by expression of Ki-67. (B) Clonal rearrangement of immunoglobulin heavy chain (IGH) detected in primary (p) and cultured (c) Sarc cells matching the clonal IGH peak present in the control MCL-E cells. (C) IGH-CCND1 gene fusion (yellowish spots pointed to by arrows) detected in Sarc cells by fluorescence in situ hybridization (FISH). (D) Expression of genes associated with mature B-cell differentiation stage by the depicted cell populations identified by the genomic-scale RNA-Seq analysis. (E) Expression of genes associated with striated muscle (upper) or neuronal (lower) differentiation in the same cell populations detected also by RNA-Seq. (F) Whole-exome sequencing-identified nonsense mutation of RB1 gene confirmed in Sarc cells by pyrosequencing. (G) Loss of expression of the RB1 protein by Sarc cells with MCL-RL cells4 serving as positive control. (H) Expression of the ENTPD8 and TP53 proteins by Sarc cells with MCL-RL cell line4 serving as positive control.
Next, we examined rearrangement of IGH gene in Sarc cells, both primary (pSarc) and a cell line (cSarc), we succeeded in establishing from the primary cells. Strikingly, Sarc displayed IGH gene rearrangement that matched the one in the patient’s MCL (Figure 1B), establishing clonal relationship between the MCL and Sarc. Sarc also contained MCL hallmark5 IGH-CCND1 gene translocation (Figure 1C), detected at 75% cell frequency in pSarc tissue and 95% frequency in cSarc cells and shared with MCL complex karyotype (not shown).
Comparative analysis of genome-wide gene expression profiles of MCL-E, MCL-L, and Sarc with the databases of genes expressed by B lymphocytes at various stages of maturation indicated that MCL-E fit well into a mature B-cell pattern (Figure 1D; supplemental Table 3). Of note, the late stage-disease MCL-L has partially and Sarc has completely lost the mature B-cell gene expression profile. In contrast, Sarc cells expressed numerous genes involved in muscle and neural differentiation (Figure 1E; supplemental Figure 3; supplemental Table 4). The comparative analysis of 1000 most differentially expressed genes by MCL vs Sarc stressed the transitional nature of the MCL-L because it ceased to express many of genes activated in MCL-E and shared a subset of activated genes with Sarc (supplemental Figure 3; supplemental Table 4).
Whole-exome sequencing of the MCL-E, MCL-L, pSarc, and cSarc cells with patients’ normal cells serving as control identified 20 somatic mutations at >40% allelic frequency in both Sarc populations (supplemental Table 5). Noteworthy, 18 of these mutations were also present in MCL-L but not MCL-E, further affirming both the clonal relationship between the MCL and Sarc as well as the lymphoma progression from the MCL-E to MCL-L stage. Among the mutated genes shared by Sarc and MCL-L, RB1 stood out because the RB1 protein is the target of CCND1/CDK4/6 complex.6 We confirmed the RB1 mutation in MCL-L (not shown) and Sarc by gene-specific pyrosequencing (Figure 1F). The identified nonsense mutation (R455*) occurred at >90% frequency indicating loss of the RB1 protein that was experimentally confirmed (Figure 1G). The RB1 loss may have facilitated MCL cell reprogramming by permitting proliferation of the malignant cells independently of CCND1/CDK4/6 complex. The 2 genes mutated only in Sarc were ENTPD8 and TP53 with their protein expression being present (Figure 1H). Although the oncogenic potential of ENTPD8 is unknown, the G266V TP53 mutation is pathogenic.
Genome-scale analysis of DNA methylation in MCL and Sarc cells focused on 24 770 gene promoter-related DNA sequences revealed differential methylation of 12 054 promoter regions (supplemental Table 6) including 547 miR genes (supplemental Table 7). This dramatic shift led in Sarc to DNA methylation (supplemental Table 8) and, hence, silencing of the B-cell lineage genes, in agreement with the loss of B-cell gene expression on messenger RNA (Figure 1D) and protein level (supplemental Figures 1, 2, and 4). In contrast, promoters of many genes involved in muscle- and neural-cell differentiation became demethylated in Sarc and this derepression resulted in their expression (supplemental Table 4).
RNA Sequencing (RNA-Seq) analysis of pSarc cells revealed strong expression of receptors characteristic for nonlymphoid cells and absent in MCL: PDGFbR, NGFR, FGFR1, FGFR2, and TGFbR (STX). Of note, only an FGFR inhibitor was able to inhibit growth of cSarc (Figure 2A). Not surprisingly, inhibitors effective against MCL cells4,7,8 targeting either BTK or CCND1/CDK4/6 complex failed to inhibit growth of cSarc. FGFR inhibition impaired in cSarc activation of phosphatidylinositol 3-kinase (PI3K)-AKT and MEK-ERK signaling pathways as determined by loss of AKT and ERK1/2 phosphorylation (Figure 2B). This phosphorylation loss was recapitulated by PI3K and MEK inhibitors (Figure 2C). Finally, FGFR inhibition triggered in Sarc cells apoptotic cell death, as determined by caspase-3 cleavage (Figure 2D) and DNA fragmentation (Figure 2E).
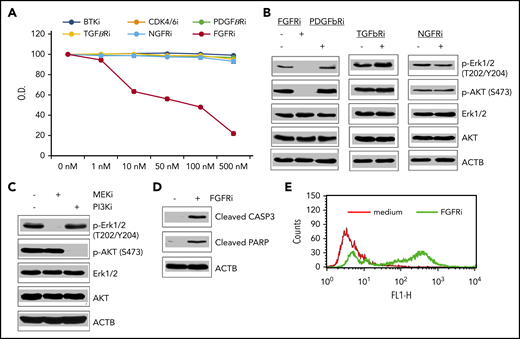
Impact of kinase inhibitors on growth, cell signaling, and survival of Sarc cells. (A) cSarc cells have been exposed to inhibitors (i) of B-cell receptor/BTK-signaling pathway, CCND1-dependent CDK4/6 cell-cycle promoters, or the depicted growth factor receptors and analyzed for cell growth in the MTT conversion assay. (B) Inhibitory effect of FGFR inhibitor on activation of the MEK-ERK and PI3K-AKT signaling pathways using the depicted phospho-specific antibodies. Inhibitors of receptors for PDGF-β, TGF-β, and NGF served as negative controls. (C) Pathway-specific inhibitory effect of the MEK- and PI3K-specific inhibitors on activation of MEK-ERK and PI3K-AKT signaling pathways. (D) FGFR inhibitor-mediated induction of apoptotic cell death as determined by generation of cleaved caspase 3 and PARP. (E) FGFR inhibitor-induced cell death detected by DNA fragmentation (terminal deoxynucleotidyltransferase-mediated dUTP nick end labeling) assay.
Impact of kinase inhibitors on growth, cell signaling, and survival of Sarc cells. (A) cSarc cells have been exposed to inhibitors (i) of B-cell receptor/BTK-signaling pathway, CCND1-dependent CDK4/6 cell-cycle promoters, or the depicted growth factor receptors and analyzed for cell growth in the MTT conversion assay. (B) Inhibitory effect of FGFR inhibitor on activation of the MEK-ERK and PI3K-AKT signaling pathways using the depicted phospho-specific antibodies. Inhibitors of receptors for PDGF-β, TGF-β, and NGF served as negative controls. (C) Pathway-specific inhibitory effect of the MEK- and PI3K-specific inhibitors on activation of MEK-ERK and PI3K-AKT signaling pathways. (D) FGFR inhibitor-mediated induction of apoptotic cell death as determined by generation of cleaved caspase 3 and PARP. (E) FGFR inhibitor-induced cell death detected by DNA fragmentation (terminal deoxynucleotidyltransferase-mediated dUTP nick end labeling) assay.
We report here on transdifferentiation of MCL into a sarcoma with limited muscle and neural differentiation. Whereas progression of MCL from the MCL-E to MCL-L stage was associated with high-allelic-burden mutations of 18 genes, only 2 additional genes became mutated after the MCL-Sarc transdifferentiation. The transdifferentiation was related to massive epigenetic cell reprograming with B-lymphocyte genes gaining promoter DNA methylation and losing expression and genes involved muscle- and neural-cell differentiation becoming derepressed and transcriptionally active in the Sarc cells.
Transdifferentiation of B-cell lymphomas reported previously was limited to lineage switches to other types of immune cells: dendritic,9 histiocytic,10 or Langerhans.11 The underlying molecular mechanisms of the switches remained unknown. Only recently, lineage plasticity of malignant hematopoietic cells begun to be appreciated.12
Antilymphoma therapy likely played a role in promoting transdifferentiation by exerting selective pressure on the malignant cells. Although the CART19 possibly contributed to the process by preventing outgrowth of the CD19+ MCL, it is unlikely that it triggered the transdifferentiation. The resistance to CART19 therapy is mainly based on the loss of CD19 expression.13,14 Although, cell-lineage perturbation leading to loss of CD19 has been observed by plasmablastic differentiation of lymphoma15 and transdifferentiation of leukemic B-cell lymphoblasts to myeloblasts,16 both of these conversions are rather limited in nature, in contrast to the MCL-Sarc transdifferentiation described here.
Novel therapies targeting cell lineage-associated signaling pathways seem to play role in cancer cell reprogramming as seen carcinomas of lung17 and prostate18 transdifferentiating to poorly differentiated neuroendocrine tumors in response to EGFR inhibition and anti-androgen receptor signaling therapy, respectively. The reprograming in lung carcinoma was associated with loss of RB1,17 seen also here in MCL-L and Sarc. Similarly, loss of RB1 and also TP53 mutation (detected here only in Sarc) seems involved in the transdifferentiation of prostatic carcinoma.19,20 Mutations of TP53 may also contribute to plasticity of malignant hematopoietic precursors21 and pluripotent stem cells.22 Epigenomes have not been characterized in any of these cell-reprogramming schemes.
Treatment with BTK inhibitor ibrutinib1 may have indirectly contributed to the MCL-Sarc transdifferentiation by possibly setting a stage for the partial loss of B-cell lineage identity observed in MCL-L cells (supplemental Figure 3). MCL which develop resistance to ibrutinib have very poor prognosis,23 suggesting reprograming in at least some cases. Accordingly, ibrutinib-resistant MCL can express ROR1 promoting its growth independently of BTK.7 Furthermore, ibrutinib-resistant cells reshape their metabolism toward oxidative phosphorylation24 and glutaminolysis8 and frequently display TP53 mutations.25 The identified by us marked loss of B-cell identity and RB1 expression in MCL-L after ibrutinib therapy suggests that BTK inhibition may have, indeed, initiated the MCL reprograming.
Finally, the transdifferentiation led to new signaling pathway dependencies of the malignant cells and, thus, created new therapeutic targets. Identification and understanding of these novel cell vulnerabilities may prove beneficial in selecting appropriate therapies for malignancies in which cell reprograming has occurred.
For original data, please e-mail the corresponding author.
The online version of this article contains a data supplement.
Acknowledgments
This work was supported by grants from National Institutes of Health, National Cancer Institute (R01CA228457), the Berman Family Fund, and funds from the Abramson Cancer Center Translational Center of Excellence in Lymphoma and Fox Chase Cancer Center.
Authorship
Contribution: Q.Z. and M.A.W. designed research; Q.Z., E.J.O., H.Y.W., X.L., S.F.L., H.T.S., S.N.-C., and R.N. performed experiments; A.M.B., P.Z., S.B., and M.A.W. performed diagnostic evaluation of the biopsies; S.J.S. provided clinical care of the patient and facilitated obtaining the patient’s primary cells; Q.Z., E.J.O., H.Y.W., C.W., J.J.M., and M.A.W. analyzed the data; C.H.J. critically reviewed the manuscript; and M.A.W. wrote the manuscript.
Conflict-of-interest disclosure: The authors declare no competing financial interests.
Correspondence: Mariusz A. Wasik, Fox Chase Cancer Center, 333 Cottman Ave, Philadelphia, PA 19111; e-mail: mariusz.wasik@FCCC.edu.

This feature is available to Subscribers Only
Sign In or Create an Account Close Modal