

Key Points
The deficiency of L cells, ISCs, and PCs due to GVHD can be overcome by GLP-2 treatment.
Lower L-cell numbers within the gastrointestinal tract are associated with a poorer outcome for patients suffering from GVHD.

Abstract
Acute graft-versus-host disease (GVHD) is a life-threatening complication after allogeneic hematopoietic cell transplantation (allo-HCT). Although currently used GVHD treatment regimens target the donor immune system, we explored here an approach that aims at protecting and regenerating Paneth cells (PCs) and intestinal stem cells (ISCs). Glucagon-like-peptide-2 (GLP-2) is an enteroendocrine tissue hormone produced by intestinal L cells. We observed that acute GVHD reduced intestinal GLP-2 levels in mice and patients developing GVHD. Treatment with the GLP-2 agonist, teduglutide, reduced de novo acute GVHD and steroid-refractory GVHD, without compromising graft-versus-leukemia (GVL) effects in multiple mouse models. Mechanistically GLP-2 substitution promoted regeneration of PCs and ISCs, which enhanced production of antimicrobial peptides and caused microbiome changes. GLP-2 expanded intestinal organoids and reduced expression of apoptosis-related genes. Low numbers of L cells in intestinal biopsies and high serum levels of GLP-2 were associated with a higher incidence of nonrelapse mortality in patients undergoing allo-HCT. Our findings indicate that L cells are a target of GVHD and that GLP-2–based treatment of acute GVHD restores intestinal homeostasis via an increase of ISCs and PCs without impairing GVL effects. Teduglutide could become a novel combination partner for immunosuppressive GVHD therapy to be tested in clinical trials.
Introduction
Allogeneic hematopoietic cell transplantation (HCT; allo-HCT) is a potentially curative approach for a variety of hematological malignancies. Acute graft-versus-host disease (GVHD) is a common, life-threatening complication after allo-HCT. The incidence of GVHD in allo-HCT remains high, despite the use of prophylactic immunosuppressive medication (reviewed in Zeiser and Blazar1 ). Patients with corticosteroid-refractory (SR) GVHD (SR-GVHD) have a dismal prognosis with a reported 1-year survival rate that ranges between 10% and 38%.1 In contrast to the current SR-GVHD treatment regimens that target the donor immune system using calcineurin inhibitors, antimetabolites (methotrexate and mycophenolate), extracorporeal photopheresis, ruxolitinib,2,3 and others (reviewed in Zeiser and Blazar1 ), here we explored a different approach that aims at protecting and regenerating intestinal stem cells (ISCs) and Paneth cells (PCs).
The endocrine activity of the gastrointestinal tract has tissue-protective and -regenerative function. This function may be impaired when intestinal enteroendocrine cells are damaged in the context of infection or after cytotoxic therapy. L cells residing in the gastrointestinal tract secret glucagon-like peptide 1 (GLP-1) and GLP-2 via the common prohormone proglucagon. GLP-2, a 33 aa is derived from proglucagon through proteolytic cleavage by prohormone convertase 1/3. GLP-2 was shown to have tissue-protective and -regenerative functions4 and to promote mucosal growth, higher crypt depth, higher villi, stronger blood circulation in mesenteric vessels, higher peptide transporter density on enterocytes as well as increased barrier function compared with vehicle-treated controls.5 GLP-2 mediates its effect via direct and indirect action on responsive cells.6 Cells that can respond to GLP-2 include enterocytes, goblet cells, neurons, subepithelial myofibroblasts, endothelial cells, and certain enteroendocrine cells.6 The effects of GLP-2 on cells that are in close proximity in the intestinal tract is intermediated via signaling molecules that are released from the cells that have GLP-2 receptor (GLP-2R) surface expression.6 GLP-2R is a G-protein–coupled receptor and its activation on subepithelial myofibroblasts causes the release of growth factors, including mainly insulin-like growth factor 1 (IGF-1) and IGF-2, keratinocyte growth factor (KGF), epidermal growth factor, and transforming growth factor-β (TGF-β). Via this paracrine effect, GLP-2 can expand different cells within the gut.4,6 To overcome the short half-life of natural GLP-2, a degradation-resistant GLP-2 analog (h[Gly2]-GLP-2) termed teduglutide was developed. Teduglutide was approved for chronic therapy of short bowel syndrome in the United States and Europe based on placebo-controlled phase 3 studies.7 Based on these reported effects, we studied the role of GLP-2 and L cells in acute SR-GVHD. We found that teduglutide treatment reduced acute SR-GVHD–related death and intestinal GVHD histopathology in mice. Protection was connected to the expansion of ISCs and PCs; upregulation of a host-defense gene signature includinglysozyme, Reg3-γ, and defensin-α-4; and changes in the intestinal microbiome. In vitro, GLP-2 expanded intestinal organoids indicating its ISC-promoting effect, whereas apoptosis-inducing mechanisms were reduced. In post–allo-HCT patients, low numbers of L cells in colonic biopsies and high serum levels of GLP-2 were associated with nonrelapse mortality (NRM).
Material and methods
Human data
Correlation of L-cell numbers and GLP-2 serum levels with SR-GVHD patient outcome was performed at the University Medical Center Hamburg-Eppendorf in Germany. Human sample collection and analysis were approved by the institutional ethics review board of the University Medical Center Hamburg (protocol number: PV4085). Detailed information on patient characteristics is shown in supplemental Tables 1 and 2 (available on the Blood Web site). Written informed consent was obtained from each patient. All analysis of human data were carried out in compliance with relevant ethical regulations. Blood, biopsies, and clinical data on GVHD diagnosis, staging, treatment, and response were prospectively collected for all patients according to Mount Sinai Acute GVHD International Consortium (MAGIC) guidelines.8 GVHD-onset blood samples were collected within 72 hours of clinical diagnosis and serum prepared and cryopreserved on the same day.
Statistical analysis of human data
Categorical variables were expressed as frequencies, whereas continuous variables were expressed as medians and ranges. For all analyses, patients still alive were censored at last follow-up. Patients with missing data were excluded from the analysis. Categorical data were compared by the χ2 or Fisher exact test. Continuous variables were compared using the Wilcoxon–Mann-Whitney test. Relapse was considered a competing risk event for NRM. Death and relapse without SR-GVHD were considered competing events for SR-GVHD. All reported P values are 2-sided and values of P < .05 were considered statistically significant. Analysis of incidence of SR-GVHD, NRM, and relapse as competing risks was performed in ACCorD using the Fine and Gray method.9
Mice
BALB/c (H-2Kd) and C57BL/6 (H-2Kb) mice were purchased from Janvier Labs (Le Genest-Saint-Isle, France) or from the local stock of the animal facility at Freiburg University Medical Center, respectively. Mice were housed under specific pathogen-free conditions at the animal facility of the University Medical Center Freiburg and animals were used between 8 and 14 weeks of age; only female or male donor/recipient pairs were used. C57BL/6 (B6)-Irgm1−/− and C57BL/6 (B6)-129P2-Lgr5tm1(cre/ERT2)Cle/J mice were kindly provided by Gregory Taylor (Geriatric Research, Education, and Clinical Center, Durham Veterans Affairs [VA] Medical Center, Durham, NC) and Roland Schüle (Department of Urology, Medical Center University of Freiburg [MCUF], Freiburg, Germany), respectively, and were bred and maintained at the local animal facility at the Freiburg University Medical Center. Animal protocols were approved by the Regierungspräsidium Freiburg Animal Ethics Committee (Freiburg, Germany; Federal Ministry for Nature, Environment and Consumers’ Protection [no. G20-78, G17/063, G18/036 and X15/10A]).
HCT model
The major mismatch strain combinations used were C57BL/6 into BALB/c or BALB/c into C57BL/6 as indicated in the respective experiments. Briefly, recipients were IV injected with 5 × 10⁶ bone marrow (BM) cells after lethal total-body irradiation (TBI) with 10 Gy (BALB/c recipient) or 12 Gy (WT-C57BL/6, Irgm1−/− and Lgr5-EGFPcreER recipients), using a 137Cs source split into 2 equal doses at 4 hours apart. To induce GVHD, CD4 and CD8 T cells were isolated from donor’s spleen and enriched by positive or negative selection using the MACS cell separation system (Miltenyi Biotec) according to the manufacturer’s instructions. Anti-CD4 and anti-CD8 MicroBeads or the Pan T-cell beads were used. CD4+/CD8+ T cell purity was at least 80% as assessed by flow cytometry. CD4+/CD8+ T cells were given IV at a dosage of 0.3 × 10⁶ (BALB/c recipient) or 0.8 × 10⁶ (C57BL/6, Irgm1−/− and Lgr5-EGFPCreER recipients) on day 0 as indicated in the respective experiments.
All other materials and methods are described in supplemental Methods.
Statistical analysis
Data were first checked for normal distribution and similar variance between groups using the Kolmogorov-Smirnov (with Dellal-Wilkinson-Lilie for P value) test. When the data followed a normal distribution, the Student t test (2-sided) was used to compare data between 2 groups. When the data did not follow a normal distribution, the Mann-Whitney U test was used to compare the data between 2 groups. The log-rank (Mantel-Cox) test was applied to compare animal survival curves. The sample size in each experiment represents the number of individual biological animals per group. Statistical analysis was performed using GraphPad Prism software (versions 5.0 and 7.0). Data are presented as mean and standard error of the mean (error bars). Values of P < .05 were considered statistically significant.
Results
GVHD after TBI or chemotherapy depletes L cells and its product GLP-2
To understand whether L cells were target cells of GVHD, we determined their number in the intestinal tract by immunohistochemistry. We observed that GLP-2+ L-cell numbers declined when mice developed acute GVHD (Figure 1A-B). The number of L cells was significantly lower in mice that received allo-HCT compared with syngeneic HCT (syn-HCT) (Figure 1A-B). This indicates that the decrease in L-cell numbers observed was due to GVHD. Because, in the clinical application of allo-HCT, patients often receive chemotherapy prior to transplantation, we also conditioned mice with chemotherapy and then analyzed the number of L cells. We observed that L-cell counts declined in mice developing acute GVHD after chemotherapy conditioning (Figure 1A-B). To determine whether this result was dependent on the mouse strain, we performed the same experiment with BALB/c or C57BL/6 mice (Figure 1B). In agreement with the decline of GLP-2, we also found that Claudin-4 (Cldn-4), a gene expressed by L cells, was reduced in mice that underwent allo-HCT compared with mice that underwent syn-HCT (Figure 1C). To monitor the sensitivity to GLP-2, we also determined the GLP-2R levels. GLP-2R declined after allo-HCT (Figure 1D), indicating that early treatment may be important due to decrease of the receptor expression level over time.
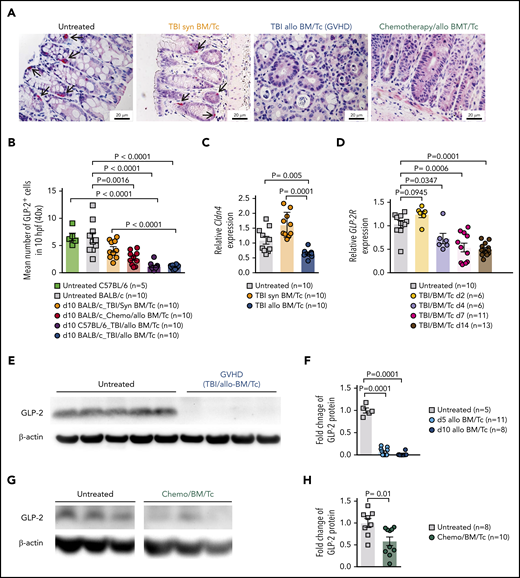
Loss of enteroendocrine L cells and its peptide GLP-2 upon GVHD induction. (A) Representative immunohistochemistry staining for GLP-2 (red) in colon sections. Shown are sections from untreated animals, mice undergoing syn-HCT on day 10, mice undergoing allo-HCT on day 10 and allo-HCT mice on day 10 conditioned with chemotherapy. Scale bars, 20 μm. (B) GLP-2+ cells quantification in untreated C57BL/6 (n = 5), untreated BALB/c mice (n = 10), TBI/syn-HCT BALB/c mice on day 10 (n = 10), chemotherapy/allo-HCT BALB/c mice on day 10 (n = 10), TBI/allo-HCT C57BL/6 mice on day 10 (n = 10) and TBI/allo-HCT BALB/c mice on day 10 (n = 10). Results from 1 or 2 independent experiment(s) are shown. (C) Relative gene expression of the L-cell marker Cldn4 mRNA in the small intestine of untreated BALB/c (n = 10), syn-HCT on day 10 (n = 10), and allo-HCT BALB/c mice on day 5 (n = 10). Gene expression was normalized to β-actin used as reference gene. Results are derived from 2 independent experiments. (D) Relative gene expression of the GLP-2R (receptor) in the large intestine in BALB/c mice under GVHD conditions euthanized at day 2 (n = 6), day 4 (n = 6), day 7 (n = 11), day 14 (n = 13) compared with untreated BALB/c mice (n = 10). Gene expression was normalized to β-actin used as reference gene. Results are derived from 2 independent experiments. (E) Representative western blot showing the GLP-2 protein levels in the small intestine of BALB/c mice undergoing TBI-based allo-HCT on day 10 in comparison with untreated mice. β-actin was used as loading control. (F) Quantification of GLP-2 total protein. Fold change was normalized to the β-actin levels and relative to the untreated controls (set as “1”). Results are from 2 independent experiments at 2 different time points, day 5 (n = 11) and day 10 (n = 8) after allogeneic HCT. (G) Representative western blots from the gastrointestinal tract (colon) of chemotherapy-based allo-HCT BALB/c mice on day 3 in comparison with untreated mice. (H) Quantification of GLP-2 protein levels in chemotherapy-based allo-HCT BALB/c mice (n = 10) vs the untreated group (n = 8). Results are shown from 2 independent experiments. The P values in this figure were calculated using the unpaired, 2-sided Student t test.
Loss of enteroendocrine L cells and its peptide GLP-2 upon GVHD induction. (A) Representative immunohistochemistry staining for GLP-2 (red) in colon sections. Shown are sections from untreated animals, mice undergoing syn-HCT on day 10, mice undergoing allo-HCT on day 10 and allo-HCT mice on day 10 conditioned with chemotherapy. Scale bars, 20 μm. (B) GLP-2+ cells quantification in untreated C57BL/6 (n = 5), untreated BALB/c mice (n = 10), TBI/syn-HCT BALB/c mice on day 10 (n = 10), chemotherapy/allo-HCT BALB/c mice on day 10 (n = 10), TBI/allo-HCT C57BL/6 mice on day 10 (n = 10) and TBI/allo-HCT BALB/c mice on day 10 (n = 10). Results from 1 or 2 independent experiment(s) are shown. (C) Relative gene expression of the L-cell marker Cldn4 mRNA in the small intestine of untreated BALB/c (n = 10), syn-HCT on day 10 (n = 10), and allo-HCT BALB/c mice on day 5 (n = 10). Gene expression was normalized to β-actin used as reference gene. Results are derived from 2 independent experiments. (D) Relative gene expression of the GLP-2R (receptor) in the large intestine in BALB/c mice under GVHD conditions euthanized at day 2 (n = 6), day 4 (n = 6), day 7 (n = 11), day 14 (n = 13) compared with untreated BALB/c mice (n = 10). Gene expression was normalized to β-actin used as reference gene. Results are derived from 2 independent experiments. (E) Representative western blot showing the GLP-2 protein levels in the small intestine of BALB/c mice undergoing TBI-based allo-HCT on day 10 in comparison with untreated mice. β-actin was used as loading control. (F) Quantification of GLP-2 total protein. Fold change was normalized to the β-actin levels and relative to the untreated controls (set as “1”). Results are from 2 independent experiments at 2 different time points, day 5 (n = 11) and day 10 (n = 8) after allogeneic HCT. (G) Representative western blots from the gastrointestinal tract (colon) of chemotherapy-based allo-HCT BALB/c mice on day 3 in comparison with untreated mice. (H) Quantification of GLP-2 protein levels in chemotherapy-based allo-HCT BALB/c mice (n = 10) vs the untreated group (n = 8). Results are shown from 2 independent experiments. The P values in this figure were calculated using the unpaired, 2-sided Student t test.
To validate the IHC results with a second method, we determined GLP-2 protein levels in the gastrointestinal tract of untreated mice or mice undergoing allo-HCT after TBI-based or chemotherapy-based conditioning. We observed that intestinal GLP-2 protein levels were significantly lower in the allo-HCT group compared with the untreated group after TBI-based or chemotherapy-based conditioning and allo-HCT (Figure 1E-H). Our findings indicate that L cells are a target of GVHD.
Teduglutide treatment reduces GVHD severity in acute SR-GVHD
Teduglutide is a GLP-2 analog with an increased stability and longer half-life compared with the natural GLP-2 and was successfully tested in phase 3 trials in patients with short bowel syndrome (SBS). To understand whether GLP-2 treatment was protective, we treated mice from day −3 to +3 relative to allo-HCT. The rationale for this treatment schedule was that upon development of GVHD on days 4 to 14 after transplantation, the GLP-2R levels declined (Figure 1D), suggesting that early prophylactic treatment may have the strongest effects because more GLP-2R+ cells can be reached. Additionally, previous reports showed that R-spondin, which causes intestinal tissue repair, given from day −3 to +3, was protective against GVHD by expanding ISCs.10
We observed that GVHD-related death was lower in mice that received teduglutide (Figure 2A). Consistent with improved survival, the GVHD histopathology scores from target organs were decreased when mice were treated with teduglutide compared with vehicle (Figure 2B). To validate these results, we applied a second GVHD model (C57BL/6 into BALB/c) and found improved survival and reduced histopathology GVHD scores when mice were treated with teduglutide compared with vehicle (Figure 2C-D).
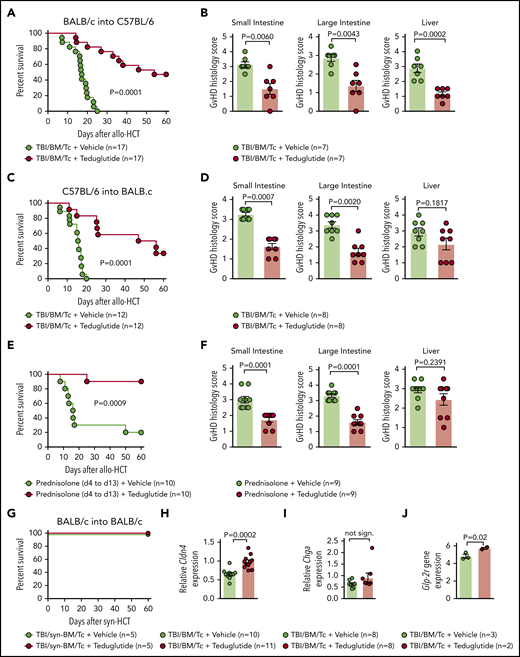
Teduglutide treatment leads to improved survival and reduced histological scores in mice with acute SR-GVHD. (A) Percentage survival of C57BL/6 allo-HCT mice treated with teduglutide or vehicle (n = 17 per group). Mice were treated with teduglutide or vehicle from day −3 until day +3 unless differently specified. Results are derived from 3 independent experiments. P value was calculated using the Mantel-Cox test. (B) GVHD histopathological scores from target organs of allo-HCT C57BL/6 animals on day 10, mice were treated with teduglutide or vehicle (n = 7 per group). Results are derived from 1 experiment. The P values were calculated using a 2-sided Mann-Whitney U test. (C) Percentage survival of allo-HCT BALB/c mice treated with teduglutide or vehicle (n = 12 per group). Results are derived from 2 independent experiments. P value was calculated using the Mantel-Cox test. (D) GVHD histopathological scores from small and large intestine and liver from allo-HCT BALB/c mice on day 10, animals were treated with teduglutide or vehicle (n = 8 per group). Results are derived from 2 independent experiments. The P values were calculated using a 2-sided Mann-Whitney U test. (E) Percentage survival of allo-HCT BALB/c mice treated with vehicle or teduglutide from day −3 to day 3 + prednisolone from day 4 to day 13 (n = 10 per group). Data are derived from 2 independent experiments. P value was calculated using the Mantel-Cox test. (F) Histological GVHD scores from BALB/c mice on day 10, treated as the schedule above described with teduglutide + prednisolone or vehicle + prednisolone (n = 9 per group). Data are derived from 2 independent experiments. The P values were calculated using a 2-sided Mann-Whitney U test. (G) Percentage survival of syn-HCT BALB/c mice treated with teduglutide or vehicle (n = 5 per group). Results are derived from 1 experiment. P value was calculated using the Mantel-Cox test. (H) Relative Cldn4 gene expression in the small intestine of allo-HCT BALB/c mice on day 5, treated with vehicle (n = 10) or teduglutide (n = 11). The P value was calculated using the unpaired, 2-sided Student t test. (I) Relative Chga gene expression in the small intestine of allo-HCT BALB/c mice on day 10, treated with vehicle or teduglutide (n = 8 per group). Data are derived from 2 independent experiments. The P value was calculated using the unpaired, 2-sided Student t test. (J) Glp-2r gene expression from microarray-based analysis from BALB/c mice on day 10 treated with vehicle (n = 3) or teduglutide (n = 2) from day −3 until day +10. Results indicate an increase Glp-2r gene expression in teduglutide-treated mice compared with vehicle-treated animals. The experiment was performed once. Adjusted P = .02.
Teduglutide treatment leads to improved survival and reduced histological scores in mice with acute SR-GVHD. (A) Percentage survival of C57BL/6 allo-HCT mice treated with teduglutide or vehicle (n = 17 per group). Mice were treated with teduglutide or vehicle from day −3 until day +3 unless differently specified. Results are derived from 3 independent experiments. P value was calculated using the Mantel-Cox test. (B) GVHD histopathological scores from target organs of allo-HCT C57BL/6 animals on day 10, mice were treated with teduglutide or vehicle (n = 7 per group). Results are derived from 1 experiment. The P values were calculated using a 2-sided Mann-Whitney U test. (C) Percentage survival of allo-HCT BALB/c mice treated with teduglutide or vehicle (n = 12 per group). Results are derived from 2 independent experiments. P value was calculated using the Mantel-Cox test. (D) GVHD histopathological scores from small and large intestine and liver from allo-HCT BALB/c mice on day 10, animals were treated with teduglutide or vehicle (n = 8 per group). Results are derived from 2 independent experiments. The P values were calculated using a 2-sided Mann-Whitney U test. (E) Percentage survival of allo-HCT BALB/c mice treated with vehicle or teduglutide from day −3 to day 3 + prednisolone from day 4 to day 13 (n = 10 per group). Data are derived from 2 independent experiments. P value was calculated using the Mantel-Cox test. (F) Histological GVHD scores from BALB/c mice on day 10, treated as the schedule above described with teduglutide + prednisolone or vehicle + prednisolone (n = 9 per group). Data are derived from 2 independent experiments. The P values were calculated using a 2-sided Mann-Whitney U test. (G) Percentage survival of syn-HCT BALB/c mice treated with teduglutide or vehicle (n = 5 per group). Results are derived from 1 experiment. P value was calculated using the Mantel-Cox test. (H) Relative Cldn4 gene expression in the small intestine of allo-HCT BALB/c mice on day 5, treated with vehicle (n = 10) or teduglutide (n = 11). The P value was calculated using the unpaired, 2-sided Student t test. (I) Relative Chga gene expression in the small intestine of allo-HCT BALB/c mice on day 10, treated with vehicle or teduglutide (n = 8 per group). Data are derived from 2 independent experiments. The P value was calculated using the unpaired, 2-sided Student t test. (J) Glp-2r gene expression from microarray-based analysis from BALB/c mice on day 10 treated with vehicle (n = 3) or teduglutide (n = 2) from day −3 until day +10. Results indicate an increase Glp-2r gene expression in teduglutide-treated mice compared with vehicle-treated animals. The experiment was performed once. Adjusted P = .02.
To understand whether prophylactic treatment with teduglutide impacts the risk of mice developing SR-GVHD, we next treated mice with teduglutide and prednisolone (2 mg/kg body weight). We found that the teduglutide/prednisolone group exhibited an improved survival compared with the vehicle/prednisolone group (Figure 2E). Analysis of the small bowel and large bowel showed that the teduglutide-treated mice had less severe acute GVHD compared with the vehicle group (Figure 2F).
Teduglutide itself was not toxic as mice undergoing syn-HCT survived 100% when treated with teduglutide (Figure 2G). Consistent with a protective effect of the teduglutide treatment on the L cells themselves, we observed that Cldn-4 expression was higher in teduglutide-treated animals vs controls (Figure 2H). Chromogranin A(Chga) expression in the intestines was not different in the teduglutide treatment group compared with vehicle treatment group (Figure 2I). Conversely, we observed increased Glp-2r expression in the intestines of mice treated with teduglutide compared with the vehicle group when animals were treated from day −3 until day +10 (Figure 2J). These findings indicate that treatment with teduglutide reduces acute SR-GVHD severity in vivo.
Teduglutide treatment reduces GVHD-induced loss of PCs
PCs are a target of GVHD and because GLP-2 may affect PC survival, we tested whether treatment of mice developing GVHD with teduglutide would protect this cell type. We observed that the abundance of lysozyme+ PCs declined upon GVHD induction, and that PC loss could be rescued when mice were treated with teduglutide (Figure 3A-B). In agreement with that finding, the RNA levels of the PC markers lysozyme, Reg3γ, and Defα4 increased upon teduglutide treatment (Figure 3C-E). Gene-expression profiling of day 10 in small intestine isolated from mice treated from day −3 to +10 showed a clear separation of the teduglutide group from the vehicle group (Figure 3F), and an increase of genes related to defense response to gram-positive bacterium like α-defensins (Defα) and lysozyme (Figure 3G). We performed the treatment until day 10 for the gene-expression analysis because the gastrointestinal samples were collected and analyzed on day 10. These findings indicate that the loss of PCs during GVHD can be partially compensated by exogenous GLP-2 substitution, which leads to an increase of the cell type itself as well as multiple antimicrobial factors such as lysozyme and α-defensins.
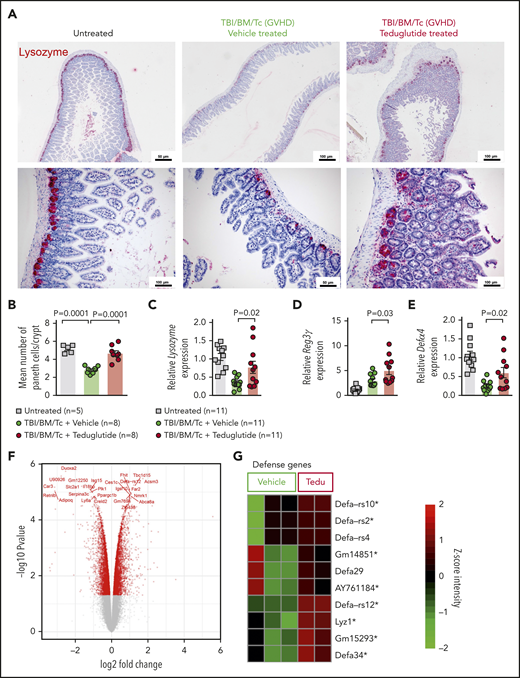
Teduglutide treatment prevents PCs loss caused by GVHD in mice. (A) Representative immunohistochemistry staining for the PC marker, lysozyme (red), in small intestine from allo-HCT BALB/c mice on day 10. Mice treated with vehicle or teduglutide were compared with untreated controls. Mice were treated with teduglutide or vehicle from day −3 until day +3 unless differently specified. Scale bars, 50 to 100 μm. (B) Quantification of PCs/crypt of untreated BALB/c mice (n = 5) or from allo-HCT BALB/c mice on day 10 treated with vehicle or teduglutide (n = 8 per group). Results were pooled from 2 independent experiments. The P values were calculated using the unpaired, 2-sided Student t test. (C-E) qPCR-based quantification of lysozyme, Reg3γ, and Defα-4 expression in small intestine from untreated or allo-HCT BALB/c mice on day 5 treated with vehicle or teduglutide (n = 11 per group). Data were pooled from 2 independent experiments. The P values were calculated using the unpaired, 2-sided Student t test. (F) Volcano plot shows the top 25 regulated genes in BALB/c mice with GVHD on day 10 post–allo-HCT that were treated with teduglutide from day −3 to day +10 and relative to the vehicle-treated group. The experiment was performed once. (G) Gene-expression array indicates the top 10 positive regulated genes involved in response to gram-positive bacterium within the teduglutide-treated mice in comparison with the GVHD group. Mice were treated with teduglutide or vehicle from day −3 to day +10. The experiment was performed once. *Nonadjusted value of P < .05.
Teduglutide treatment prevents PCs loss caused by GVHD in mice. (A) Representative immunohistochemistry staining for the PC marker, lysozyme (red), in small intestine from allo-HCT BALB/c mice on day 10. Mice treated with vehicle or teduglutide were compared with untreated controls. Mice were treated with teduglutide or vehicle from day −3 until day +3 unless differently specified. Scale bars, 50 to 100 μm. (B) Quantification of PCs/crypt of untreated BALB/c mice (n = 5) or from allo-HCT BALB/c mice on day 10 treated with vehicle or teduglutide (n = 8 per group). Results were pooled from 2 independent experiments. The P values were calculated using the unpaired, 2-sided Student t test. (C-E) qPCR-based quantification of lysozyme, Reg3γ, and Defα-4 expression in small intestine from untreated or allo-HCT BALB/c mice on day 5 treated with vehicle or teduglutide (n = 11 per group). Data were pooled from 2 independent experiments. The P values were calculated using the unpaired, 2-sided Student t test. (F) Volcano plot shows the top 25 regulated genes in BALB/c mice with GVHD on day 10 post–allo-HCT that were treated with teduglutide from day −3 to day +10 and relative to the vehicle-treated group. The experiment was performed once. (G) Gene-expression array indicates the top 10 positive regulated genes involved in response to gram-positive bacterium within the teduglutide-treated mice in comparison with the GVHD group. Mice were treated with teduglutide or vehicle from day −3 to day +10. The experiment was performed once. *Nonadjusted value of P < .05.
Teduglutide treatment modulates intestinal microbiome diversity during GVHD
Based on the increase of PCs upon GLP-2 treatment and because PCs influence the composition of the intestinal microbiome via the production of antimicrobial peptides, we next studied the day 5 intestinal microbiome diversity and composition in mice developing GVHD when allo-HCT recipients were treated with vehicle or teduglutide. The microbiome composition of the 3 groups (untreated, TBI/BM/T cells/vehicle and TBI/BM/T cells/teduglutide) was clearly separated from each other (Figure 4A). Because patients who developed GVHD harbored more Firmicutes,11 we analyzed the relative abundance of different Firmicutes including Flintibacter and observed that it increased upon GVHD induction but declined when mice were treated with teduglutide (Figure 4B). Conversely, a decline of the relative abundance of unclassified Bacteroidales was shown to be connected to GVHD.11,12 We observed that the relative abundance of unclassified Bacteroidales decreased in mice developing GVHD, whereas it increased in mice treated with teduglutide (Figure 4C). To understand whether the changes in the microbiome were functionally connected to the effects of teduglutide, we next analyzed GVHD-related death when the microbiome diversity was disturbed by broad-spectrum antibiotic treatment (metronidazole, gentamicin, neomycin, and cefoxitin) described previously.13 We observed that mice treated with teduglutide and antibiotics were less protected compared with mice treated with teduglutide alone (Figure 4D). These findings indicate that teduglutide treatment leads to changes in the intestinal microbiome with an increase of the relative abundance of unclassified Bacteroidales. Intestinal interferon signaling was shown to be an indicator of bacterial translocation in different barrier cells including intestinal epithelial cells.14 Consistent with the protective effect of GLP-2 on intestinal integrity, we found that teduglutide reduced the expression of multiple interferon-related genes in the intestinal tract (Figure 4E).
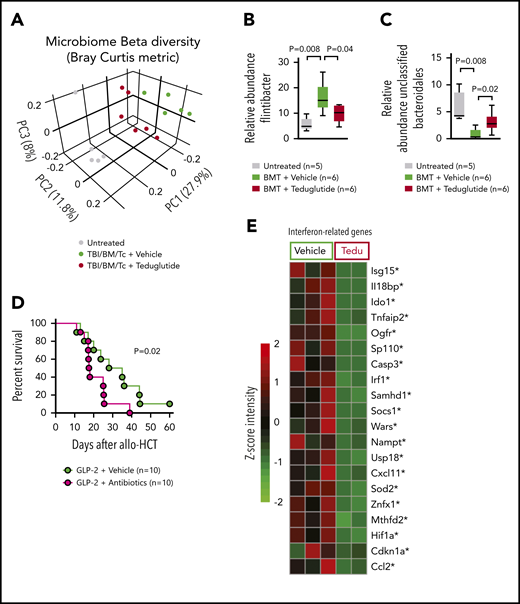
GVHD and antibiotic treatment promote gastrointestinal dysbiosis. (A) The Bray-Curtis metric test shows the dissimilarity of the microbiome β diversity between the 3 groups (untreated, vehicle-treated, and teduglutide-treated mice). Stool samples from colon were isolated on day 5 after allo-HCT from BALB/c mice. Mice were treated with teduglutide or vehicle from day −3 until day +3 unless differently specified. Representative data from 2 independent experiments. (B-C) Relative abundance of specific bacteria at the genus level. Increased Firmicutes bacterial load has been associated with GVHD. We observed an upregulation of Flintibacter bacteria (belonging to the Firmicutes phylum) in the BALB/c allo-HCT vehicle-treated group (n = 6), and those decline after teduglutide treatment (n = 6). On the other hand, the loss of unclassified Bacteroidales due to GVHD was compensated by the treatment with teduglutide (n = 6 per group). Representative data from 2 independent experiments. The P values were calculated using a 2-sided Mann-Whitney U test. (D) Percentage survival of C57BL/6 mice undergoing allo-HCT treated with teduglutide from day −3 to day 3 + broad spectrum antibiotics or normal water (vehicle) from day −14 to day −1 (n = 10 per group). Data are derived from 2 independent experiments. P value was calculated using the Mantel-Cox test. (E) Gene expression of interferon-related genes in the intestinal tract of BALB/c mice treated from day −3 until day 10 with teduglutide compared with mice treated with vehicle. *Nonadjusted value of P < .05. The experiment was performed once.
GVHD and antibiotic treatment promote gastrointestinal dysbiosis. (A) The Bray-Curtis metric test shows the dissimilarity of the microbiome β diversity between the 3 groups (untreated, vehicle-treated, and teduglutide-treated mice). Stool samples from colon were isolated on day 5 after allo-HCT from BALB/c mice. Mice were treated with teduglutide or vehicle from day −3 until day +3 unless differently specified. Representative data from 2 independent experiments. (B-C) Relative abundance of specific bacteria at the genus level. Increased Firmicutes bacterial load has been associated with GVHD. We observed an upregulation of Flintibacter bacteria (belonging to the Firmicutes phylum) in the BALB/c allo-HCT vehicle-treated group (n = 6), and those decline after teduglutide treatment (n = 6). On the other hand, the loss of unclassified Bacteroidales due to GVHD was compensated by the treatment with teduglutide (n = 6 per group). Representative data from 2 independent experiments. The P values were calculated using a 2-sided Mann-Whitney U test. (D) Percentage survival of C57BL/6 mice undergoing allo-HCT treated with teduglutide from day −3 to day 3 + broad spectrum antibiotics or normal water (vehicle) from day −14 to day −1 (n = 10 per group). Data are derived from 2 independent experiments. P value was calculated using the Mantel-Cox test. (E) Gene expression of interferon-related genes in the intestinal tract of BALB/c mice treated from day −3 until day 10 with teduglutide compared with mice treated with vehicle. *Nonadjusted value of P < .05. The experiment was performed once.
Teduglutide treatment promotes ISC expansion and KGF production
We studied the effect of teduglutide on KGF-expression levels in the intestinal tract after GVHD induction. Microarray-based analysis from the small intestine showed increased KGF expression and multiple growth factors being upregulated in GVHD mice treated from days −3 to +10 with teduglutide (Figure 5A). Mice developing GVHD exhibited decreased KGF expression in the small intestine, consistent with tissue damage due to GVHD (Figure 5B). KGF expression increased in mice developing GVHD and being treated with teduglutide (Figure 5B). To better understand, in a well-controlled system, whether teduglutide would impact intestinal growth, we used an intestinal organoid model.15 We observed that teduglutide promoted intestinal organoid growth (Figure 5C-D). To test our hypothesis that protection from GVHD was via expansion of ISCs, we next performed allo-HCT using the reporter mice B6-Lgr5-EGFPcreER followed by immunofluorescent staining to increase the green fluorescent protein signal and analyzed the slides using a confocal microscope. We observed that the number of Lgr5+ ISCs decreased during GVHD and this effect can be prevented by teduglutide treatment (Figure 5E-F). In agreement with these results, we analyzed, by quantitative polymerase chain reaction (qPCR), the expression of the stem cell marker olfactomedin 4 (Olfm4). We observed that Olfm4 increased in mice developing GVHD upon teduglutide treatment compared with the vehicle-treated mice (Figure 5G). Additionally, the stem cell marker prominin-1 (Prom1) increased in mice developing GVHD upon teduglutide treatment compared with the vehicle-treated mice (Figure 5H). To study the effect of teduglutide treatment in an unbiased fashion, we submitted RNA isolated from the intestinal tract to microarray-based analysis. We found multiple ISC markers to be upregulated in the teduglutide-treated group compared with the vehicle-treated mice (Figure 5I). These findings indicate that teduglutide leads to an increase of ISC numbers and the expression of ISC markers during GVHD.
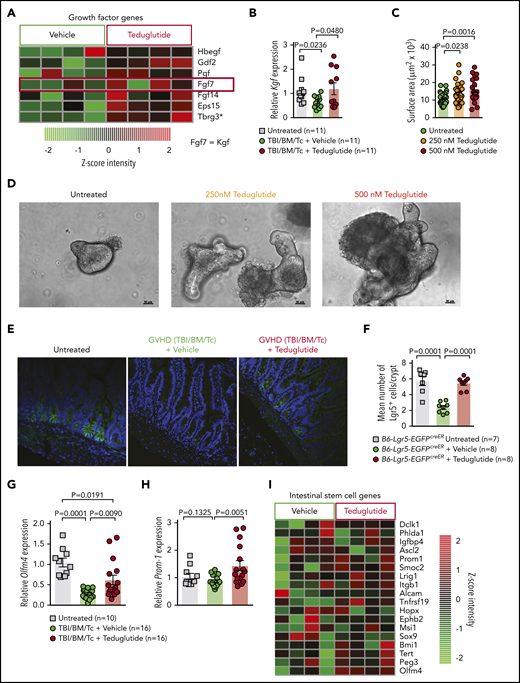
Teduglutide treatment promotes KGF production and protects ISCs from GVHD. (A) Gene-expression array from BALB/c mice treated with teduglutide or vehicle from day −3 to day 10 shows increased expression of different growth factors, one of them is KGF (FGF7) in the teduglutide-treated mice in comparison with the control mice. Results are shown from 1 experiment. *Nonadjusted value of P < .05. (B) Relative expression of KGF analyzed on day 5 in the small intestine of BALB/c allo-HCT mice treated with teduglutide or vehicle compared with the untreated control mice (n = 11 per group). Mice were treated with teduglutide or vehicle from day −3 until day +3 unless differently specified. Results are shown from 2 independent experiments. The P values were calculated using the unpaired, 2-sided Student t test. (C) Quantification of primary intestinal organoids that were cultured for 2 days with different teduglutide concentrations reveals an increased surface area in the wells treated with 250 and 500 nM teduglutide when compared with the untreated cells. Results are shown from 2 independent experiments. The P values were calculated using the unpaired, 2-sided Student t test. (D) Representative microscopy images of mouse primary intestinal organoids. Figures indicate crypt cell proliferation in a dose-dependent manner upon teduglutide treatment in contrast to the untreated cells. Results are shown from 2 independent experiments. Scale bars, 50 µm. (E) Representative immunofluorescence stain images stained for Lgr5+ GFP-ISCs (green) taken on day 6 from allo-HCT B6-Lgr5-EGFPcreER reporter mice that were treated with vehicle or teduglutide from day −3 to day 3. Images indicate reduced Lgr5+ cells in mice with GVHD in comparison with the untreated control mice. In contrast, the teduglutide-treated mice exhibit an enhanced number of Lgr5+ cells during GVHD. (F) Quantification of Lgr5+ cells/crypt of untreated B6-Lgr5-EGFPcreER (n = 7) or B6-Lgr5-EGFPcreER mice that underwent allo-HCT and were treated with teduglutide or vehicle (n = 8 per group). Teduglutide treatment protects ISCs from their loss due to GVHD. Results are shown from 2 independent experiments. The P values were calculated using the unpaired, 2-sided Student t test. (G-H) qPCR-based quantification of the ISC markers Olfm4 and Prom-1 expression in small intestine from untreated (n = 10) or allo-HCT BALB/c mice on day 5 treated with vehicle or teduglutide (n = 16 per group). Data were pooled from 2 independent experiments. The P values were calculated using the unpaired, 2-sided Student t test. (I) Gene-expression array of ISC markers analyzed on day 10 from the small intestine of allo-HCT BALB/c mice treated with teduglutide or vehicle from day −3 to day 10. Experiment was performed once.
Teduglutide treatment promotes KGF production and protects ISCs from GVHD. (A) Gene-expression array from BALB/c mice treated with teduglutide or vehicle from day −3 to day 10 shows increased expression of different growth factors, one of them is KGF (FGF7) in the teduglutide-treated mice in comparison with the control mice. Results are shown from 1 experiment. *Nonadjusted value of P < .05. (B) Relative expression of KGF analyzed on day 5 in the small intestine of BALB/c allo-HCT mice treated with teduglutide or vehicle compared with the untreated control mice (n = 11 per group). Mice were treated with teduglutide or vehicle from day −3 until day +3 unless differently specified. Results are shown from 2 independent experiments. The P values were calculated using the unpaired, 2-sided Student t test. (C) Quantification of primary intestinal organoids that were cultured for 2 days with different teduglutide concentrations reveals an increased surface area in the wells treated with 250 and 500 nM teduglutide when compared with the untreated cells. Results are shown from 2 independent experiments. The P values were calculated using the unpaired, 2-sided Student t test. (D) Representative microscopy images of mouse primary intestinal organoids. Figures indicate crypt cell proliferation in a dose-dependent manner upon teduglutide treatment in contrast to the untreated cells. Results are shown from 2 independent experiments. Scale bars, 50 µm. (E) Representative immunofluorescence stain images stained for Lgr5+ GFP-ISCs (green) taken on day 6 from allo-HCT B6-Lgr5-EGFPcreER reporter mice that were treated with vehicle or teduglutide from day −3 to day 3. Images indicate reduced Lgr5+ cells in mice with GVHD in comparison with the untreated control mice. In contrast, the teduglutide-treated mice exhibit an enhanced number of Lgr5+ cells during GVHD. (F) Quantification of Lgr5+ cells/crypt of untreated B6-Lgr5-EGFPcreER (n = 7) or B6-Lgr5-EGFPcreER mice that underwent allo-HCT and were treated with teduglutide or vehicle (n = 8 per group). Teduglutide treatment protects ISCs from their loss due to GVHD. Results are shown from 2 independent experiments. The P values were calculated using the unpaired, 2-sided Student t test. (G-H) qPCR-based quantification of the ISC markers Olfm4 and Prom-1 expression in small intestine from untreated (n = 10) or allo-HCT BALB/c mice on day 5 treated with vehicle or teduglutide (n = 16 per group). Data were pooled from 2 independent experiments. The P values were calculated using the unpaired, 2-sided Student t test. (I) Gene-expression array of ISC markers analyzed on day 10 from the small intestine of allo-HCT BALB/c mice treated with teduglutide or vehicle from day −3 to day 10. Experiment was performed once.
Teduglutide protect mice with defective PCs from GVHD and reduce intestinal apoptosis without a loss of GVL effects
Because GLP-2 can expand not only ISC but also PCs, we next aimed to analyze whether teduglutide was still active in mice lacking Irgm1, which leads to a defective activity of their PCs. We observed that teduglutide still reduced GVHD-related death in mice lacking Irgm1 compared with vehicle-treated mice (Figure 6A). In agreement with the survival studies, the histopathological GVHD scores of small bowel and large bowel were lower in Irgm1−/− mice treated with teduglutide compared with vehicle-treated mice (Figure 6B). In BALB/c animals that underwent allo-HCT and were treated from day −3 to day 10, we observed that multiple genes involved in cell-death were decreased in the intestinal tract of mice treated with teduglutide compared with vehicle-treated mice (Figure 6C). Caspase 3 expression in the small bowel was lower in mice treated with teduglutide compared with vehicle-treated mice (Figure 6D). Terminal deoxynucleotidyl transferase dUTP nick-end labeling immunofluorescent staining revealed more apoptotic nuclei in the intestines of vehicle-treated mice compared with teduglutide-treated mice (Figure 6E). Immunosuppressive approaches that target T cells incur the risk for a loss of the graft-versus-leukemia (GVL) effect and delayed immune reconstitution. Teduglutide should not directly influence T cells as they do not express the GLP-2 receptor. To understand whether teduglutide exerted an indirect effect on T cells, we studied the effects of teduglutide on GVL effects and immune reconstitution. Teduglutide treatment allowed for full engraftment of allo-HCT recipient mice, the development of effector memory and central memory T cells, T regulatory cells, CD4+ cells, and CD8+ T cells (supplemental Figure 1A-H). To study GVL effects, we used 3 different leukemia models that we had previously reported.16 We observed that the GVL effect was preserved in the WEHI-3B Luc+ myeloid leukemia model (Figure 6F), the Ba/F3-ITD Luc+ lymphoid leukemia model (Figure 6G), and the AMLMLL-PTD/FLT3-ITD leukemia model (Figure 6H). These findings indicate that engraftment, immune reconstitution, and GVL effects are not affected by teduglutide treatment.
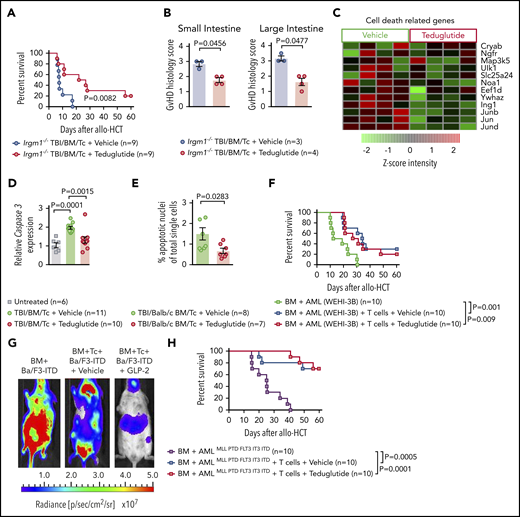
Teduglutide confers protection to mice with defective PCs and decrease intestinal cell apoptosis without loss of GVL effects. (A) Percentage survival of Irgm-1−/− mice that underwent allo-HCT and were treated with teduglutide or vehicle (n = 9 per group) from day −3 to day 3. Survival curves shown an increased survival rate in mice with defective PCs treated with teduglutide. Results are shown from 2 independent experiments. P value was calculated using the Mantel-Cox test. (B) Histological scores from allo-HCT Irgm-1−/− mice, small and large intestine were analyzed on day 10. Results indicate lower organ damage when GVHD mice were treated with teduglutide (n = 4) in comparison with the vehicle-treated group (n = 3). Mice were treated with teduglutide or vehicle from day −3 until day +3 unless differently specified. Results are shown from 1 experiment. The P values were calculated using a 2-sided Mann-Whitney U test. (C) Gene expression–based arrays analyzed on day 10 from the small intestine of allo-HCT BALB/c mice treated from day −3 to day 10 indicates the downregulation of different cell death–related genes in the teduglutide-treated group. Results are shown from 1 experiment. (D) Caspase 3 expression analyzed by qPCR in the small intestine of allo-HCT BALB/c mice treated from day −3 to day 10 with teduglutide or vehicle. Results display a downregulation of caspase 3 in mice treated with teduglutide (n = 10) in comparison with the high caspase 3 expression during GVHD (n = 11). Results are shown from 2 independent experiments. The P values were calculated using the unpaired, 2-sided Student t test. (E) Percentage quantification of apoptotic nuclei determined by a terminal deoxynucleotidyl transferase dUTP nick-end labeling (TUNEL) staining. BALB/c mice underwent allo-HCT and were treated with teduglutide or vehicle from day −3 to day 3. Small intestine samples were stained to detect DNA brakes. Results indicate less apoptotic cells in GVHD mice treated with teduglutide (n = 7) compared with GVHD mice treated with vehicle (n = 8). The P value was calculated using the unpaired, 2-sided Student t test. (F) Percentage survival of BALB/c-WEHI-3B leukemia-bearing mice that received allo-HCT/T cells and treatment with teduglutide or vehicle or BM and leukemia cells alone (n = 10 per group). Data are derived from 2 independent experiments. P value was calculated using the Mantel-Cox test. (G) Representative bioluminescence images taken on day 22 from BALB/c mice transplanted with Ba/F3-ITD Luc+ cells + allo-BM or Ba/F3-ITD Luc+ cells + allo-BM followed by T-cell transplantation on day 2 and treated with teduglutide or vehicle. Bioluminescence imaging signal indicates the tumor growth in mice according to the group. Representative data from 2 independent experiments. (H) Percentage survival of C57BL/6-AMLMLL PTD FLT3 ITD leukemia bearing mice that received allo-HCT + leukemia cells or in addition T cells and were treated with teduglutide or vehicle (n = 10 per group). Data are shown from 1 experiment. P value was calculated using the Mantel-Cox test.
Teduglutide confers protection to mice with defective PCs and decrease intestinal cell apoptosis without loss of GVL effects. (A) Percentage survival of Irgm-1−/− mice that underwent allo-HCT and were treated with teduglutide or vehicle (n = 9 per group) from day −3 to day 3. Survival curves shown an increased survival rate in mice with defective PCs treated with teduglutide. Results are shown from 2 independent experiments. P value was calculated using the Mantel-Cox test. (B) Histological scores from allo-HCT Irgm-1−/− mice, small and large intestine were analyzed on day 10. Results indicate lower organ damage when GVHD mice were treated with teduglutide (n = 4) in comparison with the vehicle-treated group (n = 3). Mice were treated with teduglutide or vehicle from day −3 until day +3 unless differently specified. Results are shown from 1 experiment. The P values were calculated using a 2-sided Mann-Whitney U test. (C) Gene expression–based arrays analyzed on day 10 from the small intestine of allo-HCT BALB/c mice treated from day −3 to day 10 indicates the downregulation of different cell death–related genes in the teduglutide-treated group. Results are shown from 1 experiment. (D) Caspase 3 expression analyzed by qPCR in the small intestine of allo-HCT BALB/c mice treated from day −3 to day 10 with teduglutide or vehicle. Results display a downregulation of caspase 3 in mice treated with teduglutide (n = 10) in comparison with the high caspase 3 expression during GVHD (n = 11). Results are shown from 2 independent experiments. The P values were calculated using the unpaired, 2-sided Student t test. (E) Percentage quantification of apoptotic nuclei determined by a terminal deoxynucleotidyl transferase dUTP nick-end labeling (TUNEL) staining. BALB/c mice underwent allo-HCT and were treated with teduglutide or vehicle from day −3 to day 3. Small intestine samples were stained to detect DNA brakes. Results indicate less apoptotic cells in GVHD mice treated with teduglutide (n = 7) compared with GVHD mice treated with vehicle (n = 8). The P value was calculated using the unpaired, 2-sided Student t test. (F) Percentage survival of BALB/c-WEHI-3B leukemia-bearing mice that received allo-HCT/T cells and treatment with teduglutide or vehicle or BM and leukemia cells alone (n = 10 per group). Data are derived from 2 independent experiments. P value was calculated using the Mantel-Cox test. (G) Representative bioluminescence images taken on day 22 from BALB/c mice transplanted with Ba/F3-ITD Luc+ cells + allo-BM or Ba/F3-ITD Luc+ cells + allo-BM followed by T-cell transplantation on day 2 and treated with teduglutide or vehicle. Bioluminescence imaging signal indicates the tumor growth in mice according to the group. Representative data from 2 independent experiments. (H) Percentage survival of C57BL/6-AMLMLL PTD FLT3 ITD leukemia bearing mice that received allo-HCT + leukemia cells or in addition T cells and were treated with teduglutide or vehicle (n = 10 per group). Data are shown from 1 experiment. P value was calculated using the Mantel-Cox test.
The number of L cells in the gut and the concentration of GLP-2 in blood correlate with the outcome of patients who develop GVHD
It has been demonstrated for PCs that their destruction during GVHD leads to lower numbers in the gut and higher levels of the PC-derived REG3-α in the blood.17 We examined sigmoid colonic biopsies of 29 consecutive patients with proven or probable intestinal acute GVHD according to MAGIC criteria8 at time of diagnosis. The median number of L cells per crypt was 1.05; we therefore used 1 L-cell per crypt as cutoff. We observed that ≥1 L-cell per crypt was associated with lower NRM (Figure 7A). Additionally, there was a trend toward a higher incidence of SR-GVHD when patients had <1 L-cell per crypt (Figure 7B-C). Next, we aimed to evaluate GLP-2 blood levels at diagnosis and correlate these with GVHD outcome. Taking into account the effects of food intake on GLP-2 levels, we included only consecutive patients who had fasting blood draws at time of initial diagnosis of acute GVHD (n = 82). Patient characteristics are summarized in supplemental Table 1. Median GLP-2 serum concentration was 3.7 ng/mL, which was used as cutoff for high vs low GLP-2 levels. We observed that high serum levels of GLP-2 >3.7 ng/mL were associated with poorer outcome in terms of incidence of SR-GVHD (hazard ratio [HR], 2.58; 95% confidence interval [CI], 1.17-5.67; P = .02) (Figure 7D) and NRM (HR, 4.37; 95% CI, 1.6-11.8; P = .004) (Figure 7E) compared with GLP-2 levels ≤ 3.7 ng/mL. GLP-2 level in the peripheral blood as a continuous variable was also associated with a higher risk of SR-GVHD and NRM. In multivariate analysis adjusting for HLA matching and use of antithymocyte globulin, a high GLP-2 serum level still maintained significant negative impact on NRM (HR, 4.1; 95% CI, 1.5-11.1; P = .005). In all, 29 of the 82 patients (35%) developed SR-GVHD (supplemental Table 2), 20 with initial high and 9 with low GLP-2 levels. Fourteen of 20 (70%) and 1 of 9 (11%) with high vs low GLP-2 levels, respectively, had NRM.
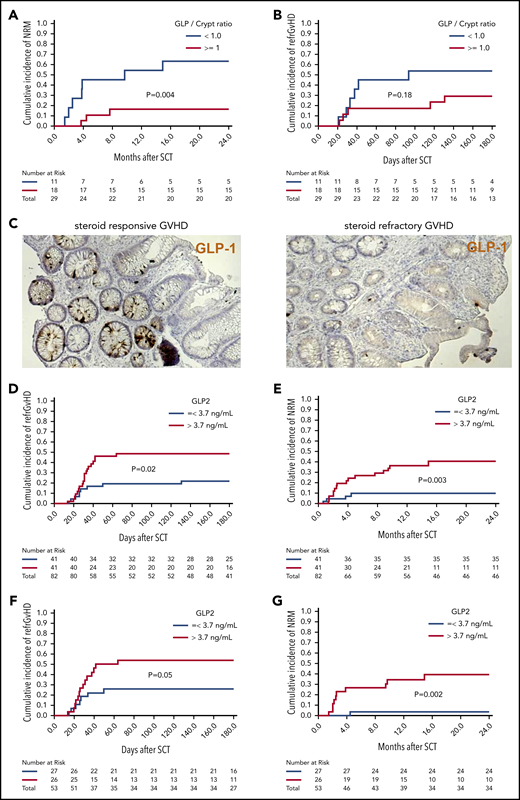
Low numbers of L cells in the gut and high GLP-2 levels in blood correlate with poor patient outcome after allo-HCT. Sigmoid colonic biopsies from 29 patients with initial diagnosis of acute gastrointestinal GVHD were stained for GLP-1 for quantification of L cells. Median L cell number per crypt was 1.05, therefore 1 L cell per crypt was used as cutoff for stratification in high (≥1 L cell per crypt) and low L-cell counts. (A) The 2-year cumulative incidence of NRM in patients with low vs high L-cell counts. (B) Cumulative incidence of SR-GVHD at 6 months in patients with low vs high L-cell counts. (C) Representative immunohistochemistry stain images of colonic biopsies stained for GLP-1 (brown). Left, patient with high L-cell count who responded well to steroid treatment and stayed alive. Right, patient with low L-cell count who developed SR-GVHD and NRM. For GLP-2 blood-level correlation, serum prepared from fasting blood samples of 82 consecutive patients with newly diagnosed acute GVHD was analyzed for GLP-2 concentration. Median GLP-2 concentration was 3.7 ng/mL, which was used as cutoff for stratification in high (>3.7 ng/mL) and low GLP-2 levels. (D) Cumulative incidence of SR acute GVHD at 6 months in patients with high vs low serum GLP-2 concentrations. (E) Cumulative incidence of NRM at 2 years in patients with high vs low serum GLP-2 concentrations. GLP-2 level in the peripheral blood as a continuous variable was also associated with a higher risk of SR-GVHD (HR, 1.09; 95% CI, 1.00-1.19; P = .05) and NRM (HR, 1.17; 95% CI, 1.03-1.32; P = .01). (F) Further subgroup analysis was performed including only patients with no gastrointestinal symptoms at time of diagnosis of GVHD (n = 53). Cumulative incidence of SR-GVHD at 6 months again tended to be higher for patients with high GLP-2 levels: 54% (95% CI, 34% to 74%) vs 26% (95% CI, 8% to 44%), P = .05. (G) Cumulative incidence of NRM at 2 years was higher for patients with high GLP-2 concentrations: 40% (95% CI, 20% to 60%) vs 4% (95% CI, 0% to 12%) (P = .002).
Low numbers of L cells in the gut and high GLP-2 levels in blood correlate with poor patient outcome after allo-HCT. Sigmoid colonic biopsies from 29 patients with initial diagnosis of acute gastrointestinal GVHD were stained for GLP-1 for quantification of L cells. Median L cell number per crypt was 1.05, therefore 1 L cell per crypt was used as cutoff for stratification in high (≥1 L cell per crypt) and low L-cell counts. (A) The 2-year cumulative incidence of NRM in patients with low vs high L-cell counts. (B) Cumulative incidence of SR-GVHD at 6 months in patients with low vs high L-cell counts. (C) Representative immunohistochemistry stain images of colonic biopsies stained for GLP-1 (brown). Left, patient with high L-cell count who responded well to steroid treatment and stayed alive. Right, patient with low L-cell count who developed SR-GVHD and NRM. For GLP-2 blood-level correlation, serum prepared from fasting blood samples of 82 consecutive patients with newly diagnosed acute GVHD was analyzed for GLP-2 concentration. Median GLP-2 concentration was 3.7 ng/mL, which was used as cutoff for stratification in high (>3.7 ng/mL) and low GLP-2 levels. (D) Cumulative incidence of SR acute GVHD at 6 months in patients with high vs low serum GLP-2 concentrations. (E) Cumulative incidence of NRM at 2 years in patients with high vs low serum GLP-2 concentrations. GLP-2 level in the peripheral blood as a continuous variable was also associated with a higher risk of SR-GVHD (HR, 1.09; 95% CI, 1.00-1.19; P = .05) and NRM (HR, 1.17; 95% CI, 1.03-1.32; P = .01). (F) Further subgroup analysis was performed including only patients with no gastrointestinal symptoms at time of diagnosis of GVHD (n = 53). Cumulative incidence of SR-GVHD at 6 months again tended to be higher for patients with high GLP-2 levels: 54% (95% CI, 34% to 74%) vs 26% (95% CI, 8% to 44%), P = .05. (G) Cumulative incidence of NRM at 2 years was higher for patients with high GLP-2 concentrations: 40% (95% CI, 20% to 60%) vs 4% (95% CI, 0% to 12%) (P = .002).
To study whether levels of GLP-2 are also relevant before gastrointestinal symptoms develop, we performed a subgroup analysis of 53 patients with no gastrointestinal symptoms at the time of GVHD diagnosis. In this subgroup, high serum levels of GLP-2 >3.7 ng/mL were also associated with a trend toward a higher incidence of SR-GVHD 54% (95% CI, 34% to 74%) vs 26% (95% CI, 8% to 44%) (P = .05) (Figure 7F) and NRM 40% (95% CI, 20% to 60%) vs 4% (95% CI, 0% to 12%) (P = .002) (Figure 7G). A possible explanation for the high GLP-2 levels in the serum of poor prognosis GVHD patients is that intestinal cell destruction causes GLP-2 leakage, which seems to occur even before gastrointestinal symptoms become apparent.
The major clinical effect of the GLP/crypt ratio in patients (n = 29) was on NRM whereas the GLP/crypt ratio was not correlated to refractory GVHD. Conversely, when we stratify patients (n = 82) according to serum GLP-2 levels, we found a significantly higher cumulative incidence of refractory GVHD in patients with high GLP-2 levels. It could be that the GLP/crypt ratio is influenced by other factors such as conditioning or infectious complications that are connected to NRM rather than refractory GVHD. Also, the relatively small number of patients included in the GLP/crypt analysis may be another reason for lack of statistical significance.
Discussion
Acute GVHD remains a major life-threatening complication after allo-HCT, indicating that novel approaches are needed. The homeostasis of the gastrointestinal tract is increasingly recognized as central in the pathophysiology of GVHD. GLP-2 plays a pivotal role in promoting gastrointestinal homeostasis.18 We tested the hypothesis that GVHD caused a deficit in GLP-2 due to the elimination of L cells by alloreactive T cells.
We found that GLP-2 and L cells declined after allo-HCT but not after syn-HCT, attributing the loss of L cells to GVHD. The profound GVHD-induced deletion of ISCs and PCs, which are essential for gut homeostasis, was counterbalanced by teduglutide treatment. Consistent with the rescue of ISCs and PCs, teduglutide treatment increased the expression of ISC markers and antimicrobial peptides. We also observed an improvement in GVHD severity and survival in mice lacking Irgm1, which have defective PCs, indicating that the effects of GLP-2 on GVHD are partially independent of this cell type. In addition, a distinct change of the intestinal microbiota composition upon teduglutide treatment was observed, consistent with the rescue of PCs, which produce antimicrobial peptides.19 Acute GVHD has been associated with a reduction in microbial diversity20 and a loss of PCs.10,21 Here, we observed that teduglutide treatment did not prevent loss of intestinal microbial diversity in mice developing GVHD. However, we found that the relative abundance of unclassified Bacteroidales increased in mice treated with teduglutide whereas it had decreased upon GVHD induction as it was known to be connected to GVHD.11,12 We observed that Firmicutes, including Flintibacter, decreased in the teduglutide-treated group, consistent with a protective effect of GLP-2 as patients who developed GVHD harbored more Firmicutes.11 During GVHD, the barrier function of the intestinal epithelium is altered due to epithelial atrophy caused by the conditioning regimen and later by the alloreactive T cells. We demonstrate that teduglutide treatment reduces the proinflammatory intestinal signature and increases the tight junction protein Claudin-4, which may improve intestinal epithelial barrier function. In agreement with this concept, previous reports have shown that GLP-2 enhances barrier function via upregulation of tight junction molecules in the intestinal tract.22 REG3-α produced by PCs has recently been shown to prevent apoptosis of ISCs.23 Our results show that effects of GLP-2 on the gut are antiapoptotic (as demonstrated by the downregulation of multiple gene transcripts associated with cell death and decreased expression of the apoptosis executor caspase 3) and proproliferative (as demonstrated by the upregulation of genes associated with growth factors such as KGF). Improved intestinal epithelial cell integrity in mice developing GVHD can lead to better nutrient absorption upon teduglutide treatment, which is in line with previous work showing that GLP-2 can increase nutrient absorption in normal rodents.24 In our studies, teduglutide was given in a prophylactic setting but not in established GVHD. Therefore, it is unclear whether teduglutide also reduces GVHD in a therapeutic setting. In patients with acute GVHD, PC loss and increased REG3-α serum levels were poor prognostic factors.17,23 Similarly in our study, low numbers of L cells and increase in serum levels of GLP-2 were associated with poorer patient outcome.
Comparable to our findings, other approaches aim at promoting intestinal regeneration, for example, by IL-22, which has been reported to enhance protection and regeneration of ISC.15 Recently, the clinical trial on IL-22 IgG2-Fc (F-652) for treatment of lower GI GVHD (NCT02406651) has finished recruitment. Another approach developed in preclinical models of GVHD targets the canonical WNT/β catenin signaling via R-spondin 1 (R-Spo1). Treatment with R-Spo1 reduced acute GVHD in the mouse model by protecting ISCs and PCs.25 KGF, which enhances proliferation of ISCs and several intestinal epithelial cells has been tested in a phase 1/2 randomized placebo controlled trial.26 Although severity of mucositis could be reduced, KGF had no impact on GVHD.26 In contrast to these approaches, teduglutide is approved by the US Food and Drug Administration for SBS.
In summary, we describe herein that L cells are a target of GVHD. We show that the resulting decline of GLP-2 can be overcome by treatment with the degradation-resistant GLP-2 analog teduglutide, which is already available for patients with SBS. Mechanistically, we found that GLP-2 substitution promotes regeneration of PCs and ISCs, which enhanced production of antimicrobial peptides and caused microbiome changes. Teduglutide reduced GVHD severity without impairing immune reconstitution and GVL effects in mice. In patients, high GLP-2 serum levels correlated with refractory GVHD incidence and a low GLP/crypt ratio correlated with NRM. Our findings pave the way for testing GLP-2 in patients with GVHD in a controlled clinical trial.
The gene-expression data reported in this article are available at the Gene Expression Omnibus database (accession number GSE138439).
The online version of this article contains a data supplement.
The publication costs of this article were defrayed in part by page charge payment. Therefore, and solely to indicate this fact, this article is hereby marked “advertisement” in accordance with 18 USC section 1734.
Acknowledgments
The authors thank Michal Rössler for help with the graphical abstract.
This work was supported by the Deutsche Forschungsgemeinschaft (DFG; Germany): SFB TRR167 (R.Z.), SFB1160 TP B09 (R.Z.), and SFB 850 (Z1 [M.B.]; C6 [R.Z.]); the DFG under Germany’s Excellence Strategy (EXC-2189; project ID: 390939984); and DFG individual grant ZE872/4-1 (R.Z.). This work was also supported by the European Union (proposal number 681012 GvHDCure [ERC consolidator grant; R.Z.]); the Deutsche Krebshilfe (grant 70113473); the Jose-Carreras Leukemia Foundation (grant DJCLS 01R/2019; R.Z.); European Cooperation in Science and Technology (COST) Action 17138 EUROGRAFT, supported by COST; and National Institutes of Health grants R01 HL56067 (National Heart, Lung, and Blood Institute) and R37AI34495 (National Institute of Allergy and Infectious Diseases) (B.R.B.). N. Köhler was supported by the EQUIP-Programme for Medical Scientists, Faculty of Medicine, University of Freiburg and the DKMS Foundation for Giving Life (DKMS-SLS-MHG-2019-02). M.B. was supported by the German Federal Ministry of Education and Research (BMBF) within the framework of the e:Med research and funding concept (coNfirm; FKZ 01ZX1708F) and within the Medical Informatics Funding Scheme (MIRACUM; FKZ 01ZZ1606A-H). B.G. was supported by the DFG (GR1617/14-1/iPAD; SFB1160/2_B5; RESIST–EXC 2155–Project ID 39087428; and CIBSS–EXC-2189–project ID 390939984) and the BMBF (GAIN 01GM1910A).
Authorship
Contribution: J.N. helped to design the experiments, performed the mouse experiments, and helped to write the manuscript; D.S. and R.I. helped with qPCR and WB experiments; N.R. helped with intestinal organoid experiments; G.T. and P.A. provided vital reagents and advice; N. Köhler helped with cytokine bead array experiments; J.d.H. helped to collect intestinal biopsies and interpreted data; S.H. helped obtain human intestinal biopsy samples and patient data; G.A. performed analysis of microarray data; B.A.S. analyzed microbiome data; A.S.-G. helped to analyze the GVHD scoring of different tissues; D.P. helped with microarrays; A.C. and I.J.F. helped with immunohistochemistry staining; M.P. helped with microbiome experiments; B.G., A.B., and A.S.B. helped to analyze the microbiome-sequencing experiments; T.B. helped with organoid experiments; T.C. helped perform GLP-1 immunohistochemistry; T.Z. performed statistical analysis; B.R.B. helped to design studies and interpreted data; N. Kroeger helped to design experiments and write the manuscript; M.B. helped to analyze the microarray data; F.A. conceived the study, analyzed data, and wrote the first version of human data in manuscript; and R.Z. designed the mouse experiments, analyzed data and wrote the first version of the manuscript.
Conflict-of-interest disclosure: B.R.B. receives remuneration as an advisor to Kamon Pharmaceuticals, Inc, Five Prime Therapeutics Inc, Regeneron Pharmaceuticals, Magenta Therapeutics, and BlueRock Therapeutics; receives research support from Fate Therapeutics, RXi Pharmaceuticals, Alpine Immune Sciences, Inc, AbbVie Inc, BlueRock Therapeutics, the Leukemia & Lymphoma Society, the Children’s Cancer Research Fund, and the KidsFirst Fund; and is a cofounder of Tmunity. The remaining authors declare no competing financial interests.
Correspondence: Robert Zeiser, Department of Hematology, Oncology and Stem Cell Transplantation, University Medical Center Freiburg, D-79106 Freiburg, Germany; e-mail: robert.zeiser@uniklinik-freiburg.de; or Francis Ayuk, Department of Stem Cell Transplantation, University Medical Center Hamburg-Eppendorf, Martinistr 52, 20246 Hamburg, Germany; e-mail: ayuketang@uke.de.
