

Key Points
Conventional Sca-1–based analysis can potentially cause misinterpretation of stress-mediated hematopoiesis.
CD86 serves as an alternative marker to Sca-1 for assessing bona fide hematopoietic responses under stress conditions.

Abstract
Hematopoiesis is a system that provides red blood cells (RBCs), leukocytes, and platelets, which are essential for oxygen transport, biodefense, and hemostasis; its balance thus affects the outcome of various disorders. Here, we report that stem cell antigen-1 (Sca-1), a cell surface marker commonly used for the identification of multipotent hematopoietic progenitors (Lin−Sca-1+c-Kit+ cells; LSKs), is not suitable for the analysis of hematopoietic responses under biological stresses with interferon production. Lin−Sca-1−c-Kit+ cells (LKs), downstream progenitors of LSKs, acquire Sca-1 expression upon inflammation, which makes it impossible to distinguish between LSKs and LKs. As an alternative and stable marker even under such stresses, we identified CD86 by screening 180 surface markers. The analysis of infection/inflammation-triggered hematopoiesis on the basis of CD86 expression newly revealed urgent erythropoiesis producing stress-resistant RBCs and intact reconstitution capacity of LSKs, which could not be detected by conventional Sca-1–based analysis.
Introduction
Hematopoiesis is largely involved in the pathogenesis of multiple diseases such as infection, inflammation, autoimmunity, and cancer.1-5 On the other hand, biological stresses, such as infection, inflammation, and anticancer drug treatment, strongly affect hematopoiesis.6,7 For example, systemic bacterial or fungal infections induce myeloid-biased hematopoiesis (ie, emergency myelopoiesis), which inversely decreases lymphopoiesis and erythropoiesis,8-11 resulting in lymphopenia and anemia.12,13 Thus, accurate analysis of hematopoiesis is crucial to our understanding of the pathogenesis of various diseases. Studies at steady state have identified various hematopoietic progenitors based on their surface marker expression patterns and differentiation capacities. Stem cell antigen-1 (Sca-1) has been widely used as an essential marker to distinguish Lin−Sca-1+c-Kit+ cells (LSKs), which include hematopoietic stem cells (HSCs) and multipotent progenitors (MPPs), from downstream Lin−Sca-1−c-Kit+ cells (LKs), such as common myeloid progenitors (CMPs), granulocyte-macrophage progenitors (GMPs), and megakaryocyte-erythrocyte progenitors (MEPs). The expression level of Sca-1, an interferon (IFN)–stimulated gene (ISG), however, is considerably upregulated upon IFN signaling of previously Sca-1− cells, including LKs.14-16 For example, Sca-1+ GMPs appeared in mice overexpressing TLR7 in an IFN-dependent manner.17 Thus, under biological stresses with IFN production, the reliability of hematopoietic analysis based on Sca-1 expression varies, which can lead to misinterpretations.
A previous report suggested that LKs expressing lysozyme M or Fc γ receptor (FcγR) occupied only 25 to 30% of LSKs after lipopolysaccharide (LPS) injection.18 Lysozyme M expression is confined to a fraction of CMPs and GMPs, however, and contaminating MEPs were not examined, thus underestimating the contamination magnitude of Sca-1+ LKs in the LSK pool after LPS injection. Recent single-cell RNA-sequencing analysis or mass cytometry with metal-labeled antibodies have identified hematopoietic progenitors.19-21 However, there are some difficulties in applying those techniques to hematopoietic analysis under stress. First, the differentiation capacity of the identified progenitors cannot be evaluated, because the cells are lysed or ionized during their identification steps. Second, the gene expression profile and surface phenotypes of these hematopoietic stem and progenitor cells (HSPCs) differ between steady-state and stress environments. Finally, the instruments for these analyses are expensive and are thus not fully distributed compared with conventional flow cytometry (FCM), which makes time-course analysis after disease onset difficult. FCM analysis with reliable markers, which can be linked to functional analysis, is beneficial to analyze hematopoietic responses during infection and inflammation.
Here, we precisely examined the validity of conventional Sca-1–based analysis for infection/inflammation-triggered hematopoietic responses and reveal that the analysis mistakenly and largely skews the outcomes. As an alternative strategy, we propose CD86-based analysis to accurately observe infection/inflammation-induced hematopoietic responses. Using CD86-based analysis, we successfully identify the intact stemness of LSKs and the transient activation of erythropoiesis after infection, which are not detected by Sca-1–based analysis. Thus, CD86-based analysis is a promising approach to understand hematopoietic responses under stress conditions.
Methods
Mice
We obtained C57BL/6J (B6), BALB/c, and CAG-EGFP mice from Japan Slc (Hamamatsu, Japan); B6.SJL-ptprca (B6.SJL) mice congenic at the CD45 locus (CD45.1+CD45.2−) from Taconic (Germantown, NY); and Rosa26-LSL-tdTomato,22 Cx3cr1-CreERT,23 Stat1−/−24 , and Cx3cr1gfp/+ mice25 from Jackson. All mice were maintained in our specific pathogen–free animal facility, and all experiments using mice were approved by the Institutional Animal Care Committee of the Tokyo Medical and Dental University.
Statistical analysis
Statistical analysis was evaluated using Microsoft Excel (Redmond, WA) or Prism software version 7 (GraphPad, La Jolla, CA). The 2-tailed Student t test was used for statistical analyses of 2-group comparisons. Multigroup comparisons were performed by a 1-way analysis of variance (ANOVA) followed by the Tukey-Kramer multiple comparisons test. The χ2 test was used to determine if there was a significant relationship between 2 categorical variables. χ2 statistics were derived using the CHIDIST function of Microsoft Excel. The criterion of significance was set at P < .05. All results are expressed as means ± standard error of the mean (SEM). Blinding or randomization to the groups was not performed, and no data were excluded. No statistical methods were used to estimate sample size.
Additional methods are available in supplemental Methods (available on the Blood Web site).
Results
Sca-1 does not work as a marker to analyze hematopoiesis during infection
Based on the background above, we initially evaluated the usability of Sca-1 as a marker to distinguish LSKs from downstream LKs during infection and inflammation. To mimic systemic bacterial infection, LPS was intraperitoneally administered into wild-type (WT) mice. FCM plots for lineage-negative bone marrow (BM) cells suggested the time-dependent intrusion of LKs into the LSK gate (Figure 1A), resulting in a dramatic increase in the frequency and number of “apparent” LSKs (Figure 1B). Similar results were obtained from WT mice after systemic infection using a cecal ligation puncture (CLP) model (supplemental Figure 1A). To evaluate the contamination scale, we cocultured sort-purified naive LSKs and LKs or MEPs with total BM cells in the presence or absence of LPS (Figure 1C; supplemental Figure 1B). In the absence of LPS, only 10% of LKs were detected in the LSK gate. However, ≥70% of LKs were contaminated in the same gate upon LPS stimulation (Figure 1C). Similar results were obtained from cultures of LSKs and MEPs (supplemental Figure 1B). Consistently, intra-BM injection of LKs followed by LPS injection induced Sca-1 expression of ~60% of the donor LKs, contaminating the LSK gate (Figure 1D). In addition to Sca-1, we noticed a slight reduction of c-kit expression by LKs and LSKs cultured in the presence of LPS (Figure 1C). However, as the reduction is limited, it did not affect the gating for c-kit–expressing cells. As CX3CR1 is expressed on LKs, but not LSKs (supplemental Figure 1C-D), we traced LKs using Cx3cr1-CreER/Rosa26-LSL-tdTomato reporter mice (hereafter, Cx3cr1-CreER/tdTom mice). Two days after tamoxifen injection, LPS or phosphate-buffered saline (PBS) was further injected into Cx3cr1-CreER/tdTom mice, and Sca-1 expression on tdTomato+ LKs was examined (supplemental Figure 1E). Compared with control PBS-injected mice, in which no tdTomato+ cells were detected in the LSK gate, approximately 60% of tdTomato-labeled cells became Sca-1+, suggesting the presence of LKs within the LSK gate (Figure 1E-F). As a control, tamoxifen injection did not label original LSKs after LPS treatment (supplemental Figure 1F-G). Collectively, both ex vivo and in vivo results suggested that most LKs become Sca-1+ upon LPS injection and CLP induction, invading the LSK fraction.
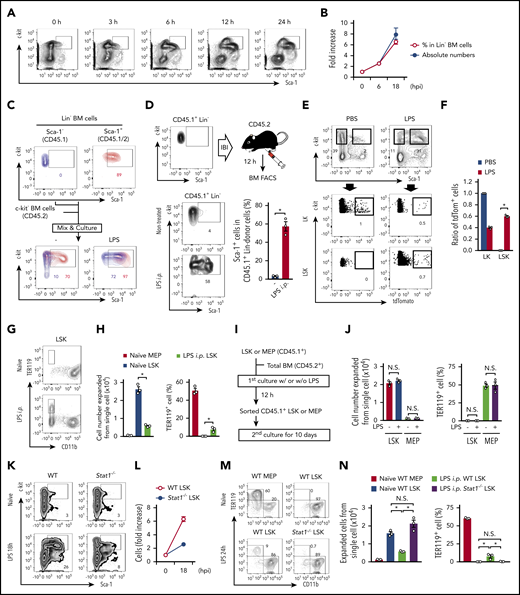
Sca-1 upregulation skews the apparent numbers and functions of hematopoietic progenitors. (A) Time-course analysis for FCM of Lin− BM cells after LPS treatment. (B) Number and frequencies of LSKs after LPS treatment; n = 3 per time-point. hpi, hours postinjection. (C) Ex vivo cultures of LKs and LSKs under LPS stimulation. LKs and LSKs were sorted from naive CD45.1+ and CD45.1+/CD45.2+ mice, respectively. These cells were mixed and cultured with c-kit− BM cells (CD45.2+) in the absence or presence of LPS (100 ng/mL) for 12 hours, and Sca-1 upregulation was assessed by FCM. (D) Evaluation of Sca-1 upregulation on LKs in vivo. LKs obtained from naive CD45.1+ mice were directly injected into the BM of CD45.2+ mice, and then LPS (5 mg/kg) was injected into the mice. Twelve hours after LPS injection, Sca-1 expression on CD45.1+ donor cells was examined in nontreated (n = 5) and LPS-injected (n = 3) mice. IBI, intra-BM injection. (E-F) Tracing of CX3CR1+ LKs in vivo. Two days after tamoxifen treatment (2 mg/mouse) in Cx3cr1-CreER/tdTom mice, LPS (5 mg/ kg) or PBS was injected as shown in supplemental Figure 1E. Twelve hours after LPS treatment, the frequencies of tdTomato+ cells in LKs and LSKs were examined. Representative FCM plots and statistical analysis are shown in panels E and F, respectively; n = 3 per group. (G-H) MEPs and LSKs obtained from mice before or 24 hours after the injection of LPS (5 mg/kg) were cultured in methylcellulose medium for 10 days, and cell expansion and TER119+ cell generation were evaluated by FCM. Representative FCM plots and statistical analysis are shown in panels G and H, respectively; n = 3 per group. i.p., intraperitoneal. (I-J) MEPs and LSKs isolated from the BM of naïve CD45.1+ mice were stimulated with LPS (100 ng/mL) as shown in panel I. Cultured CD45.1+ cells were sorted and cultured in methylcellulose medium for 10 days, and cell expansion and TER119+ cell generation were assessed by FCM; n = 3 per group. (K-L) Increase in population sizes for LSKs in WT and Stat1−/− mice before and 18 hours after the LPS injection (5 mg/kg); n = 3 per time-point. Representative FCM plots are shown in (K). (M-N) Evaluation of capacities in LSKs from Stat1−/− mice. MEPs and/or LSKs were isolated from the BM of WT or in Stat1−/− mice before and/or after the injection of LPS (5 mg/kg). Cells were cultured in methylcellulose medium for 10 days and the capacities to expand and generate TER119+ cells were examined by FCM; n = 3 per group. The numbers on FCM plots indicate frequencies of gated populations. *P < .05, N.S., not significant; Student t test (D) or 1-way ANOVA (F, H, J, and N). Data are representative of 2 (C-F and J-N) or 3 (A, B, G, and H) independent experiments (error bars in panels B, D, F, H, J, L, and M represent SEM).
Sca-1 upregulation skews the apparent numbers and functions of hematopoietic progenitors. (A) Time-course analysis for FCM of Lin− BM cells after LPS treatment. (B) Number and frequencies of LSKs after LPS treatment; n = 3 per time-point. hpi, hours postinjection. (C) Ex vivo cultures of LKs and LSKs under LPS stimulation. LKs and LSKs were sorted from naive CD45.1+ and CD45.1+/CD45.2+ mice, respectively. These cells were mixed and cultured with c-kit− BM cells (CD45.2+) in the absence or presence of LPS (100 ng/mL) for 12 hours, and Sca-1 upregulation was assessed by FCM. (D) Evaluation of Sca-1 upregulation on LKs in vivo. LKs obtained from naive CD45.1+ mice were directly injected into the BM of CD45.2+ mice, and then LPS (5 mg/kg) was injected into the mice. Twelve hours after LPS injection, Sca-1 expression on CD45.1+ donor cells was examined in nontreated (n = 5) and LPS-injected (n = 3) mice. IBI, intra-BM injection. (E-F) Tracing of CX3CR1+ LKs in vivo. Two days after tamoxifen treatment (2 mg/mouse) in Cx3cr1-CreER/tdTom mice, LPS (5 mg/ kg) or PBS was injected as shown in supplemental Figure 1E. Twelve hours after LPS treatment, the frequencies of tdTomato+ cells in LKs and LSKs were examined. Representative FCM plots and statistical analysis are shown in panels E and F, respectively; n = 3 per group. (G-H) MEPs and LSKs obtained from mice before or 24 hours after the injection of LPS (5 mg/kg) were cultured in methylcellulose medium for 10 days, and cell expansion and TER119+ cell generation were evaluated by FCM. Representative FCM plots and statistical analysis are shown in panels G and H, respectively; n = 3 per group. i.p., intraperitoneal. (I-J) MEPs and LSKs isolated from the BM of naïve CD45.1+ mice were stimulated with LPS (100 ng/mL) as shown in panel I. Cultured CD45.1+ cells were sorted and cultured in methylcellulose medium for 10 days, and cell expansion and TER119+ cell generation were assessed by FCM; n = 3 per group. (K-L) Increase in population sizes for LSKs in WT and Stat1−/− mice before and 18 hours after the LPS injection (5 mg/kg); n = 3 per time-point. Representative FCM plots are shown in (K). (M-N) Evaluation of capacities in LSKs from Stat1−/− mice. MEPs and/or LSKs were isolated from the BM of WT or in Stat1−/− mice before and/or after the injection of LPS (5 mg/kg). Cells were cultured in methylcellulose medium for 10 days and the capacities to expand and generate TER119+ cells were examined by FCM; n = 3 per group. The numbers on FCM plots indicate frequencies of gated populations. *P < .05, N.S., not significant; Student t test (D) or 1-way ANOVA (F, H, J, and N). Data are representative of 2 (C-F and J-N) or 3 (A, B, G, and H) independent experiments (error bars in panels B, D, F, H, J, L, and M represent SEM).
We next examined the differentiation potential of LKs and LSKs. When these cells from naive mice were cultured in methylcellulose medium for 10 days, LK populations, including CMPs, GMPs, and MEPs, showed lower expansion capacity compared with LSKs, and CMPs and MEPs generated TER119+ cells (supplemental Figure 2A). In this context, 10 days were insufficient, and 13 days were required for LSKs to differentiate into TER119+ cells (supplemental Figure 2B). Under this 10-day culture setting, LSKs from LPS-injected mice and CLP model mice exhibited much reduced expansion and generated TER119+ cells, likely due to the contamination of downstream LKs (Figure 1G-H; supplemental Figure 2C). Supporting this notion, ex vivo LPS stimulation of isolated LSKs did not show erythrogenesis during a 10-day culture (Figure 1I-J). Sca-1 is known to be an ISG.14-16 To exclude the impact of Sca-1 elevation on LKs upon LPS stimulation, we analyzed mice lacking signal transducers and activators of transcription 1 (STAT1), an essential transcription factor for IFN signaling.26 In LPS-treated Stat1−/− mice, IFN-mediated Sca-1 upregulation was strongly inhibited (Figure 1K; supplemental Figure 2D-E), and the number of LSKs increased only approximately twofold, which was much lower than that in LPS-treated WT mice (Figure 1L). Again, LSKs from LPS-injected WT mice showed much reduced expansion and generated TER119+ cells during a 10-day culture due to the contamination of LKs (Figure 1M-N). In contrast, Stat1−/− mice did not show such abnormalities as a result of preventing the contamination of Sca-1–upregulated LKs into LSKs (Figure 1M-N). Our phenotypical and functional analysis strongly suggested that Sca-1 is not a suitable marker for examining hematopoietic responses under stress conditions such as infection and inflammation.
CD86 as an alternative marker for Sca-1
To avoid misinterpretations caused by the upregulation of Sca-1 in LKs, an alternative and reliable marker is required. To this end, we screened 180 surface molecules and identified CD86, also known as B7.2, a member of the B7 family. Screening details are described in supplemental Methods and shown in supplemental Figure 3. At steady state, Lin−CD86+c-kit+ cells (L86Ks) and Lin−CD86−c-kit+ (CD86− LKs) were almost overlapped with LSKs and conventional Sca-1− LKs, respectively (Figure 2A; supplemental Figure 4A-B), indicating that CD86 can be an alternative marker of Sca-1. Other B7-family molecules, such as programmed cell death-ligand 2 (PD-L2), inducible costimulatory molecule-ligand (ICOS-L), and B7-H4 were not expressed on LKs and LSKs. In addition, CD80, also known as B7.1, PD-L1, and MHC II were expressed on both LKs and LSKs (supplemental Table 1). All LSK subpopulations, that is, long-term (LT) HSCs, short-term HSCs, MPP2, and MPP3/MMP4, express CD86 (Figure 2B; supplemental Figure 4C). After LPS injection or CLP induction, Sca-1− LKs gained Sca-1 expression and invaded the LSK fraction (Figure 2C; supplemental Figures 4D and 5A-B), resulting in a marked increase in the number of “apparent” LSKs and a converse decrease in LKs (Figure 2D). In contrast, the increase in L86Ks and decrease in CD86− LKs were observed to be slight (Figure 2D), implying that the contamination of CD86− LKs in the L86K fraction was minimal because of the unchanged or negligible CD86 expression level of LKs. Without contradicting the results showing that the increase in L86K in WT mice and LSK in Stat1−/− mice were similar (Figures 1L and 2D), most CD86− LKs and L86Ks were Sca-1− and Sca-1+, respectively, in Stat1−/− mice even after LPS injection (Figure 2E; supplemental Figure 4E). We also found that the expression levels of Sca-1 and CD86 on L86Ks tended to increase in a STAT1-dependent manner after LPS injection (Figure 2C,E). To examine whether CD86 expression by LKs is altered after LPS stimulation, CD45.1+ LKs were cultured with CD45.2+ total BM cells in the presence of LPS (Figure 2F). It is of note that LPS-stimulated LKs had dramatically enhanced Sca-1 expression whereas their upregulation of CD86 expression was much milder at both the protein and the mRNA levels (Figure 2F; supplemental Figure 5C-F). We also performed intra-BM injection of CD45.2+ LKs into CD45.1+ mice, followed by LPS injection. Again, the expression level of Sca-1, but not CD86, was enhanced on the injected LKs (Figure 2G). Based on these findings, we concluded that, in contrast to the Sca-1 acquisition of LKs, LKs remained CD86− even after LPS stimulation. These results strongly suggested the CD86 is a promising marker under stress conditions.
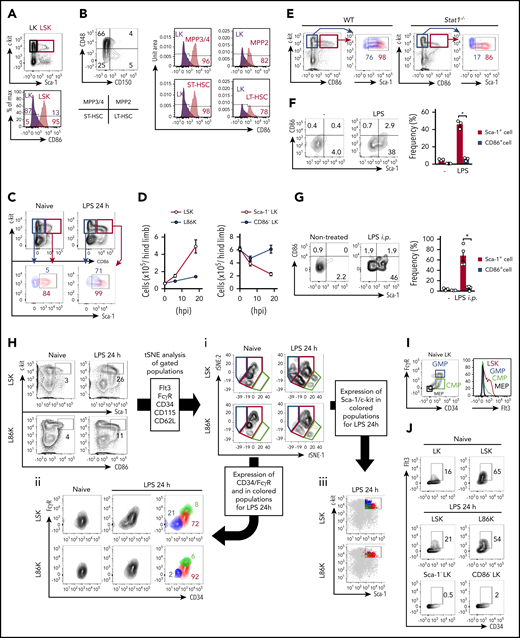
CD86 as an alternative marker for Sca-1. (A) Expression of CD86 on LKs and LSKs at steady state. (B) Expression of CD86 on LKs, LT-HSCs, short-term HSCs (ST-HSC), MPP2, and MPP3/MMP4 in naive WT mice was examined by FCM. (C) Expression of Sca-1 on L86Ks and CD86− LKs before and 24 hours after the LPS injection. (D) Kinetic analysis of cell numbers for LSKs, L86Ks, Sca-1− LKs, and CD86− LKs before and 6 and 18 hours after LPS treatment; n = 3 per group. (E) Evaluation of Sca-1 expression in CD86− LKs or L86Ks in WT and Stat1−/− mice 18 hours after LPS treatment. Sca-1 expression of CD86− LKs (blue) and L86Ks (red) in the left panels are shown in the right panels. (F) Evaluation of Sca-1 and CD86 upregulation by an ex vivo culture system. Lin−c-kit+Sca-1−CD86− BM cells were isolated from naive CD45.2+ mice and cocultured with total BM cells (CD45.1+) in the absence or presence of LPS (100 ng/mL) for 12 hours. Statistical evaluation is shown in the right panel. (G) Evaluation of CD86 upregulation in vivo. Lin−c-kit+Sca-1−CD86− BM cells isolated from the BM of naive CD45.2+ mice were directly injected into the BM of CD45.1+ mice. Twelve hours after LPS injection, the expression of Sca-1 and CD86 on CD45.2+ donor cells was examined. Statistical evaluation is shown in the right panel. (H) t-SNE analysis for LSK and L86Ks before and 24 hours after LPS injection. LSKs and L86Ks were divided into 3 groups (blue, red, and green) based on the distribution on t-SNE plots (i). The expression patterns of CD34 and FcγR (ii) or Sca-1 (iii) were assessed. (I) Expression of Flt3 on MEPs, CMPs, and GMPs in naive conditions. (J) Frequencies of Flt3+CD34+ cells in LKs, LSKs, and/or L86Ks before and/or 24 hours after LPS treatment. The numbers on FCM plots indicate frequencies of gated populations. *P < .05, 1-way ANOVA (F and G). Data are representative of 2 (E-J) or 3 (A-D) independent experiments (error bars in panels D, F, and G represent SEM).
CD86 as an alternative marker for Sca-1. (A) Expression of CD86 on LKs and LSKs at steady state. (B) Expression of CD86 on LKs, LT-HSCs, short-term HSCs (ST-HSC), MPP2, and MPP3/MMP4 in naive WT mice was examined by FCM. (C) Expression of Sca-1 on L86Ks and CD86− LKs before and 24 hours after the LPS injection. (D) Kinetic analysis of cell numbers for LSKs, L86Ks, Sca-1− LKs, and CD86− LKs before and 6 and 18 hours after LPS treatment; n = 3 per group. (E) Evaluation of Sca-1 expression in CD86− LKs or L86Ks in WT and Stat1−/− mice 18 hours after LPS treatment. Sca-1 expression of CD86− LKs (blue) and L86Ks (red) in the left panels are shown in the right panels. (F) Evaluation of Sca-1 and CD86 upregulation by an ex vivo culture system. Lin−c-kit+Sca-1−CD86− BM cells were isolated from naive CD45.2+ mice and cocultured with total BM cells (CD45.1+) in the absence or presence of LPS (100 ng/mL) for 12 hours. Statistical evaluation is shown in the right panel. (G) Evaluation of CD86 upregulation in vivo. Lin−c-kit+Sca-1−CD86− BM cells isolated from the BM of naive CD45.2+ mice were directly injected into the BM of CD45.1+ mice. Twelve hours after LPS injection, the expression of Sca-1 and CD86 on CD45.2+ donor cells was examined. Statistical evaluation is shown in the right panel. (H) t-SNE analysis for LSK and L86Ks before and 24 hours after LPS injection. LSKs and L86Ks were divided into 3 groups (blue, red, and green) based on the distribution on t-SNE plots (i). The expression patterns of CD34 and FcγR (ii) or Sca-1 (iii) were assessed. (I) Expression of Flt3 on MEPs, CMPs, and GMPs in naive conditions. (J) Frequencies of Flt3+CD34+ cells in LKs, LSKs, and/or L86Ks before and/or 24 hours after LPS treatment. The numbers on FCM plots indicate frequencies of gated populations. *P < .05, 1-way ANOVA (F and G). Data are representative of 2 (E-J) or 3 (A-D) independent experiments (error bars in panels D, F, and G represent SEM).
To further confirm the reliability of CD86 for identifying LSKs under steady state and stress conditions, we performed t-distribute stochastic neighbor embedding (t-SNE) analysis. Based on the expression patterns of Flt3, FcγR, CD34, CD115, and CD62L, surface markers uniquely expressed on each progenitor,27-29 we divided LSKs and L86Ks into 3 subpopulations, ie, blue, red, and green fractions. In naive conditions, most LSKs and L86Ks were located within the red fraction (left panel, Figure 2Hi). However, after LPS injection, a substantial increase of cells in the blue and green fractions was observed in LSKs (right upper panel, Figure 2Hi), whereas that was strongly prevented in L86Ks (right lower panel, Figure 2Hi). The expression patterns of CD34 and FcγR showed that cells in the green and blue fractions are GMPs (CD34+FcγR+) and MEPs (CD34−FcγR−), respectively (Figure 2Hii), and the contamination of GMPs and MEPs was limited in L86Ks compared with LSKs (Figure 2Hii,iii). In this context, Sca-1 expression in the blue and green fractions was low in LPS-treated mice (Figure 2Hiii). Consistently, MPP2 and 3, which weakly express Sca-1 in naïve conditions, became a Sca-1high population upon LPS-treatment (supplemental Figure 5G-H), excluding the possibility that cells in the green and blue fractions are MPP2 and 3 and implying that the blue and green cells originated from LKs. In the steady state, Flt3 was preferentially expressed by LSKs rather than LKs (Figure 2I). After LPS treatment, the frequency of CD34+Flt3+ cells in LSKs decreased, suggesting the substantial contamination of Flt3− LKs in the LSK pool (Figure 2J). In contrast, the decrease in the frequency of the Flt3+CD34− cells was much milder in L86Ks (Figure 2J), suggesting the minimal contamination of Flt3− LKs in the L86K fraction. These results confirmed that CD86 serves to distinguish LKs and LSKs, even under stress conditions.
CD86-based analysis enables LKs and LSKs to be distinguished even during infection
As LKs are originally Sca-1−CD86− and become Sca-1+CD86− upon LPS stimulation (Figure 2F-G), CD86− LSKs are considered to be contaminated LKs. The ratio of CD86− LSKs and CD86+ LSKs suggested that the contaminated LKs occupied ∼65% of the total LSKs after LPS treatment (Figure 3A). To further confirm the contaminated LKs by functional evaluation, total LSKs, CD86− LSKs, and CD86+ LSKs were obtained from LPS-treated or CLP-induced WT mice (Figure 3B-C; supplemental Figure 6A-B). These CD86+ LSKs showed comparable expansion levels to LSKs from naïve mice (Figure 3B; supplemental Figure 6A). In addition, neither LSKs from naive mice nor CD86+ LSKs from LPS-treated or CLP-induced mice generated TER119+ cells in a 10-day culture setting (Figure 3B-C; supplemental Figure 6A-B). This was consistent with their low level expression of Gata1, a transcription factor critical for erythropoiesis30 and preferentially expressed in MEPs and CMPs31 (Figure 3D), suggesting that CD86+ LSKs do not contain LKs, even under stress conditions. In contrast, both total LSKs and CD86− LSKs from LPS-treated or CLP-induced mice showed reduced expansion capacity and generated TER119+ cells (Figure 3B-C; supplemental Figure 6A-B). It is of note that, in LPS-treated or CLP-induced mice, the TER119+ cell generation capacity of CD86− LSKs was significantly higher than that of total LSKs (Figure 3B-C), suggesting that erythrocyte progenitors, namely, MEPs and CMPs, were enriched in CD86− LSKs. Indeed, the expression level of Gata1 was significantly enhanced in CD86− LSKs compared with total LSKs after LPS treatment (Figure 3D). To further demonstrate to what extent LKs contaminated LSKs and L86Ks, we also performed LK tracing using Cx3cr1-CreER/tdTom mice (Figure 3E; supplemental Figure 6C). After LPS injection, up to 70% of labeled LKs became Sca-1+ whereas the frequency of CD86-expressing cells in labeled LKs was <10%. The contaminating cells in L86Ks were GMPs, while those in LSKs contained both GMPs and MEPs (supplemental Figure 6D-E). Collectively, CD86 is a reasonable marker to analyze accurate hematopoietic responses under stress conditions.
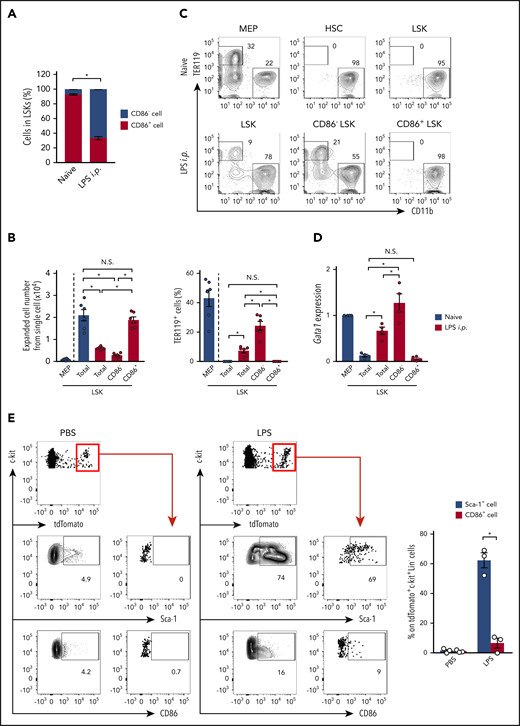
CD86+ LSKs do not show a LK signature. (A) Ratio between CD86− and CD86+ cells in LSKs before and 24 hours after LPS treatment; n = 3 per group. (B-C) MEPs and LSKs were isolated from naive mice, and LSKs, CD86− LSKs, and CD86+ LSKs were isolated from mice 24 hours after the LPS injection. These cells were cultured in methylcellulose medium for 10 days, and cell expansion and TER119+-cell generation were assessed by FCM. Statistical analyses are shown in panel B; n = 6 per group. (D) Gata1 mRNA expression in LKs, LSKs, CD86− LSKs, and CD86+ LSKs before and after LPS treatment. Cells were isolated from the BM of WT mice before and/or 24 hours after LPS treatment, and gene expression was evaluated by real-time polymerase chain reaction (PCR); n = 4 per group. (E) Tracing Cx3cr1-expressing cells after LPS treatment. Two days after tamoxifen treatment (2 mg/mouse) in Cx3cr1-CreER/tdTom mice, LPS (5 mg/ kg) or PBS was injected as shown in supplemental Figure 1E. Twelve hours after LPS treatment, frequencies of Sca-1+ or CD86+ cells in tdTomato+ cells were examined. Representative FCM plots of Lin−c-kit+ BM cells and statistical analysis are shown in the left and right panels, respectively; n = 3 per group. The numbers on FCM plots indicate the frequencies of the gated populations. N.S., not significant. P > .05; *P < .05, χ2 test (A) or 1-way ANOVA (C-E). Data are representative of 2 independent experiments (A-C) or 3 independent experiments (D and E) (error bars in panels A, C, and E represent SEM).
CD86+ LSKs do not show a LK signature. (A) Ratio between CD86− and CD86+ cells in LSKs before and 24 hours after LPS treatment; n = 3 per group. (B-C) MEPs and LSKs were isolated from naive mice, and LSKs, CD86− LSKs, and CD86+ LSKs were isolated from mice 24 hours after the LPS injection. These cells were cultured in methylcellulose medium for 10 days, and cell expansion and TER119+-cell generation were assessed by FCM. Statistical analyses are shown in panel B; n = 6 per group. (D) Gata1 mRNA expression in LKs, LSKs, CD86− LSKs, and CD86+ LSKs before and after LPS treatment. Cells were isolated from the BM of WT mice before and/or 24 hours after LPS treatment, and gene expression was evaluated by real-time polymerase chain reaction (PCR); n = 4 per group. (E) Tracing Cx3cr1-expressing cells after LPS treatment. Two days after tamoxifen treatment (2 mg/mouse) in Cx3cr1-CreER/tdTom mice, LPS (5 mg/ kg) or PBS was injected as shown in supplemental Figure 1E. Twelve hours after LPS treatment, frequencies of Sca-1+ or CD86+ cells in tdTomato+ cells were examined. Representative FCM plots of Lin−c-kit+ BM cells and statistical analysis are shown in the left and right panels, respectively; n = 3 per group. The numbers on FCM plots indicate the frequencies of the gated populations. N.S., not significant. P > .05; *P < .05, χ2 test (A) or 1-way ANOVA (C-E). Data are representative of 2 independent experiments (A-C) or 3 independent experiments (D and E) (error bars in panels A, C, and E represent SEM).
In contrast to strains expressing the Ly6.2 haplotype (eg, B6 mice), mice having the Ly6.1 haplotype (eg, BALB/c mice), poorly express Sca-1 in steady state.32 Consistently, L86Ks, but not LSKs, were successfully detected in the BM of naive BALB/c mice (supplemental Figure 6F). After LPS treatment, the number of LSKs was dramatically increased, due to the contaminating LKs, whereas the number of L86Ks was not increased (supplemental Figure 6F-G). Compared with CD86− LSKs, CD86+ LSKs showed significantly higher expansion levels and a lower capacity to generate TER119+ cells (supplemental Figure 6H). These results suggested that CD86 serves to distinguish HSPCs in LPS-treated mice regardless of the Ly6 haplotype. We also examined if CD86 serves to distinguish HSPCs in C57BL/6 mice treated with polyinosinic-polycytidylic acid sodium salt (poly(I:C)). Although poly(I:C) treatment strongly decreased the Lin− population (supplemental Figure 6I), the number of L86Ks was significantly lower than that of LSKs (supplemental Figure 6I-J). Importantly, the CD86+ LSKs from poly(I:C)-treated mice showed expansion levels comparable to LSKs from naive mice (supplemental Figure 6K). In contrast, the expansion capacity of total LSKs and CD86− LSKs from poly(I:C)-treated mice was significantly impaired (supplemental Figure 6K), suggesting LK contamination in the LSK fraction. Thus, CD86 serves as an alternative marker for Sca-1 also in poly(I:C)-treated mice.
CD86-based analysis reveals bona fide hematopoietic responses against infection and inflammation
It is important to understand exactly how biological stress affects the hematopoietic responses. We compared the kinetics of LSKs and L86Ks after LPS injection. The number of LSKs quickly reached the peak and increased to sixfold within 18 hours, followed by a decrease, but the number remained higher than the basal level, even 72 hours after LPS treatment (Figure 4A). In contrast, the L86K fraction showed much reduced expansion compared with LSKs, and the number of L86Ks returned to the basal level within 36 hours (Figure 4A). Thus, quantitative abnormalities of LSKs detected by the Sca-1–based analysis might be canceled in the CD86-based analysis. A recent Sca-1–based analysis indicated that a single injection of LPS strongly diminished the reconstitution capacity of LSKs.18 Because the expansion capacity of L86Ks, but not LSKs, obtained from LPS-treated mice was not impaired compared with naive LSKs (Figure 3B), we hypothesized that the contaminating downstream progenitors into the LSK fraction reduced the reconstitution capacity of LSKs. Indeed, CD34− LT-HSCs in LPS-treated mice contained CD86− cells with a lower expansion capacity compared with CD86+ cells (supplemental Figure 7A-B), implying that they are downstream progenitors. To examine this possibility, we generated chimeric mice by transplanting an equivalent mixture of LSKs from naive mice and LSKs or CD86+ LSKs from LPS-treated mice into lethally irradiated recipient mice (supplemental Figure 8). LSKs from LPS-treated mice showed significantly lower chimerism compared with LSKs from naïve mice. In contrast, the chimerism of CD86+ LSKs from LPS-treated mice was almost the same as that of LSKs from naive mice (Figure 4B-C), suggesting that the impaired BM reconstitution by LSKs from mice treated only once with LPS is likely due to the contamination of Sca-1+ LKs into the LSK fraction rather than LSK exhaustion. Indeed, the LK contamination significantly decreased the frequency of CD34− LT-HSCs in LSKs of LPS-treated mice compared with that in LSKs from naive mice, although there was no difference between LSKs from naive mice and CD86+ LSKs from LPS-treated mice (Figure 4D). Compared with Sca-1–based analysis, CD86-based analysis showed that the numbers of MPP2s and MMP3s were much lower, whereas those of CMPs and GMPs were conversely increased after LPS-treatment, due to the prevention of the LK contamination (supplemental Figure 9A-C). In LPS-treated mice, CD86-based analysis confirmed the myeloid reprograming of MPP4 (supplemental Figure 9D)33,34 and revealed that the capacity of GMPs to generate CD11b+ myeloid cells was enhanced (supplemental Figure 9E).
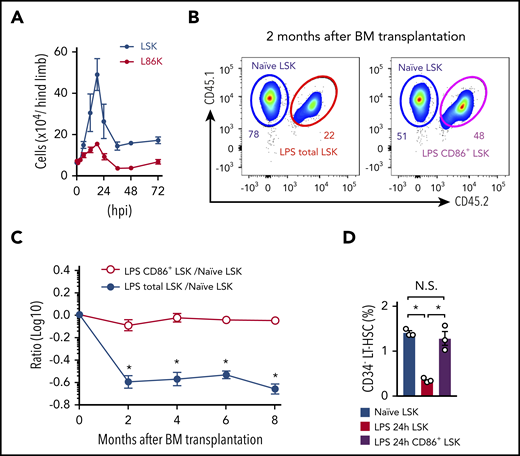
Analysis with CD86 reveals kinetics and function of LSKs during infection. (A) Cell kinetics of LSKs and L86Ks after treatment with LPS (5 mg/kg); n = 3 per time-point. (B-C) Naive LSKs (CD45.1+) were mixed with LSKs or CD86+ LSKs (CD45.1+CD45.2+) obtained from mice 24 hours after LPS treatment at a 1:1 ratio and transferred into lethally irradiated CD45.2+ recipient mice as shown in supplemental Figure 8. The ratio of CD45.1+ and CD45.1+CD45.2+ donor cells in the circulating blood was examined for 8 months (n = 8, LPS total LSKs vs naive LSKs; n = 7, LPS CD86+ LSKs vs naive LSKs). Representative FCM plots for circulating leukocytes 2 months after cell transfer are shown in panel B. (D) Frequencies of CD34− LT-HSCs in LSKs and CD86+ LSKs were examined before and 24 hours after LPS treatment. The numbers on the FCM plots indicate the frequencies of the gated populations. *P < .05, 1-way ANOVA. Data are representative of 2 independent experiments (A and D) or from 2 independent experiments (B and C) (error bars in panels A, C, and D represent SEM).
Analysis with CD86 reveals kinetics and function of LSKs during infection. (A) Cell kinetics of LSKs and L86Ks after treatment with LPS (5 mg/kg); n = 3 per time-point. (B-C) Naive LSKs (CD45.1+) were mixed with LSKs or CD86+ LSKs (CD45.1+CD45.2+) obtained from mice 24 hours after LPS treatment at a 1:1 ratio and transferred into lethally irradiated CD45.2+ recipient mice as shown in supplemental Figure 8. The ratio of CD45.1+ and CD45.1+CD45.2+ donor cells in the circulating blood was examined for 8 months (n = 8, LPS total LSKs vs naive LSKs; n = 7, LPS CD86+ LSKs vs naive LSKs). Representative FCM plots for circulating leukocytes 2 months after cell transfer are shown in panel B. (D) Frequencies of CD34− LT-HSCs in LSKs and CD86+ LSKs were examined before and 24 hours after LPS treatment. The numbers on the FCM plots indicate the frequencies of the gated populations. *P < .05, 1-way ANOVA. Data are representative of 2 independent experiments (A and D) or from 2 independent experiments (B and C) (error bars in panels A, C, and D represent SEM).
We also focused on the development of erythrocytes early after LPS injection. CD86-based analysis revealed that the number of MEPs increased during the first 18 hours after LPS treatment and then decreased (Figure 5A-B). In contrast, Sca-1–based analysis could not detect the early increasing phase, and the number of MEPs began to decrease soon after the LPS injection (Figure 5B). Consistent with the increased MEPs, erythropoiesis was activated during the first 18 to 24 hours after LPS injection, as indicated by the increase in proerythroblast production, (Figure 5C), hemoglobin in the BM hemolysate (Figure 5D), and erythrocyte number (TER119+CD45−) in the BM, blood, and spleen (Figure 5E). Similar results were obtained in a CLP induction model (supplemental Figure 10A-D). The activated erythropoiesis was also supported by the enhanced expression of Gata1 in CMPs after LPS injection in vivo (Figure 5F), which was consistent with the elevated production of TER119+ erythrocytes (Figure 5G). Gata1 expression was also increased by ex vivo LPS stimulation of CMPs or LKs (Figure 5H; supplemental Figure 10E-F). Upon LPS injection, the number of erythrocytes reached the peak at 18 hours in the BM and then decreased to the basal level by 72 hours (Figure 5D, E), which might reflect the egress of erythrocytes from the BM to the periphery, such as the blood and spleen. Indeed, the number of erythrocytes began to increase in the blood and spleen 24 hours after LPS injection (Figure 5E). Infection and inflammation often cause hemolysis and/or hemolytic anemia.35,36 Therefore, we next focused on the stress resistance of red blood cells (RBCs). As CD86-based analysis newly identified an early activation phase of erythropoiesis in the BM, we collected CD71−TER119+CD45−FSClow cells from the BM of mice at 18 hours after LPS injection, the peak of erythropoiesis. The CD71−TER119+CD45−FSClow cells had the morphological characteristics of mature RBCs (mRBCs) (ie, smaller cell size and losing the nucleus even after LPS treatment; supplemental Figure 10G), confirming that the cells were not RBC precursors. After LPS treatment, the frequency of mRBCs in total TER119+CD45− erythrocytes was elevated (Figure 5I). Compared with mRBCs from naive mice, the mRBCs generated under LPS-mediated inflammation showed significantly higher amounts of hemoglobin (Figure 5J), significantly lower apoptosis induction after 48 hours of culture (Figure 5K-L), and stronger resistance against hypo-osmolality (Figure 5M-N). In this context, LPS-induced early erythropoiesis with MEP increase was also observed in Stat1−/− mice, but not WT mice, using Sca-1–based analysis (Figure 5O-Q), indicating that these events can occur independently of IFN signaling and conventional Sca-1–based analysis is available when the IFN signal is limited. This experimental example is a thioglycolate-induced peritonitis model, in which neither IFN expression nor Sca-1 upregulation on LKs was induced (supplemental Figure 10H-L). Nevertheless, Sca-1–based analysis confirmed the increased levels and numbers of hemoglobin, erythrocytes, and MEPs in the BM (supplemental Figure 10M-N). Taken together, CD86-based analysis enables us to assess bona fide hematopoietic responses under stress conditions with IFN production, whereas Sca-1–based analysis can be used for IFN-free stress conditions.
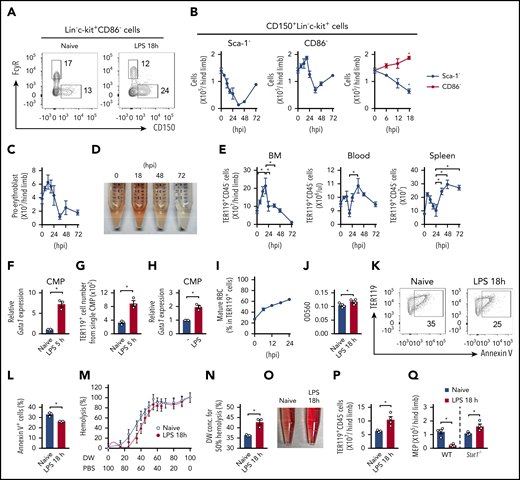
Analysis based on CD86 expression identifies the activation of erythropoiesis early after infection. (A) Population sizes of MEPs (CD150+FcγR− LKs) and GMPs (CD150−FcγRhigh LKs) before and 18 hours after LPS treatment (5 mg/kg). Representative FCM plots of the Lin−c-kit+CD86− fraction are shown. (B) Kinetic analysis of CD150+ cells (MEPs) in the Lin−c-kit+Sca-1− (left panel) and Lin−c-kit+CD86− fractions (middle panel) during the 72 hours after LPS treatment. Data during the first 18 hours (shown in left and middle panels) were merged in the right panel (numbers of MEPs in the Lin−c-kit+Sca-1− and Lin−c-kit+CD86− fractions are shown as black and red lines, respectively); n = 3 per time point. (C) Kinetic analysis of the number of proerythroblasts (CD71+TER119int) during the 72 hours after LPS treatment; n = 3 per time point. (D) Representative image of hemolysates of the BM before and after LPS treatment. (E) Kinetic analysis of TER119+CD45− erythrocytes in the BM (left panel), blood (middle panel), and spleen (right panel) after LPS treatment; n = 3 per time-point. (F) Gata1 mRNA expression in CMPs obtained before and 5 hours after LPS treatment. Gene expression was examined by real-time PCR; n = 3 per group. (G) CMPs, isolated as in panel F, were cultured in methylcellulose medium for 10 days, and the number of TER119+ cells generated was examined by FCM; n = 3 per group. (H) Gata1 mRNA expression in CMPs stimulated with LPS. CMPs were isolated from naive CD45.1+ mice and cocultured with CD45.2+ total BM cells in the absence or presence of LPS (100 ng/mL) for 12 hours. CD45.1+ CMPs were sorted again, and gene expression was examined by real-time PCR; n = 3 per group. (I) Kinetics for the frequency of mRBCs (CD45−TER119+CD71−FSClow) in TER119+ cells after LPS treatment; n = 3 per time-point. (J) Relative amount of hemoglobin in mRBCs obtained before and 18 hours after LPS treatment. The amount of hemoglobin was evaluated by measuring the optical density (OD)560 of the hemolysates; n = 5 per group. (K-L) mRBCs were isolated from the BM of WT mice before and 18 hours after LPS treatment and were cultured in 20% FBS-containing RPMI medium for 48 hours. The cells were harvested, and the ratio of Annexin V+ apoptotic cells was examined by FCM. Representative FCM plots are shown in panel L; n = 3 per group. (M-N) TER119+CD45− erythrocytes were isolated from the BM before and 18 hours after LPS treatment and incubated with the indicated concentration of PBS for 30 minutes. Hemolysis was evaluated by measuring the OD560 of the supernatants. Data are statistically analyzed in panel N. DW, distilled water. (O-Q) Activation of erythropoiesis in Stat1−/− mice after LPS treatment. Representative image of hemolysates (O) and the numbers of erythrocytes (P) and MEPs (Q) in WT and/or Stat1−/− mice before and 18 hours after LPS treatment. The numbers on FCM plots indicate the frequencies of the gated populations. *P < .05, Student t test (F-H, J, L, N, P, and Q) or 1-way ANOVA (D and E). Data are representative of 2 (F-H and K-Q) or 3 (A-E and I) independent experiments or from 2 independent experiments (J). Error bars in panels B, C, E-H, and J-N represent SEM.
Analysis based on CD86 expression identifies the activation of erythropoiesis early after infection. (A) Population sizes of MEPs (CD150+FcγR− LKs) and GMPs (CD150−FcγRhigh LKs) before and 18 hours after LPS treatment (5 mg/kg). Representative FCM plots of the Lin−c-kit+CD86− fraction are shown. (B) Kinetic analysis of CD150+ cells (MEPs) in the Lin−c-kit+Sca-1− (left panel) and Lin−c-kit+CD86− fractions (middle panel) during the 72 hours after LPS treatment. Data during the first 18 hours (shown in left and middle panels) were merged in the right panel (numbers of MEPs in the Lin−c-kit+Sca-1− and Lin−c-kit+CD86− fractions are shown as black and red lines, respectively); n = 3 per time point. (C) Kinetic analysis of the number of proerythroblasts (CD71+TER119int) during the 72 hours after LPS treatment; n = 3 per time point. (D) Representative image of hemolysates of the BM before and after LPS treatment. (E) Kinetic analysis of TER119+CD45− erythrocytes in the BM (left panel), blood (middle panel), and spleen (right panel) after LPS treatment; n = 3 per time-point. (F) Gata1 mRNA expression in CMPs obtained before and 5 hours after LPS treatment. Gene expression was examined by real-time PCR; n = 3 per group. (G) CMPs, isolated as in panel F, were cultured in methylcellulose medium for 10 days, and the number of TER119+ cells generated was examined by FCM; n = 3 per group. (H) Gata1 mRNA expression in CMPs stimulated with LPS. CMPs were isolated from naive CD45.1+ mice and cocultured with CD45.2+ total BM cells in the absence or presence of LPS (100 ng/mL) for 12 hours. CD45.1+ CMPs were sorted again, and gene expression was examined by real-time PCR; n = 3 per group. (I) Kinetics for the frequency of mRBCs (CD45−TER119+CD71−FSClow) in TER119+ cells after LPS treatment; n = 3 per time-point. (J) Relative amount of hemoglobin in mRBCs obtained before and 18 hours after LPS treatment. The amount of hemoglobin was evaluated by measuring the optical density (OD)560 of the hemolysates; n = 5 per group. (K-L) mRBCs were isolated from the BM of WT mice before and 18 hours after LPS treatment and were cultured in 20% FBS-containing RPMI medium for 48 hours. The cells were harvested, and the ratio of Annexin V+ apoptotic cells was examined by FCM. Representative FCM plots are shown in panel L; n = 3 per group. (M-N) TER119+CD45− erythrocytes were isolated from the BM before and 18 hours after LPS treatment and incubated with the indicated concentration of PBS for 30 minutes. Hemolysis was evaluated by measuring the OD560 of the supernatants. Data are statistically analyzed in panel N. DW, distilled water. (O-Q) Activation of erythropoiesis in Stat1−/− mice after LPS treatment. Representative image of hemolysates (O) and the numbers of erythrocytes (P) and MEPs (Q) in WT and/or Stat1−/− mice before and 18 hours after LPS treatment. The numbers on FCM plots indicate the frequencies of the gated populations. *P < .05, Student t test (F-H, J, L, N, P, and Q) or 1-way ANOVA (D and E). Data are representative of 2 (F-H and K-Q) or 3 (A-E and I) independent experiments or from 2 independent experiments (J). Error bars in panels B, C, E-H, and J-N represent SEM.
Discussion
In this study, using conventional Sca-1–based analysis, we demonstrated that nonnegligible levels of LKs are considered to be LSKs under inflammation and infection. To overcome these problems, we propose a CD86-based analysis, which can minimize these risks and allow us to accurately analyze inflammation- and infection-triggered hematopoietic responses. Indeed, the CD86-based analysis revealed the intact reconstitution capacity of LSKs and the transient activation of erythropoiesis early after infection, which was not detected by Sca-1–based analysis. Biological stresses induce extramedullary erythropoiesis.37 In our results, the number of erythrocytes in the blood and spleen increased between 18 and 24 hours and then dramatically decreased in the BM, but not the spleen, suggesting the contribution of early-phase BM erythropoiesis to the increase in circulating RBCs. We also found that LPS treatment generated unique erythrocytes with more hemoglobin and higher resistance against apoptosis and hemolysis (Figure 5K-N). Since RBCs are often broken by pathogen-derived hemolytic toxins38-40 or hemophagocytosis by activated macrophages and/or dendritic cells,41,42 the BM erythropoiesis driven by infection may contribute to the replenishment of the lost RBCs with stronger RBCs during the latter phase of infection.
Interestingly, LT-HSCs in the BM of naive mice consist of major CD86+ and minor CD86− populations.43 Compared with CD86+ LT-HSCs, CD86− LT-HSCs show a nearly 10 times lower BM reconstitution capacity and lack lymphocyte differentiation potential,43 implying that they are downstream progenitors. \In line with this finding, the colony-formation capacity of CD86−CD34− LT-HSCs was significantly lower than that of CD86+CD34− LT-HSCs in LPS-treated mice (supplemental Figure 7). Thus, CD86-based analysis may serve to exclude those CD86− progenitors from the LT-HSC fraction. Previously, Takizawa and colleagues reported that LPS stimulation induces HSC exhaustion.43 The discrepancy between our results (Figure 4B-C) and theirs could be explained by differences in the experimental settings. In Takizawa et al’s study, mice were repeatedly treated with LPS (ie, prolonged infection or chronic inflammation) and analyzed 1 to 4 weeks after the last LPS treatment. We performed a single injection of LPS and examined hematopoietic responses 6 to 24 hours later. At least in our setting, a single injection of LPS does not seem to induce HSC exhaustion.
IFN can be upregulated not only in bacterial and viral infections but also in autoimmune and autoinflammatory disorders.44,45 Various therapeutic treatments may skew IFN production or IFN-mediated signaling.46,47 Aging or particular gene modifications may also alter the basal IFN production level.48-50 Given that Sca-1 is a representative ISG and its expression is upregulated in all LK subpopulations, Sca-1–based analysis of hematopoietic responses under stress conditions could vary and lead to misinterpretations. Instead, we propose that CD86-based analysis is applicable to understanding the true hematopoietic response under stress conditions with IFN production, which will be useful not only to review previous knowledge but also to obtain new knowledge.
For original data, please e-mail the corresponding author.
The online version of this article contains a data supplement.
The publication costs of this article were defrayed in part by page charge payment. Therefore, and solely to indicate this fact, this article is hereby marked “advertisement” in accordance with 18 USC section 1734.
Acknowledgments
The authors thank N. Onai for teaching intra-BM administration, and A. Kinoshita for helping with experiments for the CLP model.
This work was supported by the Inamori Foundation, the Nakajima Foundation, the Takeda Science Foundation, the Mochida Memorial Foundation for Medical and Pharmaceutical Research, the Ichiro Kanehara Foundation, the Japan Society for the Promotion of Science (KAKENHI), and the Cooperation Program between Tokyo Medical and Dental University and Sony IP&S.
Authorship
Contribution: M. Kanayama planned and performed the majority of experiments; Y.I. helped with cell kinetics analysis; Y.Y. helped with t-SNE analysis; S.K. helped maintain the mouse strains and performed all of the genotyping; T. Shin helped with experiments for the CLP model; S.I. performed parts of the cell kinetic analysis; T. Sato and M. Kajita helped maintain the mouse strains and gave advices for this study; and M. Kanayama and T.O. conceived of the project and wrote the manuscript.
Conflict-of-interest disclosure: Y.Y. is an employee of Sony IP&S. T.O. has received research funding from Sony IP&S. The remaining authors declare no competing financial interests.
Correspondence: Toshiaki Ohteki, Department of Biodefense Research, Medical Research Institute, Tokyo Medical and Dental University, 1-5-45, Yushima, Bunkyo-ku, Tokyo 113-8510, Japan; e-mail: ohteki.bre@mri.tmd.ac.jp.

This feature is available to Subscribers Only
Sign In or Create an Account Close Modal