

Key Points
Approximately 1 of 10 patients with MM displays MDS-associated phenotypic abnormalities at diagnosis and have inferior survival.
MDS-associated phenotypic abnormalities modify the tumor microenvironment and induce greater risk of hematologic toxicity from treatment.

Abstract
Risk of developing myelodysplastic syndrome (MDS) is significantly increased in both multiple myeloma (MM) and monoclonal gammopathy of undetermined significance, suggesting that it is therapy independent. However, the incidence and sequelae of dysplastic hematopoiesis at diagnosis are unknown. Here, we used multidimensional flow cytometry (MFC) to prospectively screen for the presence of MDS-associated phenotypic alterations (MDS-PA) in the bone marrow of 285 patients with MM enrolled in the PETHEMA/GEM2012MENOS65 trial (#NCT01916252). We investigated the clinical significance of monocytic MDS-PA in a larger series of 1252 patients enrolled in 4 PETHEMA/GEM protocols. At diagnosis, 33 (11.6%) of 285 cases displayed MDS-PA. Bulk and single-cell–targeted sequencing of MDS recurrently mutated genes in CD34+ progenitors (and dysplastic lineages) from 67 patients revealed clonal hematopoiesis in 13 (50%) of 26 cases with MDS-PA vs 9 (22%) of 41 without MDS-PA; TET2 and NRAS were the most frequently mutated genes. Dynamics of MDS-PA at diagnosis and after autologous transplant were evaluated in 86 of 285 patients and showed that in most cases (69 of 86 [80%]), MDS-PA either persisted or remained absent in patients with or without MDS-PA at diagnosis, respectively. Noteworthy, MDS-associated mutations infrequently emerged after high-dose therapy. Based on MFC profiling, patients with MDS-PA have altered hematopoiesis and T regulatory cell distribution in the tumor microenvironment. Importantly, the presence of monocytic MDS-PA at diagnosis anticipated greater risk of hematologic toxicity and was independently associated with inferior progression-free survival (hazard ratio, 1.5; P = .02) and overall survival (hazard ratio, 1.7; P = .01). This study reveals the biological and clinical significance of dysplastic hematopoiesis in newly diagnosed MM, which can be screened with moderate sensitivity using cost-effective MFC.
Introduction
Patients with multiple myeloma (MM) are living longer with increasingly effective therapies, but long-term complications, including second primary malignancies (SPMs), have emerged as an important challenge.1-4 Accordingly, a large meta-analysis confirmed that patients who received lenalidomide and oral melphalan had an increased risk of developing hematologic SPMs.5 These were mainly cases of myelodysplastic syndrome (MDS) or acute myeloid leukemia (AML).6
Increased risk of MDS and AML following MM has been acknowledged for many decades.7 In a Swedish population-based study, patients with MM had an 11.5-fold risk of developing MDS/AML that remained stable between 1986 and 2005, suggesting that such risk was present before the introduction of high-dose melphalan and immunomodulatory drugs. Furthermore, an excess of MDS/AML was observed in subjects with monoclonal gammopathy of undetermined significance (MGUS) who had never developed MM and, therefore, had not received anti-MM therapy. Another population-based analysis of 605 patients with MGUS and 16 710 control subjects living in Olmsted County, Minnesota,8 confirmed an increased risk of developing MDS (although not AML) following MGUS. Thus, patients with benign plasma cell (PC) disorders also have an intrinsically high risk of developing MDS. Interestingly, both studies showed that subjects with immunoglobulin M MGUS (where clonality is mostly confined to the B-cell compartment rather than PCs)9 had no significantly increased risk of developing MDS. These findings suggest a potential link between the emergence of clonal PCs in the bone marrow (BM) and progressive dysplasia. Notwithstanding, most studies have focused on the clinical diagnosis of MDS after therapy without investigating whether dysplastic features are already detectable before the onset of MDS and, eventually, before initiation of treatment.
A decade ago, Barlogie et al10 described the presence of MDS-associated cytogenetic abnormalities (MDS-CA) after high-dose therapy (HDT) in 4% of patients with MM. Subsequently, the Arkansas group showed that these cytogenetic alterations often precede clinical MDS and/or AML.11 More recent studies used next-generation sequencing (NGS) to show the presence of clonal hematopoiesis in the apheresis of 5% of patients with MM before autologous stem cell transplantation (ASCT).12 Preliminary studies based on multidimensional flow cytometry have shown the presence of MDS-associated phenotypic abnormalities (MDS-PA) in up to 13% of patients with MM, and a significant proportion of these cases with either multiple or even isolated MDS-PA at diagnosis may display genetic and/or morphologic evidence of clonal hematopoiesis.13,14 However, whether dysplastic hematopoiesis at the time of diagnosis has clinical consequences remains unknown; if it does, it could affect a considerable number of patients with MM given their median age at diagnosis (70 years)15 and the high incidence of clonal hematopoiesis of indeterminate potential (CHIP) in elderly individuals.16
Here, we show that MDS-PA are detectable in ∼1 of 10 patients with newly diagnosed MM, which is often associated with underlying clonal hematopoiesis that usually persists after HDT/ASCT. Strikingly, patients carrying MDS-PA are at greater risk of developing hematologic toxicity during treatment and have inferior survival unless immunomodulatory drugs are used during maintenance therapy.
Patients and methods
Study design
Screening of MDS-PA was performed prospectively in 285 patients with newly diagnosed MM, enrolled in the GEM2012MENOS65 clinical trial (#NCT0191652). This open-label phase 3 study included 6 induction cycles of bortezomib, lenalidomide, and dexamethasone (VRD); ASCT conditioned with busulfan and melphalan or melphalan 200 mg/m2 HDT; and 2 consolidation cycles of VRD. Patients were then enrolled in the PETHEMA/GEM2014MAIN clinical trial (#NCT02406144), which randomized patients to receive maintenance therapy with lenalidomide and dexamethasone (Rd) or Rd plus ixazomib for 2 years; patients then continued maintenance therapy with Rd for 3 additional years if positive for minimal residual disease (MRD) or stopped maintenance therapy if they were MRD negative. In addition, monocytic MDS-PA were retrospectively evaluated in 967 patients enrolled in three PETHEMA/GEM clinical trials that included maintenance therapy: GEM2000 (N = 475) and GEM2005MENOS65 (N = 275) for transplant-eligible patients, and GEM2005MAS65 (N = 217) for transplant-ineligible patients. Study designs have been described elsewhere17-19 and are illustrated in supplemental Figure 1 (available on the Blood Web site), which also includes the median follow-up of each protocol. Each study site’s independent ethics committee approved the protocol and informed consent forms (required) prior to patient enrollment. All studies were conducted per the ethical principles of the Declaration of Helsinki.
Screening of MDS-PA
MDS-PA were prospectively evaluated in the GEM2012MENOS65 clinical trial, within 24 hours after collection of EDTA-anticoagulated BM aspirates. Briefly, the EuroFlow lyse-wash-and-stain sample preparation protocol (adjusted to 106 nucleated cells) together with the first combination of the EuroFlow next-generation flow antibody panel (CD138-BV421, CD27-BV510, CD38-FITC, CD56-PE, CD45-PerCPCy5.5, CD19-PECy7, CD117-APC, and CD81-APCH7)20 were used for assessment of PC clonality21 and also to quantify the percentage of CD56+ monocytes. Monocytic MDS-PA were defined if ≥50% of the total monocytes expressed CD56 (supplemental Figure 2). An additional combination (HLADR-PacB, CD45-OC515, CD36-FITC, CD13-PE, CD34-PerCPCy5.5, CD117-PECy7, CD11b-APC, and CD71-APCH7) was specifically designed to assess MDS-PA in the neutrophil and erythroid lineages based on the detection of altered maturation phenotypic pathways as previously described.13,14 In 84 of the 285 patients enrolled in the GEM2012MENOS65 trial and screened for MDS-PA at diagnosis, an additional evaluation (using both monoclonal antibody combinations described earlier) was performed in BM aspirates collected for response assessment at day 100 after HDT/ASCT, whenever sufficient sample was available after performing next-generation flow–MRD assessment as described elsewhere.22
In 47 of the 285 patients, another evaluation was performed during maintenance therapy. An additional series of 59 consecutive patients newly diagnosed with MM were analyzed to validate potential associations between presence of MDS-PA and altered hematopoiesis. Data acquisition was performed in a FACSCanto II flow cytometer (BD Biosciences, San Jose, CA) using the FACSDiva 6.1 software (BD Biosciences). Data analysis was performed by using the Infinicyt software (Cytognos SL, Salamanca, Spain). Monocytic MDS-PA were also evaluated in patients enrolled in the GEM2000, GEM2005MENOS65, and GEM2005MAS65 clinical trials, based on the 4-color combination (CD38-FITC, CD56-PE, CD19-PerCPCy5.5, and CD45-APC) used for assessment of clonality at diagnosis.23
Profiling the tumor microenvironment
Based on the antibody combination defined earlier (HLADR-PacB, CD45-OC515, CD36-FITC, CD13-PE, CD34-PerCPCy5.5, CD117-PECy7, CD11b-APC, and CD71-APCH7) and a T cell–oriented combination evaluated in 42 patients after HDT/ASCT (CD4-PacB, PD1-BV510, CD45RA-FITC, CD127-PE, CD8-PerCPCy5.5, TCRγδ-PECy7, CD25-APC, and CD197-APCH7), principal component analyses were performed to unbiasedly define all cellular clusters that were identifiable with these antibody combinations, and compare their distribution in the BM tumor microenvironment of patients with or without MDS-PA. Namely, the first combination allowed the systematic identification of 14 different cell subsets; the second antibody combination allowed the systematic identification of 14 different T-cell subsets. In addition, expression levels of CD127 and PD-1 were evaluated in each T-cell subset. Data acquisition was performed in a FACSCanto II Flow Cytometer, and data analysis was performed by using the Infinicyt software.
Fluorescence-activating cell sorting
To establish the relation between the presence of MDS-PA and clonal hematopoiesis, a FACSAria II Flow Cytometer (BD Biosciences) was used to sort CD34+ hematopoietic progenitor cells (HPCs) from 67 patients (40 enrolled in the GEM2012MENOS65 trial) with (n = 26) or without (n = 41) MDS-PA. In the former group, the corresponding cell lineage(s) with MDS-PA were also isolated (Figure 1A).
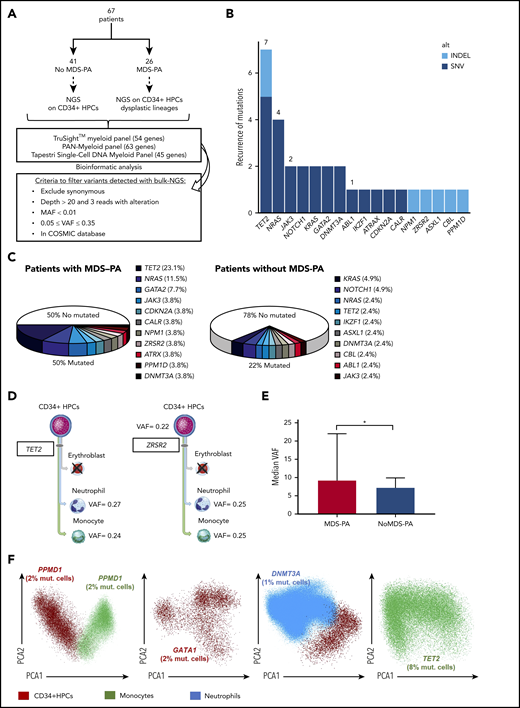
MDS-associated variants in patients newly diagnosed with MM. (A) Study design. (B) Frequency of mutations identified in a total of 95 cell types/samples from 67 patients: 41 without MDS-PA in whom CD34+ HPCs were selected, and 26 with MDS-PA in whom CD34+ HPCs and respective lineages displaying MDS-PA were isolated. Mutations were broken down according to the type of variant. (C) Frequency of detectable mutations in patients with or without MDS-PA. (D) Patients with mutations present in both CD34+ HPCs and mature dysplastic cells (#746, #810). (E) Median variant allele frequency (VAF) in patients with or without MDS-PA. (F) Mutations detected by single-cell DNA sequencing in CD34+ HPCs and/or dysplastic myeloid lineages from 4 patients with MDS-PA. *P ≤ .05. COSMIC, Catalogue Of Somatic Mutations In Cancer; MAF, mutant allele frequency; mut., mutated; SNV, single nucleotide variant.
MDS-associated variants in patients newly diagnosed with MM. (A) Study design. (B) Frequency of mutations identified in a total of 95 cell types/samples from 67 patients: 41 without MDS-PA in whom CD34+ HPCs were selected, and 26 with MDS-PA in whom CD34+ HPCs and respective lineages displaying MDS-PA were isolated. Mutations were broken down according to the type of variant. (C) Frequency of detectable mutations in patients with or without MDS-PA. (D) Patients with mutations present in both CD34+ HPCs and mature dysplastic cells (#746, #810). (E) Median variant allele frequency (VAF) in patients with or without MDS-PA. (F) Mutations detected by single-cell DNA sequencing in CD34+ HPCs and/or dysplastic myeloid lineages from 4 patients with MDS-PA. *P ≤ .05. COSMIC, Catalogue Of Somatic Mutations In Cancer; MAF, mutant allele frequency; mut., mutated; SNV, single nucleotide variant.
Next-generation sequencing
The TruSight Myeloid Sequencing Panel (Illumina, San Diego, CA) and a customized pan-myeloid panel (SOPHiA GENETICS, Saint Sulpice, Switzerland) were used to detect MDS-associated single nucleotide variants and indels in 40 patients enrolled in the GEM2012MENOS65 trial and 23 additional cases included to increase the sample size, respectively (supplemental Tables 1 and 2). DNA was extracted by using a QIAamp DNA Micro Kit (Qiagen, Hilden, Germany) and quantified by using a Qubit dsDNA BR Assay Kit Qubit 2.0 Fluorometer (Thermo Fisher Scientific, Waltham, MA); DNA quality was assessed by using the DNA Genomic Kit on Tape Station 4100 (Agilent Technologies, Santa Clara, CA). Sequencing libraries were prepared from 50 ng of DNA per sample, following manufacturer’s instructions, as described previously.24 All samples were sequenced in an Illumina MiSeq with a depth ≥250× in 80% of bases with the TruSight Myeloid Sequencing Panel and 1000× in 99.66% of bases with the pan-myeloid panel. Presence of clonal hematopoiesis was assessed by single-cell DNA sequencing in 4 patients with MDS-PA (supplemental Methods; supplemental Table 3).25 NGS data that support the findings of this study have been deposited in the European Genome Archive (EGA) with the following accession code: EGAS000010004378.
Variant calling
NGS data were processed by using the bioinformatics software HD Genome One (DREAMgenics, Oviedo, Spain), certified with IVD/CE-marking.26 Briefly, raw FASTQ files were evaluated using quality control checks from FastQC,27 and Trimmomatic28 was used to remove low-quality bases, adapters, and other technical sequences. Each FASTQ file was aligned to the human reference genome (GRCh37/hg19) using BWA-mem,29 generating sorted BAM files with SAMtools.30 Reads from the same libraries were then merged. Because samples were processed using an amplicon panel, optical and polymerase chain reaction duplicates were not removed. Single nucleotide variants and indels were identified by using a variation of the Sidrón algorithm31 with the following parameters: total read depth ≥6, mutated allele count ≥3, variant frequency ≥0.01, base quality ≥10, and mapping quality ≥20. Indel realignment was performed to correct underestimated allele frequencies. Variants were annotated by using several databases containing functional (Ensembl, CCDS, RefSeq, Pfam), populational (dbSNP, 1000 Genomes, ESP6500, ExAC), and cancer-related (Catalogue Of Somatic Mutations In Cancer, Release 87; ICGC, Release 27) information using 9 scores from algorithms for prediction of the impact caused by nonsynonymous variants on the structure and function of the protein (SIFT,32 PROVEAN,33 Mutation Assessor,34 Mutation Taster,35 LRT,36 MetaLR, MetaSVM,37 FATHMM, and FATHMM-MKL38 ) and 1 score (GERP++) for evolutionary conservation of the affected nucleotide.39 Only variants described in the Catalogue Of Somatic Mutations In Cancer database were selected and filtered considering the following parameters: only variants with protein effect (codon stop, splicing, frameshift, nonsynonymous, and indels), variants with a minimum coverage of 20 reads, and 3 reads with the alteration, minor allelic frequency <0.01 (1%), minimum variant allelic frequency cutoff of 0.05 (5%), and a maximum variant allelic frequency cutoff of 0.35 (35%) to exclude possible germinal polymorphisms. The workflow performs a subsequent analysis to filter out recurrent sequencing errors, which is based on documented sequencing biases associated with NGS platforms.40,41 All final variants were visually inspected in Integrated Genome Viewer.42
Cytogenetic characterization
Fluorescence in situ hybridization (FISH) was performed at diagnosis on immunomagnetically enriched CD138+ plasma cells from 789 of 1252 patients for IGH translocations, del(13q14), and del(17p13). Patients with t(4;14), t(14;16), and/or del(17p13) were classified as high risk (n = 154); others were classified as standard risk (n = 618).
Statistical analyses
The Mann-Whitney U nonparametric test was used to evaluate the statistical significance of differences observed between patients with or without MDS-PA. Survival probabilities according to the presence vs absence of MDS-PA at diagnosis were estimated by using the Kaplan-Meier method and compared with the use of a 2-sided stratified log-rank test. The effect of MDS-PA on the risk of progression-free survival (PFS) and overall survival (OS) (hazard ratio [HR]), with its 2-sided 95% confidence interval (CI), were estimated with a logistic Cox regression model. PFS was defined as the time from MDS-PA assessment until disease progression or death from any cause, and OS was defined as the time from MDS-PA assessment at diagnosis until death. A multivariate Cox proportional hazard model was developed to explore the independent effect on PFS and OS of prognostic factors defining the revised International Staging System (ISS): ISS stage, lactate dehydrogenase levels, and FISH cytogenetics. Statistical analyses were conducted by using Stata version 15.0 (StataCorp LP, College Station, TX), and SPSS version 20.0 (IBM SPSS Statistics, IBM Corp, Armonk, NY).
Results
Incidence of MDS-PA in patients newly diagnosed with MM
Prospective screening of MDS-PA in a series of 285 transplant-eligible patients with MM revealed that 33 (11.6%) had MDS-PA at diagnosis. Detailed immunophenotypic analysis per lineage showed that neutrophil-lineage cells were more frequently altered (22 of 285 [7.7%]), compared with nucleated red blood cells (10 of 285 [3.5%]) and monocytic cells (7 of 285 [2.5%]). Only 5 (1.8%) patients had 2 or more cell linages with MDS-PA at diagnosis.
Presence of MDS-PA and clonal hematopoiesis
To evaluate the correlation between the presence of MDS-PA and clonal hematopoiesis, we performed NGS of recurrently mutated genes in MDS in a total of 95 cell population samples isolated from 67 patients at diagnosis. In cases without MDS-PA (n = 41), only CD34+ HPCs were selected, whereas in patients with MDS-PA (n = 26), CD34+ HPCs were sorted along with the corresponding cell lineages displaying MDS-PA (Figure 1A). Overall, 31 mutations were detected, with TET2 the most frequently mutated gene (n = 8 cell type/samples), followed by NRAS (n = 4) (Figure 1B). Approximately one-fifth (9 of 41 [22%]) of cases without MDS-PA had detectable mutations in CD34+ HPCs; by contrast, one-half (13 of 26 [50%]) of patients with MDS-PA displayed variants in CD34+ HPCs and/or maturing cell lineages (Figure 1C; supplemental Table 4). Among patients with MDS-PA, most variants were detectable in CD34+ HPCs and less frequently in maturing cell lineages; however, in some cases, variants were present in both CD34+ HPCs and maturing cells (Figure 1D). All mutations were subclonal with a median variant allelic frequency of 8% (range, 5%-27%), and they were higher in patients with MDS-PA vs without (9% vs 7%, respectively; P = .04) (Figure 1E). The subclonal nature of mutations found in CD34+ HPCs and maturing cells was confirmed by using single-cell DNA sequencing (Figure 1F).
Dynamics of MDS-PA and clonal hematopoiesis before and after autologous transplant
In 84 of the 285 patients screened for MDS-PA at diagnosis, a subsequent analysis was performed at day 100 after HDT/ASCT in BM samples available following MRD assessment. In cases without MDS-PA at diagnosis (n = 68), 57 had no alterations after HDT/ASCT; in 11 cases, MDS-PA became detectable. Similarly, in 12 of 16 cases with MDS-PA at diagnosis, these persisted after HDT/ASCT, whereas in the remaining 4 patients, MDS-PA became undetectable (Figure 2A). We next investigated in 18 patients whether those mutation profiles detected at diagnosis persisted after stem cell mobilization and ASCT, as well as if new variants were emerging after HDT. Thus, CD34+ HPCs were selected in 7 patients without MDS-PA at day 100 after HDT/ASCT, whereas CD34+ HPCs and respective lineages displaying MDS-PA were isolated in 11 cases with MDS-PA; all underwent NGS at diagnosis (supplemental Table 5). Only 2 of the 18 patients displayed variants exclusively after HDT/ASCT, whereas in 5 cases, either the same or different mutations were detected in both time points. By contrast, in 11 of the 18 cases, variants detected at diagnosis became undetectable after HDT/ASCT (n = 4) or were never detectable at both time points (n = 7). Overall, both immunophenotypic and NGS analyses suggest that patients’ phenotype is mostly driven by the findings at diagnosis, and that MDS-associated mutations infrequently emerge after HDT/ASCT (Figure 2B).

Dynamics of MDS-PA and clonal hematopoiesis before and after autologous transplant. (A) Longitudinal screening of MDS-PA in 84 patients at diagnosis and at day 100 after HDT/ASCT. (B) Distribution of patients (n = 18) according to the detection of mutations in both time points. VRD, bortezomib, lenalidomide, and dexamethasone.
Dynamics of MDS-PA and clonal hematopoiesis before and after autologous transplant. (A) Longitudinal screening of MDS-PA in 84 patients at diagnosis and at day 100 after HDT/ASCT. (B) Distribution of patients (n = 18) according to the detection of mutations in both time points. VRD, bortezomib, lenalidomide, and dexamethasone.
Impact of an altered hematopoiesis on the tumor microenvironment
Based on principal component analyses of the multidimensional flow cytometry antibody combination described previously for screening of MDS-PA, 14 cell clusters were identified and quantified at diagnosis and after HDT/ASCT (Figure 3A). Interestingly, patients with MDS-PA displayed recurrent alterations in the granulocytic differentiation compared with cases without MDS-PA, with trends toward expanded CD34+CD117+ myeloid/erythroid precursors within HPCs (medians of 78% vs 72%, respectively; P = .05), increased myelocytes (medians of 17% vs 11%; P = .04), and decreased metamyelocytes (medians of 15% vs 28%; P = .003) within total neutrophils (Figure 3B-E). Deep characterization of patients’ T cells (14 cell clusters) (Figure 4A) showed differences in the regeneration of the T-cell compartment after stem cell transplantation. Namely, patients with MDS-PA exhibited reduced median frequencies of γδ naive T cells within total γδ T cells (5% vs 23%; P = .008) (Figure 4B) as well as central memory CD4 (25% vs 38%; P = .02) and CD8 (1% vs 6%; P = .025) T cells (Figure 4C), together with an expansion of CCR7-negative T regulatory cells (Tregs) at the expense of the CCR7-positive subset (64% vs 43%; P = .001) (Figure 4D) compared with cases without MDS-PA.
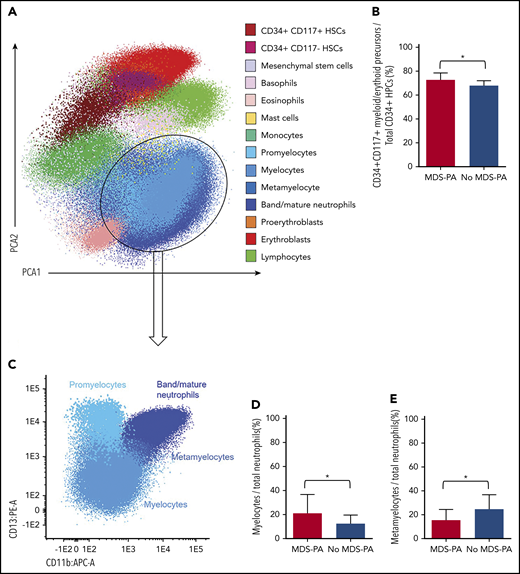
Altered hematopoiesis in patients with MDS-PA. (A) Identification of various immature and mature cell types in the tumor microenvironment of a representative patient, using multidimensional flow cytometry and principal component analysis (PCA): CD34+CD117+ myeloid/erythroid and CD34+CD117– lymphoid precursors within CD34+ HPCs, mesenchymal stem cells, basophils, eosinophils, mast cells, monocytes, 4 neutrophil subsets (promyelocyte, myelocyte, metamyelocyte, and band/mature neutrophils), 2 nucleated red blood cell subsets (proerythroblasts and erythroblasts), and lymphocytes. (B) Percentage of CD34+CD117+ myeloid/erythroid precursors within CD34+ HPCs in patients with (n = 33) or without (n = 243) MDS-PA at diagnosis. (C) Immunophenotypic characterization of neutrophil maturation dissected into the promyelocytic, myelocytic, metamyelocytic, and band/mature neutrophil stages based on differential expression of CD11b and CD13. (D) Percentage of myelocytes within the neutrophil compartment in patients with (n = 22) or without (n = 62) MDS-PA after HDT/ASCT. (E) Percentage of metamyelocytes within the neutrophil compartment in patients with (N = 19) or without (N = 40) MDS-PA at diagnosis. *P ≤ .05.
Altered hematopoiesis in patients with MDS-PA. (A) Identification of various immature and mature cell types in the tumor microenvironment of a representative patient, using multidimensional flow cytometry and principal component analysis (PCA): CD34+CD117+ myeloid/erythroid and CD34+CD117– lymphoid precursors within CD34+ HPCs, mesenchymal stem cells, basophils, eosinophils, mast cells, monocytes, 4 neutrophil subsets (promyelocyte, myelocyte, metamyelocyte, and band/mature neutrophils), 2 nucleated red blood cell subsets (proerythroblasts and erythroblasts), and lymphocytes. (B) Percentage of CD34+CD117+ myeloid/erythroid precursors within CD34+ HPCs in patients with (n = 33) or without (n = 243) MDS-PA at diagnosis. (C) Immunophenotypic characterization of neutrophil maturation dissected into the promyelocytic, myelocytic, metamyelocytic, and band/mature neutrophil stages based on differential expression of CD11b and CD13. (D) Percentage of myelocytes within the neutrophil compartment in patients with (n = 22) or without (n = 62) MDS-PA after HDT/ASCT. (E) Percentage of metamyelocytes within the neutrophil compartment in patients with (N = 19) or without (N = 40) MDS-PA at diagnosis. *P ≤ .05.
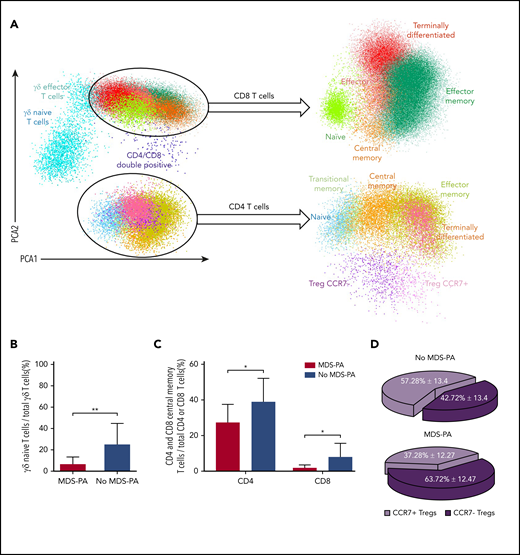
Patients with MDS-PA display altered T-cell regeneration after autologous transplant. (A) Identification of various T-cell subsets using multidimensional flow cytometry and principal component analysis (PCA) in patients with (n = 9) or without (n = 33) MDS-PA: naive, central memory, effector memory, transitional memory, and terminally differentiated CD4 T cells, CCR7-negative and CCR7-positive Tregs, naive, central memory, effector memory, effector, and terminally differentiated CD8 T cells, as well as naive and effector memory TCRγδ T cells. Percentages of γδ naive T cells within total γδ T cells (B), CD4 and CD8 central memory within their respective CD4 and CD8 compartments (C), and CCR7-negative and CCR7-positive subsets within Tregs (D). *P ≤ .05; **P ≤ .01.
Patients with MDS-PA display altered T-cell regeneration after autologous transplant. (A) Identification of various T-cell subsets using multidimensional flow cytometry and principal component analysis (PCA) in patients with (n = 9) or without (n = 33) MDS-PA: naive, central memory, effector memory, transitional memory, and terminally differentiated CD4 T cells, CCR7-negative and CCR7-positive Tregs, naive, central memory, effector memory, effector, and terminally differentiated CD8 T cells, as well as naive and effector memory TCRγδ T cells. Percentages of γδ naive T cells within total γδ T cells (B), CD4 and CD8 central memory within their respective CD4 and CD8 compartments (C), and CCR7-negative and CCR7-positive subsets within Tregs (D). *P ≤ .05; **P ≤ .01.
Clinical significance of an altered hematopoiesis
After finding that MDS-PA were often associated with clonal hematopoiesis and that they affected the tumor microenvironment, we investigated if such abnormalities had clinical relevance. Accordingly, we analyzed the significance of CD56+ aberrant monocytes because data on this MDS-PA were available in a large series of 1252 transplant-eligible and ineligible patients, enrolled in four PETHEMA/GEM protocols. Overall, 70 (5.6%) of the 1252 cases displayed this MDS-PA at diagnosis (Table 1). Of note, this frequency was higher than that found in the GEM2012MENOS65 trial (2.5%) because it was significantly (P = .005) increased in elderly, transplant-ineligible patients enrolled in the GEM2005MAS65 study (9.7%), as well as in cases included in the GEM2000 protocol (6.1%) which enrolled patients up to the age of 70 years. Thus, we found a significant correlation between the presence of MDS-PA and increased age (65 vs 60 years in cases without MDS-PA; P = .04) but also with lower hemoglobin values (97 vs 106 g/dL; P = .04), high lactate dehydrogenase levels (21% vs 13%; P = .04), higher BM PC infiltration (54% vs 35%; P = .002), and higher incidence of ISS stage III (40% vs 24%; P = .004) at diagnosis. In addition, patients with MDS-PA more frequently had anemia (80% vs 55% in cases without MDS-PA; P = .002) and neutropenia (70% vs 50%; P = .01) during treatment. No differences were observed regarding the incidence of high-risk cytogenetic abnormalities. Patients with MDS-PA had significantly inferior PFS and OS compared with cases without MDS-PA (median PFS of 26 vs 42 months [P = .001]; median OS of 50 vs 79 months [P = .004], respectively) (Figure 5). Furthermore, the presence of MDS-PA had independent prognostic value for PFS (HR, 1.5; 95% CI, 1.1-2.1; P = .02) and OS (HR, 1.7; 95% CI, 1.1-2.5; P = .01) in a multivariate analysis together with other adverse parameters such as ISS stage III, elevated lactate dehydrogenase levels, and high-risk FISH abnormalities (Table 2). Most interestingly, the negative impact of MDS-PA in survival was solely observed in patients receiving maintenance without immunomodulatory drugs, and it was abrogated whenever thalidomide or lenalidomide were used (supplemental Figure 3). That notwithstanding, the presence of MDS-PA retained independent prognostic value for PFS (although not for OS) in a multivariate model that included the use of immunomodulatory drugs for maintenance as a variable (supplemental Table 6).
Patient characteristics at diagnosis plus frequency and type of hematologic toxicity during treatment
| Diagnostic features | No MDS-PA (n = 1182; 94.4%) | MDS-PA (n = 70; 5.6%) | P |
|---|---|---|---|
| Age, y* | 60 | 65 | .04 |
| Male sex | 659 (53%) | 38 (54%) | .86 |
| Hemoglobin, g/dL* | 106 | 97 | <.001 |
| LDH (elevated) | 154 (13%) | 15 (21.4%) | .04 |
| ISS stage (n = 1211) | n = 1143 | n = 68 | |
| I | 405 (35.4%) | 14 (20.6%) | .007 |
| II | 462 (40.4%) | 27 (39.7%) | .507 |
| III | 276 (24.2%) | 27 (39.7%) | .004 |
| Isotype (n = 1239) | n = 1171 | n = 68 | |
| IgG | 689 (58.8%) | 32 (47%) | .038 |
| IgA | 291 (24.9%) | 19 (27.9%) | .328 |
| IgD | 9 (0.77%) | 1 (2.1%) | .433 |
| IgM | 1 (0.09%) | — | — |
| Light chain | 181 (15.5%) | 16 (23%) | .060 |
| Plasma cells, %* | 35 | 54 | .002 |
| Cytogenetics (n = 772) | n = 726 | n = 46 | |
| Standard-risk | 581 (80%) | 37 (80%) | .562 |
| High-risk† | 145 (20%) | 9 (20%) | .562 |
| Hematologic toxicity‡ | No MDS-PA (n = 736; 94.8%) | MDS-PA (n = 40; 5.3%) | P |
|---|---|---|---|
| Anemia | 405 (55%) | 32 (80%) | .002 |
| Neutropenia | 364 (50%) | 28 (70%) | .011 |
| Thrombocytopenia | 195 (27%) | 11 (28%) | .889 |
| Hematologic toxicity‡ | No MDS-PA (n = 736; 94.8%) | MDS-PA (n = 40; 5.3%) | P |
|---|---|---|---|
| Anemia | 405 (55%) | 32 (80%) | .002 |
| Neutropenia | 364 (50%) | 28 (70%) | .011 |
| Thrombocytopenia | 195 (27%) | 11 (28%) | .889 |
IgG, immunoglobulin G; LDH, lactate dehydrogenase.
Median values.
t(4;14), t(14;16), and/or del(17p).
Data on hematologic toxicity during treatment was unavailable in patients enrolled in the GEM2000 protocol.
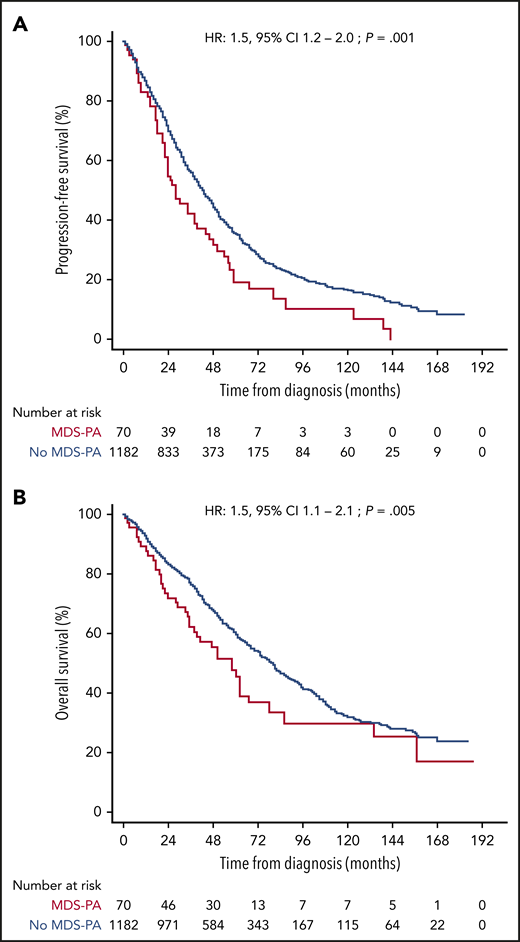
Survival according to undetectable vs detectable MDS-PA. The Kaplan-Meier estimates of PFS (A) and OS (B) after assessment of MDS-PA in the monocytic lineage at diagnosis (N = 1252).
Survival according to undetectable vs detectable MDS-PA. The Kaplan-Meier estimates of PFS (A) and OS (B) after assessment of MDS-PA in the monocytic lineage at diagnosis (N = 1252).
Multivariate analyses of prognostic factors for PFS and OS in patients newly diagnosed with MM (N = 1252), including the presence of MDS-PA based on aberrant CD56 expression in the monocytic lineage
| Variable | PFS | OS | ||
|---|---|---|---|---|
| HR (95% CI) | P | HR (95% CI) | P | |
| ISS stage III | 1.3 (1.0-1.6) | .029 | 1.7 (1.3-2.1) | .000 × 104 |
| Elevated LDH levels | 1.7 (1.3-2.2) | .00 | 1.9 (1.4-2.6) | .000 × 105 |
| t(4;14), t(14;16), del(17p) | 1.3 (1.1-1.6) | .009 | 1.5 (1.2-1.9) | .000 × 104 |
| MDS-PA | 1.5 (1.1-2.1) | .016 | 1.7 (1.1-2.5) | .012 |
LDH, lactate dehydrogenase.
Discussion
Unexplained blood cytopenias can be a clinical challenge, and the relation between these and somatic mutations in genes known to be associated with MDS (ie, CHIP and clonal cytopenias of undetermined significance) is an area of extensive research. Of note, up to 30% of patients with non-Hodgkin lymphoma have detectable CHIP, and this is associated with inferior survival.43 Here, we conducted the largest study reported thus far on the incidence and significance of dysplastic hematopoiesis in untreated MM and found that ∼1 of 10 patients display MDS-PA at diagnosis. Moreover, targeted sequencing of MDS recurrently mutated genes in CD34+ progenitors (and dysplastic lineages) unveiled clonal hematopoiesis in one-half the cases with MDS-PA; TET2 and NRAS were the most frequently mutated genes (supplemental Table 7). These findings have important clinical meaning because the presence of MDS-PA at diagnosis anticipated greater risk of hematologic toxicity and was independently associated with inferior survival.
Cytopenias may induce treatment-related complications, leading to dose reduction or greater time intervals. More than 10 years ago, Barlogie et al10 reported that MDS-CA after HDT/ASCT was associated with lower CD34+ HPC yield at collection, longer time interval from MM diagnosis to HDT, older age, and lower platelet recovery after HDT. Chitre et al12 have recently shown that most patients with MM and detectable CHIP in leukapheresis before HDT/ASCT were anemic and one case had neutropenia, although no association between CHIP and cell numbers at apheresis was observed. Here, we confirmed and expanded these findings by showing a similar association between an immunophenotypically altered hematopoiesis and anemia at diagnosis, together with anemia and neutropenia during treatment. We found no correlation between MDS-PA at diagnosis and impaired mobilization of CD34+ HPCs (data not shown).
We and others have reported that the composition and functionality of CD34+ HSCs are dysregulated in patients with active MM, possibly due to a progressively increasing competition between tumor PCs and hematopoietic progenitors for potentially overlapping (SDF-1–related) BM niches and activated transforming growth factor β signaling in the BM tumor microenvironment.44,45 Here, our results suggest that the presence of dysplastic hematopoiesis with underlying somatic mutations at the stem cell level could also contribute to the high frequency of anemia at diagnosis and during therapy. However, it should be noted that due to the small number of patients with paired phenotypic and genetic analyses, this study is not powered to establish a relation between MDS-PA and clonal hematopoiesis.
To date, whether HDT/ASCT favors the emergence of dysplastic hematopoiesis remains controversial. Based on longitudinal evaluation of MDS-PA at diagnosis and after autologous transplant, we found that in most cases (80%), MDS-PA either persisted or remained absent in patients with or without MDS-PA at diagnosis, and that MDS-associated mutations infrequently emerged after HDT. Overall, both immunophenotypic and NGS analyses suggest that patients’ phenotype is mostly driven by the findings at diagnosis, but these data should be interpreted with caution due to the subclonal nature of detected mutations (eg, a mutation appearing after HDT/ASCT could have been present in a minor subclone at diagnosis). Nonetheless, screening immunophenotypic features of dysplasia could be an informative test in patients in whom the degree of cytopenia is not explained by the myeloma tumor load or treatment being used.46 Interestingly, none of the patients with MDS-PA had evidence of morphologic dysplasia after cytologic assessment of BM smears.
The BM milieu is a crucial modulator of the MM biology/pathogenesis.47-55 Accordingly, patients with MM are highly susceptible to infections, owing to diminished innate and adaptive immune repertoires and function.56,57 Immune dysfunction may occur either as a consequence of an altered microenvironment due to progressive expansion of tumor PCs or secondary to therapy.58 However, the contribution of dysplasia to both altered hematopoietic and immune profiles in patients with MM has not been investigated. Here, we unravel that similarly to many cases with MDS, patients with newly diagnosed MM and MDS-PA show an expansion of myeloid/erythroid precursors at the expense of lymphoid precursors within the CD34+ HPC compartment and a maturation arrest in immature neutrophil stages.59,60 Of note, altered distribution of γδ T cells and Tregs have been reported in MDS61,62 ; in the current study, we found that patients with MM and MDS-PA exhibited significantly reduced frequencies of γδ naive T cells as well as a significant expansion of CCR7-negative Tregs at the expense of the CCR7-positive subset (compared with cases without MDS-PA). Thus, further research is warranted to explore if these findings result in impaired cell function, as well as the clinical relevance of immune alterations resulting from dysplastic hematopoiesis and if this can be abrogated with specific immunotherapies. Of note, in 47 patients with longitudinal evaluation of MDS-PA from diagnosis to maintenance therapy, MDS-PA identified at diagnosis became undetectable during maintenance therapy in 3 of 5 patients; by contrast, among 42 cases without MDS-PA at diagnosis, 12 displayed MDS-PA during maintenance therapy.
In line with previous observations based on MDS-CA or CHIP,10,12,63 we found no statistically significant association between presence of MDS-PA and development of MDS or AML after a median follow-up of 5 years (range, <1-15 years), probably due to its generally low incidence and the extended period between diagnosis of MM and subsequent diagnosis of MDS/AML.5,11 However, we and others have shown that MDS or AML is often preceded by detectable MDS-PA or MDS-CA,10,11,14 which suggests that their presence could be used to closely monitor for these two SPMs. Furthermore, we confirmed previous observations made by Barlogie et al10 that patients with dysplastic hematopoiesis have inferior survival and showed that immunomodulatory drug–based maintenance may overcome its negative prognostic value. Taken together, these studies support cost-effective screening of dysplasia in patients with PC disorders to help resolve unexplained cytopenias and to identify treatment strategies overcoming its clinical consequences for improving patients’ quality of life. Noteworthy, the results from tanother study analyzing the presence of CHIP in growth factor–mobilized peripheral blood from a large series of transplant-eligible patients reproduced our findings in such a way that the use of immunomodulatory drugs after ASCT abrogated the deleterious effects of CHIP on PFS and OS.63 Thus, the results from both studies support the use of immunomodulatory drugs during maintenance therapy in patients with MDS-PA (or CHIP) at diagnosis.
The online version of this article contains a data supplement.
The publication costs of this article were defrayed in part by page charge payment. Therefore, and solely to indicate this fact, this article is hereby marked “advertisement” in accordance with 18 USC section 1734.
Acknowledgments
This study was supported by the Centro de Investigación Biomédica en Red–Área de Oncología–del Instituto de Salud Carlos III (CIBERONC; CB16/12/00369, CB16/12/00489, CB16/12/00233 and CB16/12/00400), Instituto de Salud Carlos III/Subdirección General de Investigación Sanitaria (FIS No. PI17/01243 and PI19/01451), Asociación Española Contra el Cáncer (GCB120981SAN), and Torres Quevedo fellowship from the Spanish Ministry of Science and Innovation (PTQ-16-08623). This study was supported internationally by the Cancer Research UK, Fundación Científica de la Asociación Española Contra el Cáncer (FCAECC), and Fondazione AIRC per la Ricerca sul Cancro (AIRC) under the Accelerator Award Program, the Black Swan Research Initiative of the International Myeloma Foundation, the European Research Council 2015 Starting Grant (MYELOMANEXT), the Multiple Myeloma Research Foundation (MMRF) Immunotherapy Networks of Excellence, and the 2017 European Hematology Association Nonclinical Advanced Research Grant (3680644).
Authorship
Contribution: B.P. and A. Orfao conceived the idea, and B.P. designed the study protocol; C. Maia, N.P., M.-T.C., JJ.P., J.M., C. Moreno, and L.B. analyzed flow cytometry data; D.A. performed cell sorting; I.V., P.A, S.S. and M.-C.C. performed NGS; C. Maia, R.V.-M., I.V., M.-C.C., F.J.G.-A., G.A., and I.G. analyzed sequencing data. M.J.C., J.M.-L., F.J.G.-A., G.A., R.G.-S., M.G., C.B., F.P., S.M., A. Orfao., A. Oriol, A.-I.T., MA.E., R.d.P., F.d.A., M.T.H., L.P., R.M., L.R., M.-V.M, J.-J.L., J.B., and J.F.S.M. provided study material and/or patients; C. Maia and B.P. performed statistical analysis; C. Maia, J.F.S.M. and B.P. wrote the manuscript; and all authors reviewed and approved the manuscript. A complete list of the members of the PETHEMA/GEM Cooperative Group appears in the supplemental Appendix.
Conflict-of-interest disclosure: N.P. reports consultancy and honoraria from Amgen; research funding, honoraria, membership on an entity’s Board of Directors or advisory committees, speakers bureau, and consultancy from Celgene; research funding, consultancy, and honoraria from Janssen; honoraria and consultancy from Takeda; and honoraria from The Binding site. J.M.-L. reports advisory committee, honoraria, or research support from Novartis, Celgene, Janssen, Bristol-Myers Squibb, Incyte, and VIVIA. A. Oriol participated in advisory boards for Amgen, Celgene, and Janssen. F.d.A. reports honoraria for lectures from Celgene, Janssen, Amgen, and Takeda; and consultancy with Amgen, Celgene, and Janssen. M.-V.M. has received honoraria from lectures or participation in advisory boards from Janssen, Celgene, Amgen, Takeda, AbbVie, Adaptive, GlaxoSmithKline, Pharmamar, EDO, and Oncopeptides. L.R. reports honoraria from Janssen, Celgene, Amgen, and Takeda. J.B. reports honoraria for lectures from Janssen, Amgen, Celgene, Takeda, and Oncopeptides. J.-J.L. reports honoraria from and membership on board of directors or advisory committees with Takeda, Amgen, Celgene, and Janssen. J.F.S.M. reports consultancy for Bristol-Myers Squibb, Celgene, Novartis, Takeda, Amgen, MSD, Janssen, and Sanofi; and membership on board of directors or advisory committees with Takeda. B.P. reports honoraria for lectures from and membership on advisory boards with Amgen, Bristol-Myers Squibb, Celgene, Janssen, Merck, Novartis, Roche, and Sanofi; unrestricted grants from Celgene, EngMab, Sanofi, and Takeda; and consultancy for Celgene, Janssen, Sanofi, and Takeda. The remaining authors declare no competing financial interests.
Correspondence: Bruno Paiva, Clínica Universidad de Navarra–CIMA, Av. Pío XII, 55. 31008, Pamplona, Spain; e-mail: bpaiva@unav.es.
