

Key Points
A subset of patients with hematologic malignancies carry rare spliceosomal gene mutations of unknown disease relevance.
Many rare and even private spliceosomal gene mutations create molecular phenocopies of hotspot mutations and are likely pathogenic.

Abstract
Genes encoding the RNA splicing factors SF3B1, SRSF2, and U2AF1 are subject to frequent missense mutations in clonal hematopoiesis and diverse neoplastic diseases. Most “spliceosomal” mutations affect specific hotspot residues, resulting in splicing changes that promote disease pathophysiology. However, a subset of patients carries spliceosomal mutations that affect non-hotspot residues, whose potential functional contributions to disease are unstudied. Here, we undertook a systematic characterization of diverse rare and private spliceosomal mutations to infer their likely disease relevance. We used isogenic cell lines and primary patient materials to discover that 11 of 14 studied rare and private mutations in SRSF2 and U2AF1 induced distinct splicing alterations, including partially or completely phenocopying the alterations in exon and splice site recognition induced by hotspot mutations or driving “dual” phenocopies that mimicked 2 co-occurring hotspot mutations. Our data suggest that many rare and private spliceosomal mutations contribute to disease pathogenesis and illustrate the utility of molecular assays to inform precision medicine by inferring the potential disease relevance of newly discovered mutations.
Introduction
Somatic mutations in genes encoding RNA splicing factors are among the most common genetic changes observed in many hematologic malignancies.1-6 Also recurrently observed in solid tumors, albeit at lower frequencies, these spliceosomal mutations occur most commonly in SF3B1, SRSF2, and U2AF1 as missense changes at a highly specific set of hotspot residues.7,8 Hotspot mutations in SF3B1, SRSF2, and/or U2AF1 are observed in many patients with myelodysplastic syndromes and related hematologic diseases, and occur at high frequencies of from 5% to 18% in chronic lymphocytic leukemia,5,6,9,10 5% to 25% of acute myeloid leukemia (AML) in adults,11 and 14% to 29% in uveal melanoma.12,13
Consistent with the frequent and recurrent nature of spliceosomal mutations, functional studies indicate that these lesions drive disease. Mutations in SRSF2 and U2AF1 specifically occur at high rates in elderly subjects with clonal hematopoiesis and confer a high risk for transformation to overt myeloid leukemia in this setting.14,15 In many cases, concrete links among altered RNA splicing, specific target genes, and hallmark disease phenotypes have been identified. For example, SF3B1 mutations alter RNA branchpoint recognition to cause BRD9 mis-splicing and cell transformation,16-19 SRSF2 mutations alter exonic splicing enhancer recognition to cause EZH2 mis-splicing and impaired hematopoiesis,20,21 and U2AF1 mutations alter 3′ splice site recognition to cause IRAK4 mis-splicing and aberrant innate immune signaling.22-24
Although the bulk of SF3B1, SRSF2, and U2AF1 mutations affect a small set of hotspot residues, a minority of patients carry non-hotspot mutations, some of which are recurrent despite their relative rarity. The relevance of rare and private (observed in only 1 patient) spliceosomal lesions to disease is unclear, but they are enriched in hematologic malignancies, preferentially occur as missense changes, and appear in a heterozygous genetic context, similar to their hotspot counterparts (Figure 1A-B).25 This situation, in which a cancer-relevant gene is subject to hotspot mutations of known significance, as well as rare or private mutations of unknown functional consequence, is not unique to splicing factors. Rare and private mutations have frequently been ignored in favor of their more common hotspot counterparts because of the inherent challenges of studying a diverse mutational spectrum. However, advances in molecular and functional assays have enabled recent studies to identify protumorigenic roles of rare and even private inherited genetic variants and somatically acquired mutations of previously unknown significance in BRCA1, EGFR, KRAS, and other cancer-relevant genes.26-30 Each of those studies relied on a different approach to classification (eg, measuring how each rare variant or mutation affected biochemical activity [BRCA1], gene expression profiles [EGFR and others], or tumor outgrowth [KRAS and others]), selected based on known molecular or biological consequences of hotspot mutations.
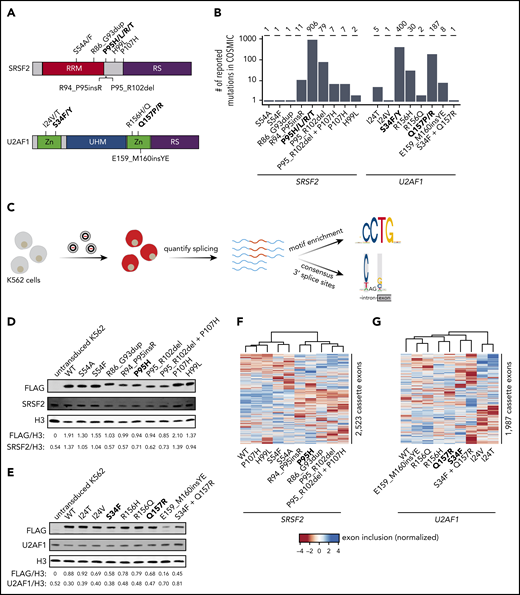
Strategy for classification of rare, non-hotspot SRSF2 and U2AF1 mutations. (A) Hotspot (bold) and select rare and private mutations affecting SRSF2 and U2AF1. RRM, RNA recognition motif; RS, arginine/serine-rich domain; UHM, U2AF homology motif; Zn, zinc finger domain. (B) Numbers of reported mutations in SRSF2 and U2AF1 in the Catalogue of Somatic Mutations in Cancer (COSMIC) database as of 17 September 2018. SRSF2S54A was identified in a patient sample, but is not present in COSMIC. (C) Schematic of our strategy for transgenically expressing individual mutations in cell culture and performing subsequent transcriptome analyses. (D) Western blot for FLAG, SRSF2, and Histone H3 (H3), using lysate from untransduced K562 cells or K562 cells that stably expressed FLAG-tagged WT or mutant SRSF2 (mutation indicated earlier). H3 is a loading control. FLAG and SRSF2 band intensities were quantified using ImageJ and normalized to the respective band intensity for H3. (E) As in panel D, but for U2AF1. (F-G) Heat map and associated dendrogram representing an unsupervised cluster analysis based on cassette exon inclusion levels computed from the transcriptomes of K562 cells stably expressing the indicated alleles of SRSF2 (F) or U2AF1 (G). Exon inclusion values were z-score normalized.
Strategy for classification of rare, non-hotspot SRSF2 and U2AF1 mutations. (A) Hotspot (bold) and select rare and private mutations affecting SRSF2 and U2AF1. RRM, RNA recognition motif; RS, arginine/serine-rich domain; UHM, U2AF homology motif; Zn, zinc finger domain. (B) Numbers of reported mutations in SRSF2 and U2AF1 in the Catalogue of Somatic Mutations in Cancer (COSMIC) database as of 17 September 2018. SRSF2S54A was identified in a patient sample, but is not present in COSMIC. (C) Schematic of our strategy for transgenically expressing individual mutations in cell culture and performing subsequent transcriptome analyses. (D) Western blot for FLAG, SRSF2, and Histone H3 (H3), using lysate from untransduced K562 cells or K562 cells that stably expressed FLAG-tagged WT or mutant SRSF2 (mutation indicated earlier). H3 is a loading control. FLAG and SRSF2 band intensities were quantified using ImageJ and normalized to the respective band intensity for H3. (E) As in panel D, but for U2AF1. (F-G) Heat map and associated dendrogram representing an unsupervised cluster analysis based on cassette exon inclusion levels computed from the transcriptomes of K562 cells stably expressing the indicated alleles of SRSF2 (F) or U2AF1 (G). Exon inclusion values were z-score normalized.
Here, we conducted a systematic study to infer the likely disease relevance of rare and private mutations in SRSF2 and U2AF1. Our study was motivated in part by a recent report of 3 patients with chronic lymphocytic leukemia with novel SF3B1 in-frame deletions whose splicing profiles mimicked those of patients with hotspot SF3B1 mutations,31 as well as our recent finding that both rare and common SF3B1 mutations converge on BRD9 mis-splicing across cancer types.19 We wondered whether rare and private SRSF2 and U2AF1 mutations might similarly mimic the splicing phenotypes of hotspot mutations, which induce highly specific alterations in exon or 3′ splice site recognition that drive key disease phenotypes.20-24 We hypothesized that rare or private SRSF2 and U2AF1 mutations that phenocopied hotspot-induced changes in splicing were candidate drivers, whereas mutations that induced few or no splicing changes were likely passengers. We used this approach in both isogenic cell lines and primary patient materials to infer the likely pathogenicity of non-hotspot SRSF2 and U2AF1 mutations (Figure 1C).
Methods
Vector construction and cell line production
An insert containing SRSF2 (or U2AF1) cDNA-FLAG-P2A-mCherry was cloned into the lentiviral vector pRRLSIN.cPPT.PGK-GFP.WPRE (Addgene plasmid 12252). Mutations in SRSF2 or U2AF1 were then created by site-directed mutagenesis. These plasmids were cotransfected with psPAX2 (Addgene plasmid 12260) and envelope vector pMD2.G (Addgene plasmid 12259) into 293T cells. Lentivirus was collected from the supernatant 48 hours posttransfection. Stable cell lines were made by transducing K562 cells with lentivirus at a multiplicity of infection of 2.5 (U2AF1) or 5 (SRSF2). Cells were expanded, and mCherry+ cells were collected by fluorescence-activated cell sorting. K562 cells were cultured in Iscove modified Dulbecco medium supplemented with 10% fetal bovine serum.
Western blotting
Protein lysates were extracted from K562 cells by resuspension in radioimmunoprecipitation assay (RIPA) buffer. Thirty micrograms of protein were then loaded for sodium dodecyl sulfate-polyacrylamide gel electrophoresis and transferred to a nitrocellulose membrane. Proteins were probed with the following antibodies: anti-U2AF1 (A302-080A; Bethyl Laboratories), anti-SRSF2 (04-1550; MilliporeSigma), anti-FLAG (MA1-91878; Thermo Fisher Scientific), and anti-Histone H3 (ab179; Abcam1).
RNA-seq library preparation and analysis
Total RNA was isolated from K562 cells or patient materials, using the TRIzol reagent (Thermo Fisher Scientific). Four micrograms (K562) or 500 ng (patient materials) of total RNA was used as to make poly(A)-selected, unstranded libraries with the TruSeq RNA Library Prep Kit v2 (Illumina). Purified libraries were sequenced on the Illumina Hi-Seq 2000 with 2 × 50-bp reads.
After RNA-seq read mapping, isoform expression levels were estimated as previously described.23 Unless otherwise specified, a splicing event was classified as differentially spliced if it exhibited a change in isoform ratio of at least 10% and a Bayes Factor of at least 5. Wagenmakers’s framework32 was used to compute Bayes factors associated with differences in isoform ratio between samples. A full description of the analysis can be found in supplemental Methods, available on the Blood Web site.
Primary human samples
Studies were approved by the Institutional Review Boards of Memorial Sloan Kettering Cancer Center (MSK; under MSK Institutional Review Board protocol 06-107) and the Hôpital Saint-Louis, and conducted in accordance with the Declaration of Helsinki protocol. Written informed consent was obtained from all participants. Patient samples were anonymized by the Hematologic Oncology Tissue Bank of MSK and the Hôpital Saint-Louis. Mutational analysis of SRSF2 and U2AF1 was performed on genomic DNA from bone marrow mononuclear cells by targeted sequencing using MSK Heme-PACT assay33 (for samples from MSK).
Data availability
RNA-seq data generated as part of this study were deposited in the Gene Expression Omnibus (accession number GSE135732). Previously published data were downloaded from the Gene Expression Omnibus under accession numbers GSE65349,20 GSE114922,34 GSE66917, and GSE67039.35 TCGA data were downloaded from CGHub.36,37
Results
Diverse SRSF2 and U2AF1 mutations alter RNA splicing programs
We queried the Catalogue of Somatic Mutations in Cancer database25 to identify all SRSF2 and U2AF1 mutations with confirmed somatic status as of 17 September 2018. We selected 8 SRSF2 and 6 U2AF1 representative non-hotspot mutations for detailed study (Figure 1B). These mutations exhibited highly variable frequencies (ranging from private to common), represented both missense changes and indels (insertions and deletions), and were present as either single polymorphisms or indels, as well as more complex events (involving multiple mutations, such as U2AF1S34F_Q157R, for which 2 hotspot mutations co-occurred on the same allele). We systematically determined how each mutation affected RNA splicing in both engineered cell lines and primary patient materials, when available, as follows.
We first established cell culture models of each selected SRSF2 and U2AF1 mutation. We modeled each mutation via transgenic expression in K562 cells for 2 reasons. First, spliceosomal mutations are always coexpressed with a wild-type (WT) allele, which is required for cell survival.38 Our lentiviral construct contained a fluorescent marker that permitted titration of transgene expression by flow sorting, which was critical, given previous reports that the ratio of mutant to WT protein controls global missplicing profiles.39 Second, we and others have previously demonstrated that simultaneous expression of a transgenic mutant protein and endogenous WT protein in K562 cells faithfully recapitulates mis-splicing profiles observed in primary patient materials with SRSF2 or U2AF1 mutations.20,23,40
We transduced K562 cells with a lentiviral construct expressing each mutant cDNA (individually) and established stable transgenic cell lines for each selected mutation (Figure 1C; supplemental Figure 1). We additionally established cell lines expressing transgenic WT SRSF2 or U2AF1 as a control for transgene expression, as well as cell lines expressing the hotspot mutations SRSF2P95H, U2AF1S34F, and U2AF1Q157R. We modeled 2 different U2AF1 hotspot mutations because we previously found that mutations affecting U2AF1’s first vs second zinc finger result in distinct alterations in 3′ splice site recognition.23 We confirmed that transgene introduction resulted in relative levels of mutant vs WT SRSF2 and U2AF1 mRNA within physiological ranges observed in patients and that each cell line expressed mutant protein in the absence of significant perturbations to total (mutant + WT) levels of SRSF2 or U2AF1 relative to untransduced cells (Figure 1D-E; supplemental Figure 2).
We first tested whether expressing rare SRSF2 and U2AF1 mutations altered global splicing programs. We performed high-coverage RNA-seq on each of the 19 distinct cell lines and quantified global isoform expression for ∼125 000 alternative splicing events and aberrant retention or splicing of ∼160 000 constitutive introns, as previously described.41 An unsupervised cluster analysis based on cassette exon inclusion, where we focused on cassette exons because SRSF2 and U2AF1 hotspot mutations primarily affect this category of splicing event,20,23 revealed allele-specific clustering that was distinct from WT splicing programs in many cases (Figure 1F-G). This simple analysis suggested that at least some rare mutations influenced splicing programs.
Rare and hotspot SRSF2 mutations converge on altered exonic splicing enhancer preference
We sought to determine how rare spliceosomal mutations influenced global splicing programs (Figure 1F). We first focused on SRSF2 mutations, because all hotspot SRSF2 mutations affect a single residue (P95) and cause identical alterations in the RNA splicing process.20,21 Similar to their hotspot counterparts, rare SRSF2 mutations were associated with a diversity of splicing changes affecting competing splice sites, cassette exons, retained introns, and aberrant splicing or retention of normally constitutive introns, with cassette exons representing the most commonly differentially spliced event. The numbers of significantly differentially spliced events, defined as events with a change in isoform ratio of at least 10% and Bayes factor of at least 5 relative to WT-expressing control cells, varied by an order of magnitude across the different mutations, suggestive of dramatically different functional consequences (Figure 2A; supplemental Table 1).
Hotspot SRSF2 mutations alter SRSF2’s RNA-binding affinity and avidity to induce sequence-specific changes in exonic splicing enhancer (ESE) preference. Although WT SRSF2 recognizes a consensus motif SSNG (S = G or C) in pre-mRNA, SRSF2P95H/L/R mutations promote recognition of C-rich variants and repress recognition of G-rich variants.20,21,42 We therefore determined how each rare mutation affected recognition of G- vs C-rich variants of the core SSNG motif. We identified all differentially spliced cassette exons in each cell line (supplemental Figure 3), identified all occurrences of SSNG motifs in each cassette exon, and computed the enrichment for each SSNG motif variant in cassette exons that were promoted vs repressed in mutant vs WT cells. Six of the 8 tested non-hotspot SRSF2 mutations caused significant alterations in C- vs G-rich ESE preference that were restricted to differentially spliced cassette exons, an identical pattern to that observed for the SRSF2P95H hotspot mutation (Figure 2B; supplemental Figure 4). Our approach allowed us to deconvolve complex co-mutation events such as SRSF2P95_R102del+P107H. SRSF2P95_R102del alone phenocopied SRSF2P95 mutations, whereas SRSF2P107H alone had no effect, suggesting that the first lesion might be pathogenic whereas the second is functionally silent (Table 1).
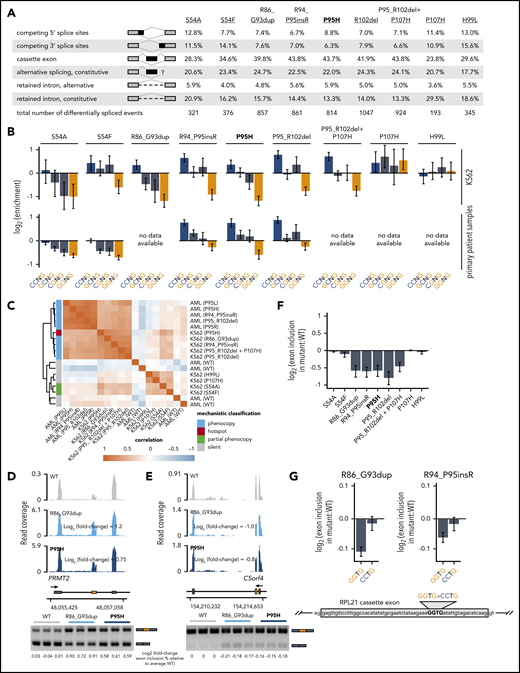
Rare mutations in SRSF2 alter exonic splicing enhancer (ESE) preference. (A) Differentially spliced events identified in K562 cells expressing each indicated SRSF2 mutant allele relative to WT-expressing control cells. Percentages represent the distribution of differentially spliced events among the indicated event types for each mutation. (B) Enrichment for each indicated variant of the SSNG motif within cassette exons that were promoted vs repressed in cells expressing mutant vs WT SRSF2. The enrichment for a given motif was defined as the number of instances in all promoted exons divided by the number of instances in all repressed exons. Error bars represent 95% confidence intervals estimated by bootstrapping. The transcriptomes of patient samples bearing SRSF2S54A (polycythemia + hyperleukocytosis + myelofibrosis) and SRSF2S54F (chronic myelomonocytic leukemia) were sequenced for this study; RNA-seq data from patient samples bearing SRSF2R94_P95insR (AML), SRSF2P95H (chronic myelomonocytic leukemia), and SRSF2P95_R102del (AML) were previously published.20 (C) Heat map and dendrogram illustrating the global similarity of splicing programs in K562 cells and AML samples expressing the indicated alleles of SRSF2. Dendrogram illustrates the results of an unsupervised clustering based on differential splicing in each indicated sample relative to WT-expressing control cells (K562) or a median computed over all WT samples (AML). AML patient data were previously published.20 (D) RNA-seq read coverage illustrating increased cassette exon inclusion in PRMT2 in K562 cells expressing either a hotspot (P95H) or private (R86_G93dup) SRSF2 mutation (top). Log2 (fold-change) illustrates log2 (exon inclusion in mutant- vs WT-expressing cells). RT-PCR validation of RNA-seq results in technical triplicate (bottom). Log fold-changes for RT-PCR computed with respect to the mean signal for WT. (E) As in panel (D), but for a cassette exon in C5orf4 that is repressed by mutant SRSF2. (F) Relative inclusion of a cassette exon within RPL21 expressed from its endogenous locus in K562 cells expressing mutant vs WT SRSF2. Error bars represent 95% confidence intervals for the relative inclusion ratio, computed by propagating the 95% confidence intervals for the 2 isoforms to the ratio for mutant vs WT SRSF2 by standard rules for error propagation during division of quantities with individual errors. (G) As in panel (F), but where the RPL21 cassette exon is expressed from a minigene transfected into K562 cells and contains the indicated ESEs. GGTG is the native sequence; CCTG is a mutated ESE that is predicted to be well-recognized in the presence of mutant SRSF2. Bars represent the mean ± standard deviation, measured by quantitative RT-PCR and computed over 3 biological replicates.
Rare mutations in SRSF2 alter exonic splicing enhancer (ESE) preference. (A) Differentially spliced events identified in K562 cells expressing each indicated SRSF2 mutant allele relative to WT-expressing control cells. Percentages represent the distribution of differentially spliced events among the indicated event types for each mutation. (B) Enrichment for each indicated variant of the SSNG motif within cassette exons that were promoted vs repressed in cells expressing mutant vs WT SRSF2. The enrichment for a given motif was defined as the number of instances in all promoted exons divided by the number of instances in all repressed exons. Error bars represent 95% confidence intervals estimated by bootstrapping. The transcriptomes of patient samples bearing SRSF2S54A (polycythemia + hyperleukocytosis + myelofibrosis) and SRSF2S54F (chronic myelomonocytic leukemia) were sequenced for this study; RNA-seq data from patient samples bearing SRSF2R94_P95insR (AML), SRSF2P95H (chronic myelomonocytic leukemia), and SRSF2P95_R102del (AML) were previously published.20 (C) Heat map and dendrogram illustrating the global similarity of splicing programs in K562 cells and AML samples expressing the indicated alleles of SRSF2. Dendrogram illustrates the results of an unsupervised clustering based on differential splicing in each indicated sample relative to WT-expressing control cells (K562) or a median computed over all WT samples (AML). AML patient data were previously published.20 (D) RNA-seq read coverage illustrating increased cassette exon inclusion in PRMT2 in K562 cells expressing either a hotspot (P95H) or private (R86_G93dup) SRSF2 mutation (top). Log2 (fold-change) illustrates log2 (exon inclusion in mutant- vs WT-expressing cells). RT-PCR validation of RNA-seq results in technical triplicate (bottom). Log fold-changes for RT-PCR computed with respect to the mean signal for WT. (E) As in panel (D), but for a cassette exon in C5orf4 that is repressed by mutant SRSF2. (F) Relative inclusion of a cassette exon within RPL21 expressed from its endogenous locus in K562 cells expressing mutant vs WT SRSF2. Error bars represent 95% confidence intervals for the relative inclusion ratio, computed by propagating the 95% confidence intervals for the 2 isoforms to the ratio for mutant vs WT SRSF2 by standard rules for error propagation during division of quantities with individual errors. (G) As in panel (F), but where the RPL21 cassette exon is expressed from a minigene transfected into K562 cells and contains the indicated ESEs. GGTG is the native sequence; CCTG is a mutated ESE that is predicted to be well-recognized in the presence of mutant SRSF2. Bars represent the mean ± standard deviation, measured by quantitative RT-PCR and computed over 3 biological replicates.
Mechanistic classification of studied mutations
| Mutation | n | Mechanistic classification | Evidence | Reference |
|---|---|---|---|---|
| SRSF2 | ||||
| S54A | 1 | Partial phenocopy of P95 | Cell line + patient | This study |
| S54F | 1 | Partial phenocopy of P95 | Cell line + patient | This study |
| R86_G93dup | 1 | Phenocopy of P95 | Cell line | This study |
| R94_P95insR | 11 | Phenocopy of P95 | Cell line + patient | This study |
| P95H | 448 | Hotspot | Cell line + patient | (Previously studied) |
| P95L | 280 | Hotspot | Cell line + patient | (Previously studied) |
| P95R | 168 | Hotspot | Cell line + patient | (Previously studied) |
| P95_R102del | 79 | Phenocopy of P95 | Cell line + patient | This study |
| P05_R102del + P107H | 7 | Phenocopy of P95 | Cell line | This study |
| P107H | 7 | Silent | Cell line | This study |
| H99L | 2 | Silent | Cell line | This study |
| U2AF1 | ||||
| I24T | 5 | Dual phenocopy of S34 and Q157 (likely) | Cell line + patient | This study |
| I24V | 1 | Phenocopy of S34 (likely) | Cell line | This study |
| S34F | 308 | Hotspot | Cell line + patient | (Previously studied) |
| S34Y | 92 | Hotspot | Cell line + patient | (Previously studied) |
| R156H | 30 | Phenocopy of Q157 | Cell line + patient | This study |
| R156Q | 2 | Silent | Cell line | This study |
| Q157R | 66 | Hotspot | Cell line + patient | (Previously studied) |
| Q157P | 121 | Hotspot | Cell line + patient | (Previously studied) |
| E159_M160insYE | 8 | Phenocopy of Q157 | Cell line + patient | This study |
| S34F + Q157R | 1 | Dual phenocopy of S34 and Q157 | Cell line | This study |
Classification inferred from exonic splicing enhancer preferences and 3′ splice site preferences associated with each mutation. The consequences of hotspot (bold) SRSF2 and U2AF1 mutations were previously studied by several groups.20-23,54
n, number of times that each mutation has been reported in COSMIC.
We next confirmed our results in the physiological setting of primary patient materials. We searched for non-hotspot SRSF2 mutations in institutional biorepositories as well as published cohorts of patients with AML,20,35 chronic myelomonocytic leukemia,20 and myelodysplastic syndromes.34 We identified samples carrying SRSF2S54A/F, SRSF2R94_P95insR, and SRSF2P95_R102del; performed RNA-seq or reanalyzed published data when available; and tested for sequence-specific alterations in ESE preference. In each case, we observed enhanced and spatially restricted recognition of C- vs G-rich SSNG motifs that was consistent with our results from cell culture (Figure 2B; supplemental Figure 4). Interestingly, although many non-hotspot mutations induced seemingly complete phenocopies of enhanced recognition of C- vs G-rich ESEs, SRSF2S54A/F induced partial phenocopies apparent as decreased recognition of GGNG in the absence of enhanced recognition of CCNG (Table 1; supplemental Figure 4). Unsupervised clustering of K562 cell lines with primary patient samples revealed that global mis-splicing profiles segregated by mechanistic classification, consistent with a central role for altered ESE recognition in driving global mis-splicing programs in cells with rare as well as hotspot SRSF2 mutations (Figure 2C). We experimentally validated results from RNA-seq by performing reverse transcription polymerase chain reaction (RT-PCR) on 8 distinct mis-splicing events. In each case, the private mutation SRSF2R86_G93dup and the common mutation SRSF2P95H induced concordant mis-splicing in K562 cells (Figure 12D-E; supplemental Figure 5).
We next experimentally confirmed that rare SRSF2 mutations caused aberrant exon recognition in a manner that depended on altered ESE recognition. As we previously demonstrated that enhanced cassette exon recognition in hotspot mutant cells was a result of the presence of CCNG motifs,20 we here instead tested whether repressed cassette exon recognition was a result of the presence of GGNG motifs. A cassette exon within RPL21 exhibited significant and consistent repression in mutant cells and also contained a single GGNG motif, making it an ideal system to test this hypothesis (Figure 2F). We cloned this cassette exon and flanking introns into a plasmid, introduced a GGTG>CCTG mutation, and expressed both GGTG (native) and CCTG versions of this minigene in K562 cells. We focused on SRSF2R86_G93dup, a private mutation for which we were unable to identify corresponding patient materials but that phenocopied hotspot mutations in cell culture, as well as the rare mutation SRSF2R94_P95insR, for these assays. Cells expressing SRSF2R86_G93dup and SRSF2R94_P95insR both exhibited reduced cassette exon recognition relative to WT cells for the native minigene, as expected, which was abolished by the GGTG>CCTG mutation (Figure 2G). These results confirmed our genomic inference that rare SRSF2 mutations alter ESE preference and experimentally demonstrate that reduced recognition of G-rich ESEs drives mis-splicing in SRSF2-mutant cells.
Rare U2AF1 mutations induce both complete and dual phenocopy of altered 3′ splice site recognition
Rare U2AF1 mutations affected a diversity of alternative splicing events as well as a smaller set of normally constitutively spliced introns, with cassette exons exhibiting the most frequent differential splicing (Figure 3A; supplemental Table 3). Unlike SRSF2 hotspot mutations, which induce identical changes in ESE recognition, U2AF1 hotspot mutations give rise to 2 distinct changes in RNA-binding specificity and 3′ splice site recognition. U2AF1S34F/Y and Q157P/R mutations alter sequence-dependent recognition of the nucleotides preceding and after the AG dinucleotide of the 3′ splice site, respectively.23,39,43
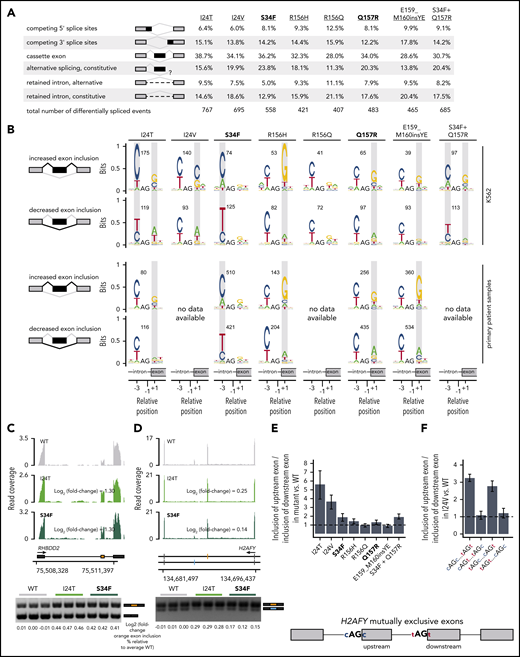
Rare mutations in U2AF1 alter 3′ splice site recognition. (A) Differentially spliced events identified in K562 cells expressing each indicated U2AF1 mutant allele relative to WT-expressing control cells. Percentages represent the distribution of differentially spliced events among the indicated event types for each mutation. (B) Sequence logos representing consensus 3′ splice sites of cassette exons that are differentially spliced in K562 cells expressing mutant versus WT U2AF1. Gray boxes highlight sequence preferences at the −3 and +1 positions that are similar to those observed in cells expressing the U2AF1S34F/Y or U2AF1Q157P/R hotspot mutations. RNA-seq data from patient samples bearing U2AF1I24T (adrenocortical carcinoma), U2AF1S34F (AML), U2AF1R156H (myelodysplastic syndromes), U2AF1Q157R (AML), and U2AF1E159_M160insYE (AML) were previously published.34-37 (C) RNA-seq read coverage illustrating increased cassette exon inclusion in RHBDD2 in K562 cells expressing either a hotspot (S34F) or rare (I24T) U2AF1 mutation (top). Log2 (fold-change) illustrates log2 (exon inclusion in mutant- vs WT-expressing cells). RT-PCR validation of RNA-seq results in technical triplicate (bottom). Log fold-changes for RT-PCR computed with respect to the mean signal for WT. (D) As panel C, but for mutually exclusive exons in H2AFY. The upstream (orange) exon is the exon for which inclusion is calculated. (E) Relative inclusion of the upstream vs downstream exon for 2 mutually exclusive exons within H2AFY expressed from its endogenous locus in K562 cells expressing mutant versus WT U2AF1 as estimated by RNA-seq. Error bars represent 95% confidence intervals for the relative inclusion ratio, computed by propagating the 95% confidence intervals for the 2 isoforms to the ratio for mutant vs WT SRSF2 by standard rules for error propagation during division of quantities with individual errors. (F) As in panel (E), but where the H2AFY mutually exclusive exons are expressed from a minigene transfected into K562 cells and contain 3′ splice sites with the indicated sequences. AG is the AG dinucleotide of the 3′ splice site. Bars represent the mean ratio of inclusion of the upstream:downstream exons ± standard deviation, estimated by quantitative RT-PCR and computed over 3 biological replicates.
Rare mutations in U2AF1 alter 3′ splice site recognition. (A) Differentially spliced events identified in K562 cells expressing each indicated U2AF1 mutant allele relative to WT-expressing control cells. Percentages represent the distribution of differentially spliced events among the indicated event types for each mutation. (B) Sequence logos representing consensus 3′ splice sites of cassette exons that are differentially spliced in K562 cells expressing mutant versus WT U2AF1. Gray boxes highlight sequence preferences at the −3 and +1 positions that are similar to those observed in cells expressing the U2AF1S34F/Y or U2AF1Q157P/R hotspot mutations. RNA-seq data from patient samples bearing U2AF1I24T (adrenocortical carcinoma), U2AF1S34F (AML), U2AF1R156H (myelodysplastic syndromes), U2AF1Q157R (AML), and U2AF1E159_M160insYE (AML) were previously published.34-37 (C) RNA-seq read coverage illustrating increased cassette exon inclusion in RHBDD2 in K562 cells expressing either a hotspot (S34F) or rare (I24T) U2AF1 mutation (top). Log2 (fold-change) illustrates log2 (exon inclusion in mutant- vs WT-expressing cells). RT-PCR validation of RNA-seq results in technical triplicate (bottom). Log fold-changes for RT-PCR computed with respect to the mean signal for WT. (D) As panel C, but for mutually exclusive exons in H2AFY. The upstream (orange) exon is the exon for which inclusion is calculated. (E) Relative inclusion of the upstream vs downstream exon for 2 mutually exclusive exons within H2AFY expressed from its endogenous locus in K562 cells expressing mutant versus WT U2AF1 as estimated by RNA-seq. Error bars represent 95% confidence intervals for the relative inclusion ratio, computed by propagating the 95% confidence intervals for the 2 isoforms to the ratio for mutant vs WT SRSF2 by standard rules for error propagation during division of quantities with individual errors. (F) As in panel (E), but where the H2AFY mutually exclusive exons are expressed from a minigene transfected into K562 cells and contain 3′ splice sites with the indicated sequences. AG is the AG dinucleotide of the 3′ splice site. Bars represent the mean ratio of inclusion of the upstream:downstream exons ± standard deviation, estimated by quantitative RT-PCR and computed over 3 biological replicates.
We therefore tested how expression of each rare U2AF1 mutant allele altered 3′ splice site recognition. We identified cassette exons that were differentially spliced in K562 cells expressing each mutant allele relative to WT cells, and computed consensus 3′ splice site sequences that were associated with promoted vs repressed cassette exons (Figure 3B; supplemental Figure 3). Expression of the hotspot mutations U2AF1S34F and Q157R altered recognition of the −3 and +1 sites, as expected. U2AF1R156H phenocopied U2AF1Q157P/R, as did the rare insertion U2AF1E159_M160insYE. The complex co-mutation U2AF1S34F_Q157R drove a “dual” phenocopy, characterized by S34 and Q157 hotspot-like alterations at both the −3 and +1 positions. The rare mutation U2AF1I24T, which affects U2AF1’s first zinc finger-like S34F/Y, was also associated with a dual phenocopy that was highly similar to that induced by U2AF1S34F_Q157R, whereas U2AF1I24V was similar to U2AF1Q157R (Table 1). To confirm that these 3′ splice site preference alterations were potentially relevant to disease, we extended the above analysis to mutation-matched patient materials. We identified primary patient materials bearing most of the studied rare mutations and compared their transcriptomes with those of WT samples to find similar alterations in consensus 3′ splice sites (Figure 3B). For U2AF1I24T, we only observed alterations at the +1, and not −3, position, rather than the dual phenocopy that was evident in cell culture, potentially because of the relatively low allelic expression of this mutation in the analyzed patient sample (23% vs 32% allelic expression in the patient samples vs K562 cells expressing U2AF1I24T). We used RT-PCR to experimentally validate results from RNA-seq, confirming that U2AF1I24T induced similar patterns of mis-splicing, as did U2AF1S34F in K562 cells for 4 distinct splicing events (Figure 3C-D; supplemental Figure 5).
We experimentally confirmed that mis-splicing of exons in cells expressing rare U2AF1 mutations was a direct consequence of altered 3′ splice site recognition. We selected a mutually exclusive exon event within H2AFY for further study, as H2AFY is a robust target of U2AF1S34F/Y in both human patients and murine models, whose mis-splicing contributes to impaired hematopoiesis.23,44,45 Similar to U2AF1S34F, the rare mutations U2AF1I24T/V promoted upstream exon inclusion while repressing downstream exon inclusion (Figure 3E). We cloned H2AFY’s mutually exclusive exons and flanking introns and exons into a minigene cassette and created mutant versions of the minigene, where we mutated the 3′ splice sites of both mutually exclusive exons as follows: swap the nucleotides at the −3 positions, swap the nucleotides at the +1 positions, and swap the nucleotides at both the −3 and +1 positions. We transfected these minigenes into WT and U2AF1I24V cells, where we focused on U2AF1I24V, as we were unable to obtain patient samples bearing this lesion for transcriptome analysis, and measured relative levels of upstream vs downstream exon inclusion. These experiments revealed that native C and T at the +1 positions of the upstream and downstream exons were both essential for mutation-dependent splicing, whereas the nucleotides at the −3 positions could be swapped without consequence (Figure 3F). These minigene experiments confirm our genomic inference that U2AF1I24V induces H2AFY mis-splicing by altering recognition of the +1 position of the 3′ splice sites of both of H2AFY’s mutually exclusive exons.
Mechanistic classification of mutations explains extent of transcriptome dysregulation
Our analyses of ESE and 3′ splice site recognition in SRSF2- and U2AF1-mutant cells and patient materials clearly distinguished between mutations that did or did not alter the normal functions of SRSF2 and U2AF1 (Table 1). Although hotspot SRSF2 and U2AF1 mutations induce distinctive mis-splicing programs that contribute to disease phenotypes, they have also been shown to affect other cellular processes of potential disease relevance including mRNA translation46 and R loop formation.47,48 We reasoned that if a given rare mutation altered a critical cellular process, then that alteration might be reflected in dysregulated gene expression relative to WT cells. This hypothesis is consistent with previous observations that many cancer-causing mutations that act through diverse molecular pathways induce stereotyped and readily detectable alterations in gene expression profiles.29 We therefore compared the extent of gene expression vs splicing dysregulation to find that hotspot and rare mutations that phenocopied hotspot mutations induced dramatic changes in gene expression, whereas putative passenger mutations with no apparent effects on ESE or 3′ splice site recognition similarly had few effects on global gene expression (Figure 4A-B; supplemental Tables 4 and 5). This analysis supports, although does not prove, our hypothesis that rare SRSF2 or U2AF1 mutations that do not alter ESE or 3′ splice site recognition are likely functionally silent passengers.
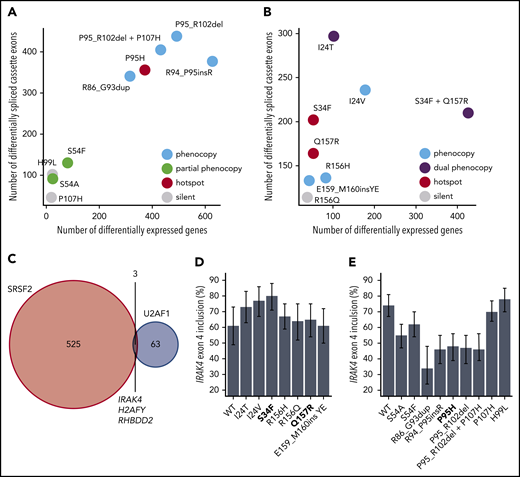
Hotspot and rare SRSF2 and U2AF1 induce transcriptome dysregulation and converge on H2AFY and IRAK4 mis-splicing. (A) Scatter plot comparing the numbers of differentially expressed genes (x-axis) and differentially spliced cassette exons (y-axis) in K562 cells expressing each indicated SRSF2 mutation vs WT-expressing control cells. Differentially expressed genes were defined as those genes with expression at least 1 TPM in both samples, |log2 (fold-change)| ≥log2 (1.5), and Bayes factor at least 10. See Table 1 for additional information on classification of each mutation. (B) As panel A, but for the indicated U2AF1 mutations. (C) Venn diagram illustrating the sets of coding genes containing cassette exons and mutually exclusive exons that were differentially spliced in association with both hotspot and rare SRSF2 and/or U2AF1 mutations relative to control WT-expressing cells. Differentially spliced exons were defined as those exhibiting a change in isoform ratio at least 10% and a Bayes factor at least 1. Diagram restricted to genes containing cassette exons or mutually exclusive exons that were differentially spliced in association with at least 3 SRSF2P95-like mutations (SRSF2R86_G93dup, SRSF2R94_P95insR, SRSF2P95H, SRSF2P95_R102del, and SRSF2P95_R102del + P107H considered) and 3 U2AF1S34-like mutations (U2AF1I24T, U2AF1I24V, and U2AF1S34F considered). (D) Inclusion of a cassette exon within IRAK4 in K562 cells expressing each indicated U2AF1 allele. Error bars represent 95% confidence intervals as estimated by MISO.55 (E) As in panel (D), but for cells expressing each indicated SRSF2 allele.
Hotspot and rare SRSF2 and U2AF1 induce transcriptome dysregulation and converge on H2AFY and IRAK4 mis-splicing. (A) Scatter plot comparing the numbers of differentially expressed genes (x-axis) and differentially spliced cassette exons (y-axis) in K562 cells expressing each indicated SRSF2 mutation vs WT-expressing control cells. Differentially expressed genes were defined as those genes with expression at least 1 TPM in both samples, |log2 (fold-change)| ≥log2 (1.5), and Bayes factor at least 10. See Table 1 for additional information on classification of each mutation. (B) As panel A, but for the indicated U2AF1 mutations. (C) Venn diagram illustrating the sets of coding genes containing cassette exons and mutually exclusive exons that were differentially spliced in association with both hotspot and rare SRSF2 and/or U2AF1 mutations relative to control WT-expressing cells. Differentially spliced exons were defined as those exhibiting a change in isoform ratio at least 10% and a Bayes factor at least 1. Diagram restricted to genes containing cassette exons or mutually exclusive exons that were differentially spliced in association with at least 3 SRSF2P95-like mutations (SRSF2R86_G93dup, SRSF2R94_P95insR, SRSF2P95H, SRSF2P95_R102del, and SRSF2P95_R102del + P107H considered) and 3 U2AF1S34-like mutations (U2AF1I24T, U2AF1I24V, and U2AF1S34F considered). (D) Inclusion of a cassette exon within IRAK4 in K562 cells expressing each indicated U2AF1 allele. Error bars represent 95% confidence intervals as estimated by MISO.55 (E) As in panel (D), but for cells expressing each indicated SRSF2 allele.
Rare SRSF2 and U2AF1 mutations converge on a small set of disease-relevant events
Although SRSF2 and U2AF1 mutations induce distinct alterations in RNA splicing, we wondered whether they might converge on shared downstream targets that contribute to their enrichment in hematologic disease. We speculated that such targets might exhibit concordant differential splicing in association with both hotspot and rare mutations. We therefore identified cassette and mutually exclusive exons within coding genes that were differentially spliced in association with at least 3 of the 5 SRSF2P95-like mutations and compared that set with differentially spliced exons found in association with 3 of the U2AF1S34-like mutations. As expected, given SRSF2 and U2AF1 mutations’ distinct consequences for splicing, as well as these lesions’ preferential enrichment in different disease subtypes,1,49 the vast majority of differentially spliced exons were SRSF2- or U2AF1-specific. However, 3 genes were differentially spliced in association with both SRSF2 and U2AF1 mutations (Figure 4C), of which H2AFY and IRAK4 were particularly notable, given their known involvement in hematologic disease. Previous studies demonstrated that U2AF1S34F/Y promotes inclusion of the upstream exon of 2 mutually exclusive exons within H2AFY, which encodes macro-H2A1, thereby perturbing erythroid and granulomonocytic differentiation.23,44,45 U2AF1S34F similarly promotes inclusion of an IRAK4 cassette exon to drive the IRAK4-long isoform that activates innate immune signaling and is important for leukemic cell function24 (Figure 4D). Our analysis revealed that the rare mutations U2AF1I24T/V phenocopied the H2AFY and IRAK4 mis-splicing characteristic of U2AF1S34F/Y-mutant cells, and furthermore, that both SRSF2P95 and SRSF2P95-like mutations drove H2AFY, as well as IRAK4 differential splicing (Figure 4C; supplemental Table 1). Intriguingly, however, SRSF2 mutations drove H2AFY and IRAK4 mis-splicing that was in direct opposition to that caused by U2AF1 mutations (Figure 4E; supplemental Table 3). As 2 of the 3 coding genes that are shared targets of both hotspot and rare SRSF2 and U2AF1 mutations have been previously implicated in the pathology of U2AF1-mutant cells, we speculate that differential splicing of H2AFY and IRAK4 may be similarly important for the functional consequences of SRSF2 mutations.
Discussion
In addition to characterizing the function of rare mutations in SRSF2 and U2AF1, our study illustrates a method for inferring mutational pathogenicity when a biological assay such as tumorigenesis is inaccessible. Although SRSF2 and U2AF1 mutations exhibit the genetic enrichment expected of driver lesions in many dysplastic and neoplastic disorders, they do not confer a growth advantage to cultured transformed cells and are dispensable for the maintenance of at least some xenografts.20,23,39,50 We therefore took advantage of the stereotyped changes in RNA splicing caused by SRSF2 and U2AF1 hotspot mutations, which have been directly linked to disease phenotypes,20-24 to classify rare mutations as candidate drivers or passengers. Although unbiased cluster analyses (Figure 1F-G) separated mutations similarly to subsequent mechanism-based analyses, only the latter can classify pathogenicity with reasonable confidence, given the known role of dysfunctional exon and splice site recognition in SRSF2- and U2AF1-mutant hematologic malignancies.
Our approach can confidently identify functionally active SRSF2 and U2AF1 mutations that alter ESE or 3′ splice site recognition, but cannot prove that any given mutation is functionally silent. Many cancer driver mutations directly or indirectly dysregulate gene expression, irrespective of the means by which they promote cancer, in a specific manner.29 Therefore, the concordance between our classification of mutations and the extent of transcriptome dysregulation that each induces (Figure 4A-B) suggests that SRSF2 and U2AF1 mutations that do not detectably alter exon or splice site recognition are likely passengers. However, we cannot rule out the possibility that some rare mutations promote disease through means that are undetectable via transcriptomic analyses. For example, recent studies have reported increased R loop formation in cells expressing SRSF2 and U2AF1 hotspot mutations (although a causative role for R loop formation in dysplastic hematopoiesis or tumorigenesis has not yet been demonstrated).47,48 Conversely, although our approach accurately tests whether individual rare mutations induce molecular phenocopies of pathogenic hotspot mutations, it only provides a likely estimate (not proof) of pathogenicity. Even variants that we classify as likely pathogenic should be interpreted with care and caution in a clinical setting.
A published structure of SRSF251 offers insight into the potential means by which rare and hotspot mutations cause convergent splicing alterations (supplemental Figure 6). Rare mutations affecting the P95 hotspot presumably induce a similar set of domain movements as those induced by SRSF2P95H/L/R,20 whereas S54 lies distal to the binding core, and so likely affects RNA binding indirectly. H99 interacts with the variable nucleotide in the CCNG motif, potentially explaining why SRSF2H99L did not induce detectable changes in ESE preference.
Our study has several implications for basic and translational studies of spliceosomal mutations. First, as many rare SRSF2 and U2AF1 mutations generate molecular phenocopies of the SRSF2P95, U2AF1S34, and U2AF1Q157 hotspot mutations, studying those hotspot mutations will also give insight into the pathology of diverse rarer mutations. Second, because rare and even private SRSF2 and U2AF1 mutations may be pathogenic, non-hotspot mutations should be considered in early detection and monitoring studies15 when feasible. Finally, when therapies designed to specifically target cells with spliceosomal mutations enter clinical practice,38,40,52,53 patients bearing non-hotspot spliceosomal mutations should be considered as candidates for these therapies. Although performing a whole-transcriptome analysis is not feasible in a clinical setting, continued study of both hotspot and hotspot-phenocopy mutations may reveal specific biomarkers of mutant SRSF2 and U2AF1 activity that can be used to rapidly classify novel spliceosomal mutations as drivers or passengers for precision medicine.
Other data that support this study’s findings are available from the authors upon reasonable request.
The online version of this article contains a data supplement.
The publication costs of this article were defrayed in part by page charge payment. Therefore, and solely to indicate this fact, this article is hereby marked “advertisement” in accordance with 18 USC section 1734.
Acknowledgments
The results shown here are in part based upon data generated by the TCGA Research Network: https://cancergenome.nih.gov/. This research was supported, in part, by the National Institutes of Health (NIH)/National Institute of Diabetes and Digestive and Kidney Diseases (R01 DK103854; R.K.B.), NIH/National Heart, Lung, and Blood Institute (R01 HL128239; R.K.B. and O.A.-W.), the Department of Defense Bone Marrow Failure Research Program (W81XWH-16-1-0059; R.K.B. and O.A.-W.), the EvansS Foundation (R.K.B. and O.A.-W.), the Henry & Marilyn Taub Foundation (O.A.-W.), and the NIH/National Cancer Institute (P30 CA015704; Genomics Shared Resources of the Fred Hutch/University of Washington Cancer Consortium). J.T. is supported by the Conquer Cancer Foundation of the American Society of Clinical Oncology, the American Association for Cancer Research, the American Society of Hematology, the Robert Wood Johnson Foundation, and the NIH/National Cancer Institute (K08 CA230319). O.A.-W. is supported by the Pershing Square Sohn Cancer Research Alliance. R.K.B. is a scholar of the Leukemia & Lymphoma Society (1344-18).
Authorship
Contribution: J.P. performed experiments and computational analyses; J.P. and R.K.B. wrote the paper; J.-J.K., B.C., A.R., J.T., and O.A.-W. provided patient material; and J.T.P. and K.N. contributed to data interpretation.
Conflict-of-interest disclosure: O.A.-W. has served as a consultant for H3 Biomedicine, Foundation Medicine Inc, Merck, and Janssen, serves on the Scientific Advisory Board of Envisagenics Inc, and has received prior research funding from H3 Biomedicine unrelated to the current manuscript.
Correspondence: Robert K. Bradley, 1100 Fairview Ave N, Seattle, WA 98109; e-mail: rbradley@fredhutch.org.

This feature is available to Subscribers Only
Sign In or Create an Account Close Modal