

Background:
Serum folate (SF), vitamin B12 (B12), and iron deficiencies (def) are common causes of nutritional anemias. These deficiencies are usually multifactorial, with nutritional and non-nutritional factors playing a role. SF, B12, and iron levels are usually ordered in the setting of anemia, and malnutrition with or without neurologic symptoms. Since folic acid fortification, the prevalence of SF def in the United States (US) is <1% in the general population. B12 def and iron def range between 6-12%, and 1-11% respectively depending on the population studied. The prevalence of nutritional anemias secondary to SF, B12, and/or iron def by racial groups in the US is poorly studied, and most data available focuses on non-Hispanic whites (NHW). We aimed to determine the prevalence of anemia secondary to nutritional deficiencies by racial groups in the US.
Methods:
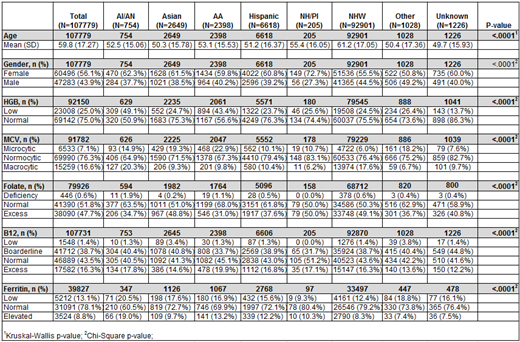
We performed a retrospective analysis of patients with SF, B12 and iron levels at Mayo Clinic Arizona between 01/2010 and 10/2018. Race was classified according to the NIH criteria. Normal laboratory values were determined according to our lab reference and the US National Health and Nutrition Examination Survey (NHANES) III. SF levels (mcg/Lt) were defined as deficient <4, normal ≥4.0, and excess ≥20. B12 levels (ng/L) as deficient <150, borderline 150-400, normal >400-900, and excess ≥900. Iron def was determined by ferritin levels (mcg/L) as low <24, normal 24-336, elevated ≥336 for men, low <11, normal 11-307, elevated ≥307 for women. Demographics and clinical variables were compared between groups by chi-square test for frequency data or Kruskal Wallis rank-sum test for continuous variables. Multivariable logistic regression was used for a sample-level analysis adjusting for age and gender and using NHW as a reference group.
Results:
A total of 79,926 SF, 107,731 B12, and 39,827 ferritin samples from 67,683 patients were analyzed. Demographics and sample analysis are presented in Table 1. In the sample-level analysis, 23,008 (25%) had anemia with higher prevalence in the American Indian/Alaskan Native (AI/AN) 49% and African Americans (AA) 43% (p<0.001). The prevalence of SF def was 446/79,926 (0.6%), B12 def 1,548/107,731 (1.4%), and iron def 5,212/39,827 (13.1%). 23 had concomitant SF and B12 deficiency, 25 SF and iron def, and 144 B12 and iron def. The SF def prevalence by racial groups was: AI/AN 11 (1.9%), AA 19 (1.1%), NHW 378 (0.6%), Hispanic 28 (0.5%), Asian 4 (0.2%). The B12 def prevalence by racial groups was: Asian 89 (3.4%), NHW 1,274 (1.4%), Hispanic 87 (1.3%), AA 30 (1.3%), AI/AN 10 (1.3%). Iron def prevalence by racial groups: AI/AN 71 (20.5%), Asian 198 (17.6%), AA 180 (16.9%), Hispanic 432 (15.6%), NHW 4,161 (12.4%). In the multivariate sample-level analysis, the presence of anemia was higher in the AI/AN (OR: 4.51, 95%CI: 3.70-5.49, p<0.0001), AA (OR 3.34, 95%CI: 2.99-3.74, p<0.0001), Asian (OR 1.52, 95%CI: 1.35-1.73, p<0.0001) and Hispanic racial group (OR 1.41, 95%CI: 1.30-1.52, p<0.0001). SF def was more common in the AI/AN (OR: 2.94, 95%CI: 1.60-5.39, p<0.001) and AA (OR 1.71, 95%CI: 1.08-1.53, p=0.02). B12 def was more common in the Asian racial group (OR: 2.535, 95%CI: 20.03-3.16, p<0.0001). Iron def was more common in the AI/AN (OR: 1.62, 95%CI: 1.21-2.17, p<0.001), Asian (OR 1.31, 95%CI: 1.0-1.57, p=0.003), and AA racial group (OR 1.26, 95%CI: 1.05-1.52, p=0.001).
Conclusions:
In our cohort, we show that despite the low prevalence of nutritional anemias in the US, racial disparities exist. Major differences were observed in the prevalence of anemia, SF def and iron def especially among AI/AN and AA. These differences may be linked to medical causes, nutritional practices and other social determinants of health. More research regarding the causes of these disparities and its clinical implications on a population level are needed. Targeted strategies to improve folate, B12 and iron intake in at higher risk populations could decrease adverse outcomes and decrease healthcare disparities caused by nutritional anemias.
Table 1. Sample-level comparison by race
No relevant conflicts of interest to declare.

This feature is available to Subscribers Only
Sign In or Create an Account Close Modal