

Background: Acute lymphoblastic leukemia (ALL) and acute myeloid leukemia (AML) are both heterogeneous diseases. The underlying changes that results in leukemia are due to developmental, genetic, or environmental effects, and are mostly mediated by changes in protein expression or modification. We hypothesize that there is a finite number of patterns of protein expression and protein pathway utilization, whose perturbations result in the hallmarks of cancer. In this study we performed differential proteomics of ALL and AML, with the goal to understand the underlying (disease-specific) cellular changes of AML and ALL, as well as to identify protein utilizations that are shared between AML and ALL.
Method: Reverse phase protein arrays (RPPA) was generated for 230 strictly validated antibodies using samples from 130 ALL and 241 AML patient samples, and 10 CD34+ samples from healthy controls. Expression levels were normalized relative to the normal CD34+ cells. Due to some inherent considerations of the traditional hierarchical clustering (HC) (e.g. HC weighs all proteins equally in all situations, HC is agnostic to all known functional relationships between proteins, HC requires that all data be considered and placed into a group), expression data was analyzed using the MetaGalaxyanalysis. This approach starts with the allocation of proteins into 31 protein functional groups (PFG). Progeny clustering was applied to identify an optimal number of protein clusters within each PFG. Block clustering identified protein clusters that recurrently co-occurred (protein constellation (CON)), and for each subgroup of patients that expressed similar combinations of protein constellations (patient signature (SIG)). Proteins that were differentially expressed were identified using the student's T-test or ANOVA, and a Bonferroni adjusted P-value (0.05/ 230 = 0.00021739).
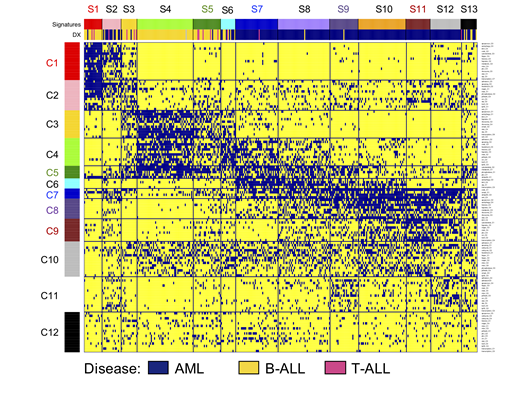
Results: The MetaGalaxy approach identified a substantial amount of structure across the data set (Figure 1), with an optimal number of 12 CON (horizontally) and 13 SIG (vertically). The majority of SIG were correlated with either ALL (SIG 1, 3, 4, 5) or AML (SIG7, 8, 9, 10, 11, 12) (annotation bar Figure 1), although SIG2, 6, and 13 contained a mixture of both (P< 0.001). Similarly, CON1, 2, 3 were mostly associated with ALL, CON6, 8, 9 and 11 with AML, while CON4, 5, 7 and 10 were observed in both diseases. To understand more about the protein signaling utilizations deregulated proteins were identified for each CON and SIG. For example, CON1 was associated with PFG Apoptosis Occurring (e.g. CASP9-cl330, PARP1), autophagy (e.g. PRKAA1_2, PRKAA1_2-pTyr172), and apoptosis BH3 (e.g. BCL2, BAD-pSer112).
In ALL, signature membership of CON5 was associated with a superior overall survival and complete remission duration (P= 0.016; P= 0.035). CON4 was associated with a high rate of early deaths (P = 0.041), but not with a higher frequency of relapses (P = 0.520). In AML, signatures were predictive for OS and CR, with SIG7, 10, 12 as being favorable vs SIG2, 6, 9, 11, 13 as being unfavorable. CON4 was predictive of late relapses (≥ 2 yr.). Interestingly, CON5 was associated with a trend toward inferior CR duration in AML (P= 0.093), whereas this CON5 was favorably prognostic in ALL.
Conclusion: In this study we confirmed our original hypothesis that there is a finite number of SIG in ALL and AML. Although, ALL and AML are both hematological diseases that share many molecular events, SIG and CON membership were significantly correlated with ALL and AML, confirming that protein expression patterns for the majority of cases of ALL ≠ AML. However, given that some CON were associated with both disease, this indicates that common features between both also exist. Proteins or pathways with similar utilization in both diseases may allow for information on clinical utility from one disease to be transitive to the other, while those with differential utilization are likely to be uninformative with respect to clinical utility in the other disease.
Figure 1. MetaGalaxy analysis for AML and ALL. Each row represents one protein clusters (n = 123), each column represents one patient (n = 371). Blue indicates membership for that particular protein cluster. Annotation bar shows strong correlation with disease (yellow = B-ALL, pink = T ALL, blue = AML).
No relevant conflicts of interest to declare.

This feature is available to Subscribers Only
Sign In or Create an Account Close Modal