

Key Points
Prdm16s transforms MEP cells into myeloid leukemia stem cells.
Prdm16s activates PU.1 expression, which is required for Prdm16s-induced leukemia.

Abstract
Oncogenic mutations confer on cells the ability to propagate indefinitely, but whether oncogenes alter the cell fate of these cells is unknown. Here, we show that the transcriptional regulator PRDM16s causes oncogenic fate conversion by transforming cells fated to form platelets and erythrocytes into myeloid leukemia stem cells (LSCs). Prdm16s expression in megakaryocyte-erythroid progenitors (MEPs), which normally lack the potential to generate granulomonocytic cells, caused AML by converting MEPs into LSCs. Prdm16s blocked megakaryocytic/erythroid potential by interacting with super enhancers and activating myeloid master regulators, including PU.1. A CRISPR dropout screen confirmed that PU.1 is required for Prdm16s-induced leukemia. Ablating PU.1 attenuated leukemogenesis and reinstated the megakaryocytic/erythroid potential of leukemic MEPs in mouse models and human AML with PRDM16 rearrangement. Thus, oncogenic PRDM16s expression gives MEPs an LSC fate by activating myeloid gene regulatory networks.
Introduction
A cardinal feature of malignancy is the acquisition of unlimited self-replicative capacity by cells devoid of this property. Cancer cells capable of self-replication, or cancer stem cells (CSCs), perpetuate disease by producing nontumorigenic cancer cells while maintaining the tumorigenic cell population.1,2 CSCs have been identified in a number of human hematological malignancies, including acute myeloid leukemia (AML),3,4 chronic myeloid leukemia,5 and myelodysplastic syndromes.6 In human AML, leukemia stem cells (LSCs) have been identified in hematopoietic stem cells (HSCs),3,4 multipotent progenitors (MPPs), and myeloid progenitors.7 LSCs have been identified in granulocyte-macrophage progenitors (GMPs), termed leukemic GMPs, in murine AML models induced by MLL fusion oncogenes and blast-crisis chronic myeloid leukemia models.8-11 Thus, multipotent (HSCs and MPPs) and myeloid progenitors, which have granulocytic/monocytic lineage potential, can be LSCs in myeloid leukemia. Because enforced expression of certain factors has been reported to change the fate of hematopoietic cells,12,13 it is possible that cells without granulocytic/monocytic potential also can become myeloid LSCs. However, the extent to which LSCs are created from cells of a different lineage through fate conversion during leukemogenesis remains unknown.
PR/SET domain containing 16 (PRDM16, also called MEL1) is a zinc finger transcriptional regulator that is structurally similar to the MDS1 and EVI1 complex locus (MECOM).14 PRDM16 and MECOM both have a PR/SET domain, conserved among lysine methyltransferases,15 in the N-terminus followed by zinc finger domains. PRDM16 and MECOM are rearranged in a subset of myelodysplastic syndrome and AML patients. Notably, the t(1;3)(p36;q21) translocation involving PRDM16 and inv(3)(q21q26.2) or t(3;3)(q21;q26.2) involving MECOM place these genes under the control of an enhancer element of the GATA2/RPN1 locus at 3q21, leading to overexpression of PRDM16 or MECOM.16-18 Leukemia cells in patients with these translocations typically express the short forms of these genes that lack the PR/SET domain, PRDM16s and EVI1, respectively.18-23 Patients with PRDM16s or EVI1 overexpression have poor prognosis,24-26 and these short-form genes have more oncogenic potential than their full-length isoforms.23,27-29 However, how PRDM16s dysregulates myeloid differentiation and self-renewal remains unclear.
Studies using adipocytes have demonstrated that PRDM16 is a master regulator of cell fate. Overexpression of PRDM16 in white adipocytes or myoblasts forces them to adopt a brown adipocyte fate.30,31 Prdm16 also regulates the maintenance of HSCs and neural progenitor cells.32-36 These findings raise the possibility that increased PRDM16 expression in malignant cells may dysregulate cell fate and confer some features of stem cells.
Here we demonstrate that Prdm16s causes oncogenic fate conversion, conferring a malignant myeloid cell fate on cells in the megakaryocytic/erythroid lineage and transforming them into myeloid LSCs. Expression of Prdm16s in murine hematopoietic progenitor cells caused myeloid leukemia with expansion of megakaryocyte-erythroid progenitors (MEPs) that had LSC potential. Prdm16s occupied the super enhancers of myeloid master transcriptional regulators, activating a myeloid gene network to block the megakaryocytic/erythroid potential of MEPs. A CRISPR dropout screen identified the myeloid transcription factor PU.1 as a vulnerability of Prdm16s-induced leukemia, attenuation of which not only suppressed leukemogenesis but also partly reinstated the megakaryocytic potential of Prdm16s MEPs. These results establish that oncogenic PRDM16 expression causes malignant fate conversion to initiate myeloid leukemia.
Materials and methods
Mice
C57BL/Ka-Thy-1.2 (CD45.1) or C57BL/Ka-Thy-1.1 (CD45.2) mice (8-12 weeks of age) were used for murine transplantation assays. NOD.Cg-Prkdcscid Il2rgtm1Wjl Tg(CMV-IL3,CSF2,KITLG)1Eav/MloySzJ (NSG-SGM3; JAX 013062) mice were used for xenotransplantation. Mice were housed in American Association for Accreditation of Laboratory Animal Care–accredited, specific pathogen–free animal care facilities at Baylor College of Medicine. All procedures were approved by Baylor College of Medicine Institutional Animal Care and Use Committees.
Patient samples
Sample collection was performed under LAB01-473 protocol from patients who consented to participate in the tissue banking protocol. Patients with 1p36 translocation were searched using the MD Anderson Leukemia Center Data Repository between 2005 and 2015. Nineteen patients were identified as carrying 1p36 translocation by conventional karyotyping. Among those, 4 patients were confirmed to have rearrangements involving PRDM16 by whole-genome sequencing. As a control, we also used 6 AML patient samples that had normal cytogenetics by conventional karyotyping. All procedures were approved by MD Anderson institutional review board committees.
Retroviral bone marrow transduction assays
Bone marrow lineage−Sca-1+c-kit+ (LSK) and MEPs were sorted and incubated in X-Vivo15 (Lonza, Allendale, NJ) supplemented with 50 ng/mL of stem cell factor, 50 ng/mL of thrombopoietin, 10 ng/mL of interleukin-3 (IL-3), 10 ng/mL of IL-6, and 20 ng/mL of erythropoietin (all from Peprotech, Rocky Hill, NJ) for 24 hours. After incubation, cells were spin infected with retroviral supernatant (multiplicity of infection, 5) supplemented with polybrene (8 ng/mL) in retronectin-coated (Clontech, Mountain View, CA) plates at 490g for 45 minutes at 20°C. A total of 50 000 cells were transplanted into lethally irradiated C57BL/6 mice; 200 000 competitor cells were used for limiting dilution transplantation.
CRISPR/Cas9-mediated gene editing
Genome editing was performed as described previously.37,38 Murine leukemic MEPs (L-MEPs) were cultured in complete X-Vivo 15 for 8 hours and electroporated using a Neon transfection system (ThermoFisher Scientific, Waltham, MA) using the following parameters: 1400 V, 30 ms, 1 pulse with 1 µg of Cas9 protein and 1 µg of single-guide RNA (sgRNA). After electroporation, edited cells were cultured and counted every 2 days to monitor cell proliferation. To delete genes from patient AML samples, cells were thawed and cultured in Iscove modified Dulbecco medium supplemented with 15% fetal bovine serum, 100 ng/mL of human stem cell factor, 50 ng/mL of human FLT3L, 20 ng/mL of human IL-3, 20 ng/mL of human granulocyte colony-stimulating factor, and 10−4 M β-ME 24 hours before electroporation and electroporated using the following parameters: 1300 V, 30 ms, 1 pulse with 1 µg of Cas9 protein and 1 µg of sgRNA.
CRISPR dropout screen
A total of 770 genes with largest log2 fold change and significant P values were selected from the RNA sequencing (RNA-seq) gene list upregulated in Prdm16s-expressing cells (L-MEPs and bulk of leukemia); 4 to 10 sgRNAs per gene against these 770 genes (total sgRNAs, 3918) were designed and synthesized as described previously.39 L-MEPs cultured in complete X-Vivo 15 were transduced with the 770-gene guide RNA lentiviral library (multiplicity of infection, 0.3), sorted for BFP+ cells that were infected, and then transduced with a lentiviral Cas9 vector. Screening and analysis were performed as previously described.39
CUT&RUN
Results
Prdm16s expression in HSPCs causes myeloid leukemia
As reported previously,32,33 Prdm16 was expressed highly in murine hematopoietic stem/progenitor cells (HSPCs) compared with mature cells (Figure 1A). HSPCs expressed both the full-length Prdm16 and Prdm16s to varying degrees (supplemental Figure 1A-B, available on the Blood Web site). To determine how Prdm16 causes myeloid malignancies, we transduced wild-type LSK cells with retroviral vectors encoding full-length Prdm16 or Prdm16s. We confirmed comparable transduction efficiencies by Prdm16 and Prdm16s by flow cytometry, immunoblotting, and standard-curve Taqman quantitative polymerase chain reaction (supplemental Figure 1C-F). Equal numbers of transduced (GFP+) cells were transplanted into syngeneic recipient mice. Prdm16-transduced cells caused myeloid diseases after long latency, whereas Prdm16s-transduced cells caused a highly penetrant myeloid disease with a shorter latency (median survival, 307 days for Prdm16 and 205 days for Prdm16s), prompting us to focus on the Prdm16s-induced model (Figure 1B). Both Prdm16- and Prdm16s-transformed cells reconstituted the myeloid lineage but contributed little to B- and T-cell lineages (Figure 1C; supplemental Figure 1G-H). The myeloid disease initiated by Prdm16s was characterized by splenomegaly with infiltration of myeloid blasts (Figure 1D-E; supplemental Figure 1I-J), leukocytosis, anemia, thrombocytopenia (Figure 1F), and increased leukemic cells in the peripheral blood (Figure 1D). Prdm16s-expressing cells in the peripheral blood were mostly Mac-1/Gr-1+ and were negative for megakaryocytic/erythroid markers CD71, CD41, CD42, and Ter119 (supplemental Figure 1K). On the basis of the frequencies of blast cells (typically <20% in the bone marrow) and the abundance of differentiated myeloid cells, the disease caused by Prdm16s was classified as myeloproliferative disease–like myeloid leukemia according to the Bethesda classification.42 We performed secondary transplantations to determine whether this Prdm16s-induced leukemia model had LSCs. Secondary transplantation of bone marrow cells expressing Prdm16s caused myeloid leukemia with a shorter latency than that seen in the primary recipient mice (Figure 1G). Most secondary recipients exhibited >20% blasts in the marrow, suggesting that the myeloproliferative disease–like myeloid leukemia had progressed to AML. Thus, Prdm16s is a potent oncogene, the induction of which is sufficient to cause myeloid leukemias.
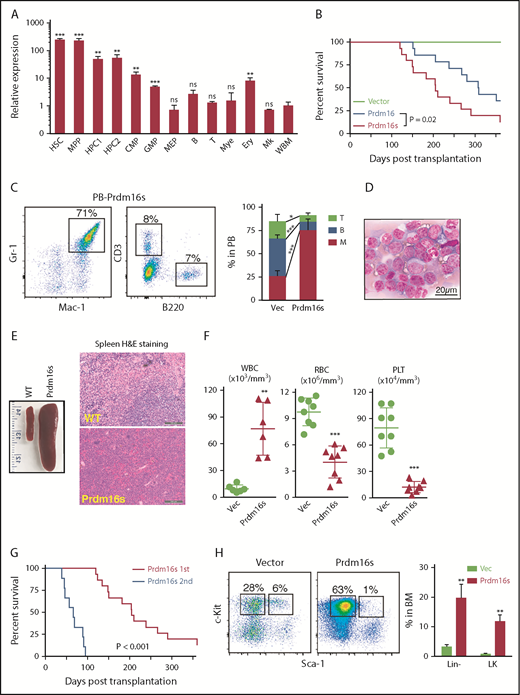
Prdm16s expression in HSPCs causes AML. (A) Relative expression levels of Prdm16 in murine hematopoietic cells compared with whole bone marrow (WBM) cells (n = 3). (B) Survival of mice after transplanting LSK cells transduced with empty vector (vec; n = 10), Prdm16 (n = 14), or Prdm16s (n = 15). (C) Flow cytometric analysis revealed increased myeloid cells (Mac-1/Gr-1+) in the peripheral blood (PB) of recipients transplanted with Prdm16s-transduced LSK cells compared with vector-transduced LSK cells (n = 10). (D-E) Representative images of Wright-Giemsa–stained PB cells (D) and spleens from wild-type (WT) mice and mice transplanted with Prdm16s-transduced LSK cells (E). (F) Increased white blood cells (WBCs; n = 6), decreased red blood cells (RBCs; n = 8), and platelets (PLTs; n = 8) in recipient mice of Prdm16s-transduced cells. (G) Secondary recipients (n = 10) of Prdm16s-transduced cells developed AML with a shorter latency than the primary recipient mice (n = 15). (H) Increased lineage− and lineage−Sca-1−c-kit+ (LK) myeloid progenitor cells in the bone marrow (BM) of recipients transplanted with Prdm16s-transduced cells (n = 5). Flow cytometric plots are gated on lineage− cells. All data represent mean ± standard deviation. *P < .05, **P < .01, ***P < .001 by Student t test, except for comparison of survival curves, in which significance was assessed by log-rank test. B, B cell; CMP, common myeloid progenitor; Ery, erythrocyte; H&E, hematoxylin and eosin; HPC, hematopoietic progenitor cell; Mk, megakaryocyte; Mye, myeloid cell; ns, not significant; T, T cell.
Prdm16s expression in HSPCs causes AML. (A) Relative expression levels of Prdm16 in murine hematopoietic cells compared with whole bone marrow (WBM) cells (n = 3). (B) Survival of mice after transplanting LSK cells transduced with empty vector (vec; n = 10), Prdm16 (n = 14), or Prdm16s (n = 15). (C) Flow cytometric analysis revealed increased myeloid cells (Mac-1/Gr-1+) in the peripheral blood (PB) of recipients transplanted with Prdm16s-transduced LSK cells compared with vector-transduced LSK cells (n = 10). (D-E) Representative images of Wright-Giemsa–stained PB cells (D) and spleens from wild-type (WT) mice and mice transplanted with Prdm16s-transduced LSK cells (E). (F) Increased white blood cells (WBCs; n = 6), decreased red blood cells (RBCs; n = 8), and platelets (PLTs; n = 8) in recipient mice of Prdm16s-transduced cells. (G) Secondary recipients (n = 10) of Prdm16s-transduced cells developed AML with a shorter latency than the primary recipient mice (n = 15). (H) Increased lineage− and lineage−Sca-1−c-kit+ (LK) myeloid progenitor cells in the bone marrow (BM) of recipients transplanted with Prdm16s-transduced cells (n = 5). Flow cytometric plots are gated on lineage− cells. All data represent mean ± standard deviation. *P < .05, **P < .01, ***P < .001 by Student t test, except for comparison of survival curves, in which significance was assessed by log-rank test. B, B cell; CMP, common myeloid progenitor; Ery, erythrocyte; H&E, hematoxylin and eosin; HPC, hematopoietic progenitor cell; Mk, megakaryocyte; Mye, myeloid cell; ns, not significant; T, T cell.
Prdm16s transforms MEPs into LSCs
To identify the LSC population in this myeloid leukemia model, we analyzed the bone marrow of recipient mice by flow cytometry. The frequencies of HSCs and MPPs were significantly reduced (supplemental Figure 1L-M), whereas the lineage−Sca-1−c-kit+ myeloid progenitor population was significantly expanded (Figure 1H). The GMP fraction is often found to have leukemia-initiating potential in myeloid malignancy models, and these cells are termed leukemic GMPs.8-10 Surprisingly, despite the aberrant myeloid expansion induced by Prdm16s expression, we found that GMPs and common myeloid progenitors were depleted, but the number of MEPs was increased (Figure 2A). To determine whether the Prdm16s-expressing MEPs or GMPs had LSC potential, we isolated both populations from primary myeloid leukemia recipient mice and transplanted them into secondary recipient mice. Transformed MEPs isolated from leukemic mice caused fully penetrant myeloid leukemia (Figure 2B), whereas the same numbers of GMPs or lineage−c-kit− cells rarely caused any diseases (supplemental Figure 2A-B), suggesting that MEPs are the LSCs in this model. Limiting dilution transplantation assays revealed that the LSC frequency in the bulk of leukemic cells was 1 in 2623 cells, whereas LSCs represented 1 in 29 cells for MEPs, a 90-fold enrichment of LSCs compared with the bulk of leukemia (Figure 2C). Therefore, MEPs are highly enriched for LSCs in this Prdm16s-induced myeloid leukemia model.
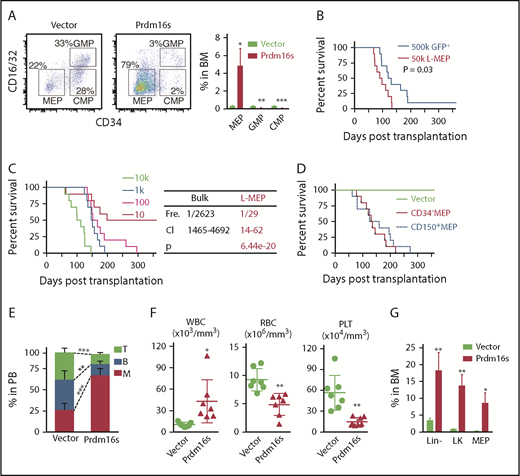
MEPs initiate myeloid leukemias upon Prdm16s expression. (A) Flow cytometric plots showing the expansion of MEPs but not GMPs or common myeloid progenitors (CMPs) in mice transplanted with Prdm16s-transduced LSK cells in comparison with vector-transduced cells. Cells are gated on lineage−Sca-1−c-kit+ (LK) cells (n = 10). (B) Survival of mice after transplanting 500 000 GFP+ bulk leukemia cells or 50 000 MEPs isolated from primary recipient mice (n = 10). (C) A limiting dilution transplantation assay revealed that L-MEPs are highly enriched for LICs (1 in 29; n = 10). Frequency (Fre), 95% confidence interval (CI), and P value are shown on right. (D) CD34− or CD150+ MEPs were isolated from wild-type mice, and transplantation of these cells after transducing with Prdm16s caused myeloid diseases with similar latencies (n = 10). (E-G) Recipient mice (n = 5) of Prdm16s-transduced, but not vector-transduced, MEPs had expansion of myeloid cells compared with recipient mice (E), increased white blood cells (WBCs) and reduced red blood cells (RBCs) and platelets (PLTs) (F), and increased lineage−, lineage−Sca-1−c-kit+ (LK), and MEPs (G). All data represent mean ± standard deviation. *P < .05, **P < .01, ***P < .001 by Student t test, except for comparison of survival curves, in which significance was assessed by log-rank test. BM, bone marrow; PB, peripheral blood.
MEPs initiate myeloid leukemias upon Prdm16s expression. (A) Flow cytometric plots showing the expansion of MEPs but not GMPs or common myeloid progenitors (CMPs) in mice transplanted with Prdm16s-transduced LSK cells in comparison with vector-transduced cells. Cells are gated on lineage−Sca-1−c-kit+ (LK) cells (n = 10). (B) Survival of mice after transplanting 500 000 GFP+ bulk leukemia cells or 50 000 MEPs isolated from primary recipient mice (n = 10). (C) A limiting dilution transplantation assay revealed that L-MEPs are highly enriched for LICs (1 in 29; n = 10). Frequency (Fre), 95% confidence interval (CI), and P value are shown on right. (D) CD34− or CD150+ MEPs were isolated from wild-type mice, and transplantation of these cells after transducing with Prdm16s caused myeloid diseases with similar latencies (n = 10). (E-G) Recipient mice (n = 5) of Prdm16s-transduced, but not vector-transduced, MEPs had expansion of myeloid cells compared with recipient mice (E), increased white blood cells (WBCs) and reduced red blood cells (RBCs) and platelets (PLTs) (F), and increased lineage−, lineage−Sca-1−c-kit+ (LK), and MEPs (G). All data represent mean ± standard deviation. *P < .05, **P < .01, ***P < .001 by Student t test, except for comparison of survival curves, in which significance was assessed by log-rank test. BM, bone marrow; PB, peripheral blood.
The finding that MEPs in the Prdm16s-induced leukemia model had LSC potential prompted us to examine whether normal MEPs could be directly transformed by Prdm16s to initiate myeloid diseases. We therefore isolated MEP (lineage−Sca-1−c-kit+CD34−CD16/32− cells, referred to as CD34− MEPs43 ), transduced them with Prdm16s, and transplanted them into recipient mice (supplemental Figure 2C). After Prdm16s expression, MEPs caused myeloid leukemia with slightly faster latency (P = .01) in recipient mice compared with LSK cells (Figure 2D-F; supplemental Figure 2D-E) with significant expansion of MEPs (Figure 2G). Transduction of MEPs identified by a distinct set of markers (lineage−Sca-1−c-kit+CD150+CD41−CD71− cells, referred to as CD150+ MEPs44 ) with Prdm16s also caused leukemia with a similar latency (Figure 2D; supplemental Figure 2D-E). Secondary transplantation from these primary recipient mice also caused AML (supplemental Figure 2F). In contrast, transduction of normal lymphoid-primed multipotential progenitors or GMPs, both of which lack megakaryocytic potential, rarely caused leukemia (supplemental Figure 2G-H). Prdm16s-expressing MEPs gained extensive proliferative potential in vitro, as determined by serial replating assays (supplemental Figure 2I). These results establish that Prdm16s-expressing MEPs have the capacity to initiate myeloid leukemia and that Prdm16s is sufficient to transform MEPs into LSCs. We therefore refer to the leukemia-initiating MEP population in this model as leukemic MEPs (L-MEPs).
Prdm16s activates myeloid gene regulatory networks in MEPs
To determine whether L-MEPs resemble MEPs in terms of both cell surface marker expression and gene expression profiles, we performed RNA-seq of L-MEPs and compared the gene expression profiles of L-MEPs with those of a wide range of hematopoietic cell populations with a pairwise gene set enrichment analysis (GSEA; Figure 3A-B). In brief, gene expression data sets of multiple hematopoietic cell populations45 were compared in a pairwise manner to assess the enrichment of the L-MEP gene signature. This revealed that the L-MEP signature was significantly enriched in MEPs and erythroid progenitors (Figure 3B; supplemental Table 1), indicating that L-MEPs are indeed transcriptionally similar to normal MEPs. We also found that the L-MEP signature was enriched in long- and short-term HSCs and macrophages (Figure 3B), suggesting that L-MEPs gain features of stem and myeloid cells.
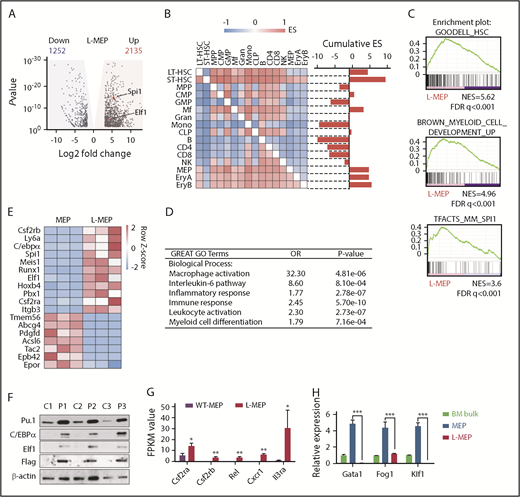
Prdm16s activates myeloid gene regulatory networks in MEPs. (A) A volcano plot showing genes with log2 fold change >0.5 (shaded in yellow; 2135 genes) or < −0.5 (shaded in blue; 1252 genes) with adjusted P < .05 that are differentially expressed in L-MEPs compared with normal MEPs. Two ETS factors, Spi1 and Elf1, are indicated. (B) Pairwise GSEA assessing the enrichment of L-MEP gene signature in different hematopoietic populations revealed that normal MEPs, erythroid progenitors, HSCs, and macrophages are enriched in L-MEP genes, as shown by the positive cumulative enrichment scores (ESs). (C) GSEA showed that L-MEPs were enriched for HSC signature, myeloid development genes, and PU.1 target genes compared with normal MEPs. (D) Gene ontology (GO) analysis of L-MEPs compared with normal MEPs. (E) A heatmap showing the z scores of the differentially expressed genes in L-MEPs compared with normal MEPs. (F) Immunoblotting to detect PU.1, C/EBPα, Elf1, and FLAG-tagged Prdm16s from normal bone marrow (BM) cells (C1-3) and Prdm16s-induced AML cells (P1-3; n = 3). (G) Several Spi1 target genes were highly expressed in L-MEPs compared with normal MEPs (n = 3). (H) Megakaryocytic/erythroid regulators Gata1, Fog1, and Klf1 were highly expressed in MEPs but were downregulated in L-MEPs, as determined by quantitative polymerase chain reaction analysis. Expression levels are relative to those in control BM cells (n = 4). All data represent mean ± standard deviation. *P < .05, **P < .01, ***P < .001 by Student t test. B, B cell; CLP, common lymphoid progenitor; CMP, common myeloid progenitor; Ery, erythrocyte; FDR, false discovery rate; FPKM, fragments per kilobase million; Gran, granulocyte; LT, long term; Mf, macrophage; Mono, monocyte; NES, normalized enrichment score; NK, natural killer cell; ST, short term; WT, wild type.
Prdm16s activates myeloid gene regulatory networks in MEPs. (A) A volcano plot showing genes with log2 fold change >0.5 (shaded in yellow; 2135 genes) or < −0.5 (shaded in blue; 1252 genes) with adjusted P < .05 that are differentially expressed in L-MEPs compared with normal MEPs. Two ETS factors, Spi1 and Elf1, are indicated. (B) Pairwise GSEA assessing the enrichment of L-MEP gene signature in different hematopoietic populations revealed that normal MEPs, erythroid progenitors, HSCs, and macrophages are enriched in L-MEP genes, as shown by the positive cumulative enrichment scores (ESs). (C) GSEA showed that L-MEPs were enriched for HSC signature, myeloid development genes, and PU.1 target genes compared with normal MEPs. (D) Gene ontology (GO) analysis of L-MEPs compared with normal MEPs. (E) A heatmap showing the z scores of the differentially expressed genes in L-MEPs compared with normal MEPs. (F) Immunoblotting to detect PU.1, C/EBPα, Elf1, and FLAG-tagged Prdm16s from normal bone marrow (BM) cells (C1-3) and Prdm16s-induced AML cells (P1-3; n = 3). (G) Several Spi1 target genes were highly expressed in L-MEPs compared with normal MEPs (n = 3). (H) Megakaryocytic/erythroid regulators Gata1, Fog1, and Klf1 were highly expressed in MEPs but were downregulated in L-MEPs, as determined by quantitative polymerase chain reaction analysis. Expression levels are relative to those in control BM cells (n = 4). All data represent mean ± standard deviation. *P < .05, **P < .01, ***P < .001 by Student t test. B, B cell; CLP, common lymphoid progenitor; CMP, common myeloid progenitor; Ery, erythrocyte; FDR, false discovery rate; FPKM, fragments per kilobase million; Gran, granulocyte; LT, long term; Mf, macrophage; Mono, monocyte; NES, normalized enrichment score; NK, natural killer cell; ST, short term; WT, wild type.
To broadly identify gene signatures enriched in L-MEPs, we performed GSEA against the Molecular Signatures Database. L-MEPs were enriched for gene signatures associated with HSCs and myeloid development (Figure 3C), as well as for gene signatures of the HOXA9/MEIS1 pathway and inflammatory responses (supplemental Figure 3A-C; supplemental Table 2). Gene ontology analysis also revealed enrichment of gene ontology terms associated with myelopoiesis, immune responses, and inflammatory response in L-MEPs compared with normal MEPs (Figure 3D). Together, these results indicate that L-MEPs retain some transcriptional features of normal MEPs but ectopically gain signatures of stem and myeloid cells.
The finding that gene signatures associated with myeloid development were ectopically induced in L-MEPs raised the possibility that myeloid transcriptional regulators may be activated in L-MEPs. Our RNA-seq results showed that the most differentially upregulated genes in L-MEPs compared with normal MEPs included myeloid transcription factors Spi1 (encoding PU.1), Cebpa (encoding C/EBPα), Runx1, and Elf1 (Figure 3E). Immunoblotting with Prdm16s-induced AML cells revealed increased protein expression of these transcription factors (Figure 3F). Transcription factors that regulate HSC self-renewal, such as Meis1 and Erg, were also induced in L-MEPs compared with normal MEPs (Figure 3E). Additionally, GSEA revealed that PU.1 target genes, including Csf2ra, Csf2rb (granulocyte-macrophage colony-stimulating factor receptor), Rel, Cxcr1, and Il3ra, were induced in L-MEPs compared with normal MEPs (Figure 3C,G). In contrast, genes involved in megakaryocytic fate regulation, such as Gata1 and Klf1, were downregulated in L-MEPs compared with normal MEPs (Figure 3H). Overexpression of Gata1 in L-MEPs suppressed proliferation, suggesting that repression of Gata1 by Prdm16s promotes proliferation of MEPs (supplemental Figure 3D). Together, these results demonstrate that Prdm16s activates myeloid gene regulatory networks and suppresses the megakaryocytic gene program.
Prdm16s occupies the super enhancers of myeloid master regulators
Because PRDM16 has been shown to regulate gene expression in association with the epigenome, we performed chromatin immunoprecipitation followed by sequencing for histone modifications. We profiled histone H3 lysine 4 trimethylation (H3K4me3) to detect active promoters and histone H3 lysine 27 acetylation (H3K27ac) to detect active promoters and enhancers.46,47 L-MEPs and MEPs had 24 956 and 15 022 H3K4me3 peaks, respectively, among which 12 572 overlapped between the 2 cell types; they had 40 971 and 28 369 H3K27ac peaks, respectively, with 15 218 peaks overlapping (Figure 4A). The proximal promoters of Spi1 and Elf1 in L-MEPs were enriched for H3K4me3 (Figure 4B), consistent with the increased expression of these genes (Figure 3E). The Spi1 enhancer, which is required and sufficient to activate Spi1 expression,48,49 exhibited a significant accrual of H3K27ac modification (Figure 4B). These results suggest that transformation of MEPs into L-MEPs involves some changes to the enhancer landscape.
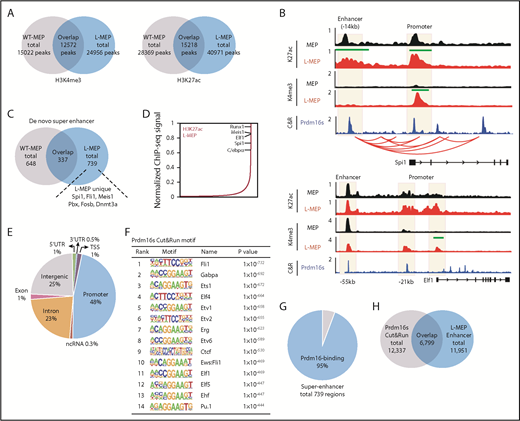
Prdm16s activates myeloid transcription factors by acting on super enhancers. (A) Overlaps in H3K4me3 and H3K27ac peaks between MEPs and L-MEPs (n = 3). (B) Genomic snapshot at the Spi1 and Elf1 loci showing H3K27ac and H3K4me3 chromatin immunoprecipitation followed by sequencing (ChIP-seq) in normal MEPs and L-MEPs (n = 3), Prdm16s CUT&RUN (C&R) in L-MEPs (n = 2), and promoter capture Hi-C data as shown by red arches. Peaks that are statistically different (P < 10−97) between L-MEPs and MEPs are indicated by green bars; y-axis represents counts per million reads. (C) Overlap in super enhancers between normal MEPs and L-MEPs (n = 3). (D) Distribution of H3K27ac density as determined by ChIP-seq data across super enhancers in L-MEPs (n = 3). (E) Distribution of Prdm16s C&R peaks in annotated regions of the genome (n = 2). (F) Motif analysis of Prdm16s binding sites identified by C&R revealed enrichment of motifs of myeloid transcription factors and CTCF. (G-H) Overlap between super enhancers (G) and typical enhancers (H) with Prdm16s binding site in L-MEPs. ncRNA, noncoding RNA; TSS, transcription start site; WT, wild type; UTR, untranslated region.
Prdm16s activates myeloid transcription factors by acting on super enhancers. (A) Overlaps in H3K4me3 and H3K27ac peaks between MEPs and L-MEPs (n = 3). (B) Genomic snapshot at the Spi1 and Elf1 loci showing H3K27ac and H3K4me3 chromatin immunoprecipitation followed by sequencing (ChIP-seq) in normal MEPs and L-MEPs (n = 3), Prdm16s CUT&RUN (C&R) in L-MEPs (n = 2), and promoter capture Hi-C data as shown by red arches. Peaks that are statistically different (P < 10−97) between L-MEPs and MEPs are indicated by green bars; y-axis represents counts per million reads. (C) Overlap in super enhancers between normal MEPs and L-MEPs (n = 3). (D) Distribution of H3K27ac density as determined by ChIP-seq data across super enhancers in L-MEPs (n = 3). (E) Distribution of Prdm16s C&R peaks in annotated regions of the genome (n = 2). (F) Motif analysis of Prdm16s binding sites identified by C&R revealed enrichment of motifs of myeloid transcription factors and CTCF. (G-H) Overlap between super enhancers (G) and typical enhancers (H) with Prdm16s binding site in L-MEPs. ncRNA, noncoding RNA; TSS, transcription start site; WT, wild type; UTR, untranslated region.
To identify genes with increased enhancer activity, we ranked genes based on H3K27ac signals in L-MEPs, a strategy used to identify super enhancers.47,50 This approach identified 739 and 648 super enhancers in L-MEPs and MEPs, respectively, among which 337 were shared between the 2 populations (Figure 4C). Several master regulators of myeloid cell fate, such as Spi1, Cebpa, and Runx1, were associated with super enhancers in L-MEPs (Figure 4C-D). Therefore, the L-MEP state is associated with a modified enhancer landscape to induce the expression of myeloid master regulators.
To determine whether Prdm16s occupies the regulatory elements of myeloid transcription factors induced in L-MEPs, we profiled genome-wide Prdm16s binding sites using CUT&RUN, a recently described high-resolution method that maps protein binding sites.40 In brief, FLAG-tagged Prdm16s and its associated DNA were released from chromatin using anti-FLAG antibodies and protein A–tagged micrococcal nuclease and sequenced. Prdm16s occupied promoters (48%), introns (23%), and distal intergenic regions (25%) in L-MEPs (Figure 4E). Motif analysis of the Prdm16s-occupied sites identified ETS factors ELF1 and PU.1, as well as CTCF, as having the most enriched motifs (Figure 4F). Prdm16s occupied the promoters and enhancers of myeloid master regulators Spi1 and Elf1 (Figure 4B), suggesting that Prdm16s binds to the enhancer elements of these transcription factors to promote their expression. Prdm16s occupied 95% and 57% of super enhancers and regular enhancers (defined by H3K27ac densities in L-MEPs), respectively (Figure 4G-H), demonstrating the enriched binding of Prdm16s to super enhancers. Integrative analysis using published data sets of Promoter Capture Hi-C51 revealed that the promoter and the enhancer of Spi1 occupied by Prdm16s indeed interact with each other (Figure 4B; supplemental Table 3). These data establish that Prdm16s occupies the super enhancer of a myeloid master regulator Spi1 that topologically associates with its promoter.
CRISPR dropout screen identifies myeloid transcriptional regulators required for Prdm16s-induced myeloid leukemia
To identify the genes that mediate the Prdm16s-induced transformation of MEPs, we designed a small sgRNA library targeting 770 candidate genes upregulated in L-MEPs compared with MEPs and genes upregulated in the bulk of the Prdm16s-expressing leukemia cells compared with normal hematopoietic cells (supplemental Table 4). L-MEPs were transduced with this lentiviral sgRNA library and Cas9, and sgRNA representation was analyzed by sequencing after 7 days of selection (Figure 5A). Interestingly, the top 2 hits in this CRISPR dropout screen were 2 myeloid transcription factors, Elf1 and Spi1 (Figure 5B). To verify these hits, we designed independent sgRNAs against Spi1 and Elf1 and electroporated them together with Cas9 protein into L-MEPs using a protocol optimized for small numbers of primary HSPCs.37,38 This approach reduced the protein expression levels of both PU.1 and Elf1 (Figure 5C; supplemental Figure 4A) and significantly impaired proliferation and colony formation of L-MEPs in vitro (Figure 5D; supplemental Figure 4B-C). Therefore, myeloid transcriptional regulators PU.1 and Elf1 are not only induced by Prdm16s in L-MEPs but also required for the extensive proliferative capacity of Prdm16s-induced myeloid leukemia cells.
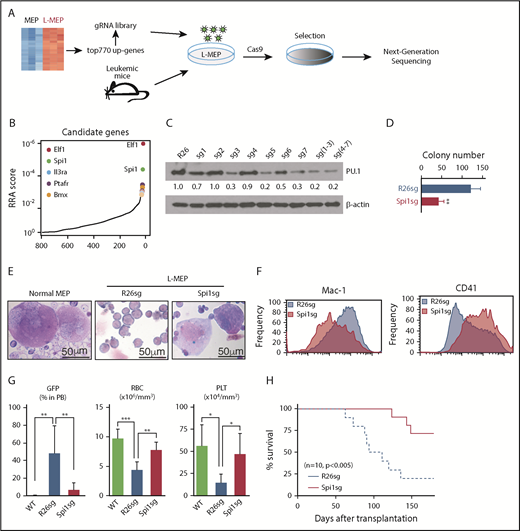
A CRISPR screen identifies Spi1 as a vulnerability of Prdm16s-induced AML. (A) A schematic of the targeted CRISPR dropout screen against 770 candidate genes identified by RNA-seq. (B) Top L-MEP essential genes identified by CRISPR dropout screening included 2 transcription factors Elf1 and Spi1. Top 5 genes with significant robust ranking aggregation (RRA) scores are highlighted. (C) Immunoblotting to detect PU.1 expression after CRISPR editing. Cells deleted of the Rosa26 locus (R26sg) were compared with cells deleted of Spi1 with different sgRNA (sg1-7). (D) In vitro validation of a candidate gene Spi1 by a colony assay (n = 4). (E) Megakaryocyte formation by normal MEPs (left) and L-MEPs with (right) or without (middle) Spi1 deletion shown by Wright-Giemsa staining (n = 4). L-MEPs were deleted of either control Rosa26 or Spi1 and plated. (F) Representative flow cytometric histograms showing that Spi1-deleted L-MEPs form cells with decreased Mac-1 expression (left) and increased CD41 expression (right) compared with control Rosa26-edited cells (n = 4). (G) Spi1 deletion reduced GFP+ AML cells in the blood and ameliorated anemia and thrombocytopenia of L-MEP recipients (n = 7). Rosa26- or Spi1-deleted L-MEPs or vector-transduced normal MEPs were transplanted and blood was analyzed by flow cytometry or a hematology analyzer. (H) Spi1 deletion prolonged the survival of recipient mice of L-MEPs (n = 10). Rosa26- or Spi1-deleted L-MEPs were transplanted as in panel G. All data represent mean ± standard deviation. *P < .05, **P < .01, ***P < .001 by Student t test, except for comparison of survival curves, in which significance was assessed by log-rank test. gRNA, guide RNA; PLT, platelet; RBC, red blood cell; WT, wild type.
A CRISPR screen identifies Spi1 as a vulnerability of Prdm16s-induced AML. (A) A schematic of the targeted CRISPR dropout screen against 770 candidate genes identified by RNA-seq. (B) Top L-MEP essential genes identified by CRISPR dropout screening included 2 transcription factors Elf1 and Spi1. Top 5 genes with significant robust ranking aggregation (RRA) scores are highlighted. (C) Immunoblotting to detect PU.1 expression after CRISPR editing. Cells deleted of the Rosa26 locus (R26sg) were compared with cells deleted of Spi1 with different sgRNA (sg1-7). (D) In vitro validation of a candidate gene Spi1 by a colony assay (n = 4). (E) Megakaryocyte formation by normal MEPs (left) and L-MEPs with (right) or without (middle) Spi1 deletion shown by Wright-Giemsa staining (n = 4). L-MEPs were deleted of either control Rosa26 or Spi1 and plated. (F) Representative flow cytometric histograms showing that Spi1-deleted L-MEPs form cells with decreased Mac-1 expression (left) and increased CD41 expression (right) compared with control Rosa26-edited cells (n = 4). (G) Spi1 deletion reduced GFP+ AML cells in the blood and ameliorated anemia and thrombocytopenia of L-MEP recipients (n = 7). Rosa26- or Spi1-deleted L-MEPs or vector-transduced normal MEPs were transplanted and blood was analyzed by flow cytometry or a hematology analyzer. (H) Spi1 deletion prolonged the survival of recipient mice of L-MEPs (n = 10). Rosa26- or Spi1-deleted L-MEPs were transplanted as in panel G. All data represent mean ± standard deviation. *P < .05, **P < .01, ***P < .001 by Student t test, except for comparison of survival curves, in which significance was assessed by log-rank test. gRNA, guide RNA; PLT, platelet; RBC, red blood cell; WT, wild type.
To examine whether these myeloid transcription factors regulate the myeloid cell fate of L-MEPs, we examined the type of colonies formed after deleting Spi1. Normal MEPs produced colonies containing megakaryocytes, whereas L-MEPs transduced with sgRNA against Rosa26 produced Mac-1/Gr-1+ myeloid cells with a blast-like morphology, consistent with the finding that Prdm16s confers an aberrant myeloid cell fate to MEPs (Figure 5E). Interestingly, Spi1-deleted L-MEPs produced cells with megakaryocytic morphologies (Figure 5E), with low expression of Mac-1 and increased expression of megakaryocytic markers CD41 (Figure 5F), Gata1, Fog1, and Klf1 (supplemental Figure 4D). Spi1 deletion did not affect the colony-forming ability of normal MEPs (supplemental Figure 4E). These results suggest that deletion of Spi1 attenuates the aberrant myeloid fate and at least partially restores the megakaryocytic potential of L-MEPs.
To determine whether PU.1 is required for leukemogenesis by Prdm16s-transformed L-MEPs, we transplanted control or Spi1-deleted L-MEPs into recipient mice. This study showed that deletion of Spi1 reduced leukemic burden (Figure 5G), ameliorated the anemia and thrombocytopenia observed in the recipient mice (Figure 5G), and significantly extended leukemia-free survival (Figure 5H). These results establish that Spi1 induced by Prdm16s is required, at least partially, for aberrant myeloid cell fate and leukemogenesis by L-MEPs.
Human AML with PRDM16 rearrangement depends on SPI1
We next examined whether human AML with PRDM16 rearrangement depends on SPI1. By whole-genome sequencing, we identified 4 AML patient samples with PRDM16 rearrangement (supplemental Figure 5; supplemental data; supplemental Table 5). Most bone marrow cells from these patients expressed myeloid/AML marker CD33 (Figure 6A; supplemental Figure 6A). Three samples had t(1;3)(p36;q21) translocation, placing the GATA2/RPN1 enhancer upstream of PRDM16, a phenomenon resembling EVI1 rearrangements (supplemental Figure 5A).16,17 One case had t(1;21)(p36;q22) translocation, placing the RUNX1 +23-kb enhancer upstream of PRDM16 and creating a chimeric transcript (supplemental Figure 5B). RNA-seq of these 4 samples, as well as 6 primary AML samples without PRDM16 rearrangement as controls, revealed that PRDM16 expression was significantly upregulated in the rearrangement cases compared with those without PRDM16 rearrangement (Figure 6B). These PRDM16-rearranged AMLs exhibited significant enrichment of genes upregulated in murine L-MEPs (supplemental Figure 6B). Immunoblotting with 2 cases (MDA14 and MDA16) of PRDM16-rearranged AML revealed that both specimens overexpressed PRDM16s (supplemental Figure 6C). We transplanted myeloblasts from 2 lines (MDA14 and MDA16) into NSG-SGM3 mice to generate patient-derived xenograft models. Both of these models exhibited splenomegaly with AML infiltration, increased white blood cell counts, and expansion of human myeloid cells (CD45+CD33+) and myeloblasts in the peripheral blood (Figure 6C-H). We verified that the expanded myeloid cells had the PRDM16 translocation by sequencing (supplemental Figure 5C-D).
![Figure 6. Human AML with PRDM16 rearrangments depends on SPI1 for leukemogenesis. (A) Flow cytometric analysis of 2 patient AML samples (patient 1, MDA14; patient 2, MDA16). (B) Quantification of PRDM16 expression by RNA-seq of primary human AML specimen with PRDM16 rearrangements (n = 4) compared with AML without PRDM16 rearrangement (n = 6). (C-H) The recipient mice transplanted with PRDM16-translocated human AML samples (MDA14 and 16, labeled as patient-derived xenograft [PDX]) had increased human CD45+ cells (C) and white blood cells (WBCs) (D) and development of AML (E) compared with mice transplanted with cord blood cells (CBs). The mice also exhibited increased human myeloid cells in the blood (F), splenomegaly (G), and immature blasts in the peripheral blood (PB; H). (I) PDX-derived AML cells were kept nonelectroporated (NC), electroporated with phosphate-buffered saline (PBS), electroporated with Cas9-RNP with a negative control (Ctrl) sgRNA (NCsg), or electroporated with 5 different sgRNAs against SPI1 (SPI1sg1-5). Immunoblotting and quantification show that deletion of SPI1 significantly reduced the protein expression of PU.1 as compared with Ctrl cells (NC, PBS, and NCsg). (J-K) SPI1 deletion by CRISPR/Cas9, as in panel I, attenuated the proliferation of human PRDM16-translocated AML cells compared with Ctrl cells (NC, PBS, and NCsg) (J) and increased the expression of FOG1 and GATA1 (n = 3) (K). Additional Ctrl includes AML cells edited for ENAM, a gene involved in amelogenesis. (L-M) Human AML cells were edited for ENAM or SPI1, transplanted, and analyzed 2 months later for the presence of human CD45+ cells in the PB (L) and bone marrow (BM; M). All data represent mean ± standard deviation. *P < .05, ***P < .001 by Student t test. B, B cell; M, myeloid cell; PLT, platelet; RBC, red blood cell; T, T cell.](https://ash.silverchair-cdn.com/ash/content_public/journal/blood/134/7/10.1182_blood.2018888255/3/m_blood888255f6.png?Expires=1770984570&Signature=uY0YZMfld-4OSIm~BSTLH~z5VqY50DstF5mK7on0UQ49eXT~-koOhK7aVJn-lAoQlM0HV-79tVzFom-ymWXyiwPQfZG7PTL9RDa4qCxjvw7Kp8qy-ECLnKyJHn~Sk2zq5Mz332KNEfzEJ~G4t2zPvG-neMSFsB9yoe7hqsG4znebvMTxpxpEdm3up2GrXl-hRaNEH-Z8rgCRqrly26hxMtCUbF1F1heZ6WVJfbChWdRoIfrPvItP8TLWxzpJ7XFQvB8I7uhHmBGeDvOJHVyQoOThhbF14tx-FVun2wWyWX1mb-F~ksLl7EMbpxARJ4VcF8KSagWNnBsqieI6RYBs4w__&Key-Pair-Id=APKAIE5G5CRDK6RD3PGA)
Human AML with PRDM16 rearrangments depends on SPI1 for leukemogenesis. (A) Flow cytometric analysis of 2 patient AML samples (patient 1, MDA14; patient 2, MDA16). (B) Quantification of PRDM16 expression by RNA-seq of primary human AML specimen with PRDM16 rearrangements (n = 4) compared with AML without PRDM16 rearrangement (n = 6). (C-H) The recipient mice transplanted with PRDM16-translocated human AML samples (MDA14 and 16, labeled as patient-derived xenograft [PDX]) had increased human CD45+ cells (C) and white blood cells (WBCs) (D) and development of AML (E) compared with mice transplanted with cord blood cells (CBs). The mice also exhibited increased human myeloid cells in the blood (F), splenomegaly (G), and immature blasts in the peripheral blood (PB; H). (I) PDX-derived AML cells were kept nonelectroporated (NC), electroporated with phosphate-buffered saline (PBS), electroporated with Cas9-RNP with a negative control (Ctrl) sgRNA (NCsg), or electroporated with 5 different sgRNAs against SPI1 (SPI1sg1-5). Immunoblotting and quantification show that deletion of SPI1 significantly reduced the protein expression of PU.1 as compared with Ctrl cells (NC, PBS, and NCsg). (J-K) SPI1 deletion by CRISPR/Cas9, as in panel I, attenuated the proliferation of human PRDM16-translocated AML cells compared with Ctrl cells (NC, PBS, and NCsg) (J) and increased the expression of FOG1 and GATA1 (n = 3) (K). Additional Ctrl includes AML cells edited for ENAM, a gene involved in amelogenesis. (L-M) Human AML cells were edited for ENAM or SPI1, transplanted, and analyzed 2 months later for the presence of human CD45+ cells in the PB (L) and bone marrow (BM; M). All data represent mean ± standard deviation. *P < .05, ***P < .001 by Student t test. B, B cell; M, myeloid cell; PLT, platelet; RBC, red blood cell; T, T cell.
Human AML with PRDM16 rearrangments depends on SPI1 for leukemogenesis. (A) Flow cytometric analysis of 2 patient AML samples (patient 1, MDA14; patient 2, MDA16). (B) Quantification of PRDM16 expression by RNA-seq of primary human AML specimen with PRDM16 rearrangements (n = 4) compared with AML without PRDM16 rearrangement (n = 6). (C-H) The recipient mice transplanted with PRDM16-translocated human AML samples (MDA14 and 16, labeled as patient-derived xenograft [PDX]) had increased human CD45+ cells (C) and white blood cells (WBCs) (D) and development of AML (E) compared with mice transplanted with cord blood cells (CBs). The mice also exhibited increased human myeloid cells in the blood (F), splenomegaly (G), and immature blasts in the peripheral blood (PB; H). (I) PDX-derived AML cells were kept nonelectroporated (NC), electroporated with phosphate-buffered saline (PBS), electroporated with Cas9-RNP with a negative control (Ctrl) sgRNA (NCsg), or electroporated with 5 different sgRNAs against SPI1 (SPI1sg1-5). Immunoblotting and quantification show that deletion of SPI1 significantly reduced the protein expression of PU.1 as compared with Ctrl cells (NC, PBS, and NCsg). (J-K) SPI1 deletion by CRISPR/Cas9, as in panel I, attenuated the proliferation of human PRDM16-translocated AML cells compared with Ctrl cells (NC, PBS, and NCsg) (J) and increased the expression of FOG1 and GATA1 (n = 3) (K). Additional Ctrl includes AML cells edited for ENAM, a gene involved in amelogenesis. (L-M) Human AML cells were edited for ENAM or SPI1, transplanted, and analyzed 2 months later for the presence of human CD45+ cells in the PB (L) and bone marrow (BM; M). All data represent mean ± standard deviation. *P < .05, ***P < .001 by Student t test. B, B cell; M, myeloid cell; PLT, platelet; RBC, red blood cell; T, T cell.
We then deleted SPI1 with the CRISPR/Cas9 system to test whether SPI1 is required for human AML with PRDM16 rearrangements. AML cells isolated from patient-derived xenograft models were electroporated with several sgRNAs against SPI1 and cultured. Immunoblotting confirmed that SPI1 was efficiently deleted in human AML cells (Figure 6I). Control AML cells either unelectroporated, electroporated without sgRNAs, or electroporated with an sgRNA against ENAM (encoding enamelin) expanded in culture over time; however, AML cells lacking SPI1 failed to expand in vitro (Figure 6J) and increased the expression of FOG1 and GATA1 (Figure 6K). We transplanted ENAM- or SPI1-deleted AML samples into NSG-SGM3 mice and analyzed human AML engraftment 2 months after transplantation. The frequency of SPI1-deleted AML cells in peripheral blood and bone marrow was significantly lower than that of ENAM-deleted AML cells (Figure 6L-M). Therefore, human AML with PRDM16 overexpression depends on SPI1.
Discussion
Ectopic expression of master regulators of cell fate has been shown to initiate lineage conversion in nontransformed cells, but whether lineage conversion occurs during malignant transformation remains an open question.12,52,53 Our results show that Prdm16s acts on super enhancers of myeloid transcription factors to confer an aberrant myeloid cell fate to megakaryocytic progenitors, thereby transforming them into AML stem cells.
To our knowledge, CSCs identified to date share phenotypic characteristics with the progenitor cell populations that generate the bulk of tumor cells. For instance, AML stem cells have been identified in immunophenotypic HSCs, MPPs, and GMPs, all of which have the potential to generate the granulomonocytic cells that make up the bulk of AML.3,4,7-10 Although our study does not rule out the possibility that cells other than MEPs may be the cells of origin for leukemogenesis in PRDM16-rearranged AML, it suggests that immunophenotypically defined MEPs participate in progression of the disease. For example, HSCs may accrue PRDM16 rearrangements, leading to the expansion of aberrantly self-renewing MEPs with a myeloid cell fate. The ability of PRDM16 to convert cell fate is consistent with the studies in adipocytes.30,31 However, formal proof that MEPs become transformed by Prdm16s in vivo will require sophisticated genetic tools, such as lineage tracing of MEPs.
Expression of PRDM16s in murine p53-deficient, but not in p53-proficient, lineage− cells has been shown to cause AML.18 We did not detect p53 mutations in either murine or human leukemias with PRDM16 overexpression (data not shown). The discrepancies between this study and ours in regard to p53 dependency are likely due to the differences in the cell population in which transformation was initiated (LSK or MEP vs lineage− cells). The relative importance of Prdm16 and Prdm16s in myeloid leukemias also remains unclear, because conflicting results have been reported.54,55
We found that Prdm16s activated myeloid gene regulatory networks orchestrated by multiple myeloid transcription factors, such as PU.1, C/EBPα, RUNX1, and ELF1, in MEPs. Some of these genes have been shown to confer a myeloid cell fate on cells of different lineages.12,56 Expression of PU.1 in T or B cells converts them to myeloid cells,57,58 whereas Gata1 converts myeloid cells to megakaryocytic/erythroid cells.59,60 Reprogramming with these transcription factors created cells with functional characteristics, such as phagocytic macrophages with T-cell receptor locus rearrangements, but no malignant transformation was reported with these processes. Although we demonstrate that the L-MEPs generated by Prdm16s depend on Spi1 for leukemogenesis, further work is needed to define the roles of transcription factors induced by Prdm16s in transforming megakaryocytic progenitor cells into LSCs. One possibility is that the ability of Prdm16s to induce multiple transcription factors, including myeloid master regulators and stem cell transcription factors (eg, Gfi1, Meis1, and Erg), places it hierarchically upstream of myeloid and stem cell programs, conferring the ability to produce self-renewing malignant myeloid cells.
PU.1 is considered a tumor suppressor in myeloid malignancies. Reduced Spi1 expression in mouse models causes AML,61-64 whereas overexpression of PU.1 induces myeloid differentiation.65 However, most human AML cases have only a modest reduction in SPI1 expression that does not recapitulate the significant reduction observed in mouse models. Because complete ablation of PU.1 impairs HSC maintenance and blocks myeloid development,66 inhibiting PU.1 may also provide a therapeutic window for AML.67 Our finding that PRDM16-expressing myeloid leukemias in both mice and humans are dependent on PU.1 suggests that PU.1 inhibitors may be efficacious in suppressing PRDM16-rearranged AML.
RNA-seq, chromatin immunoprecipitation followed by sequencing, and CUT&RUN data are available in the Gene Expression Omnibus database (accession number GSE119393). Human AML whole-genome sequencing and RNA-seq data are available at the European Genome-phenome Archive (EGAS00001003235).
The online version of this article contains a data supplement.
The publication costs of this article were defrayed in part by page charge payment. Therefore, and solely to indicate this fact, this article is hereby marked “advertisement” in accordance with 18 USC section 1734.
Acknowledgments
The authors thank Catherine Gillespie for her critical reading of the manuscript.
This work was supported by the Cancer Prevention and Research Institute of Texas (RP160035 and R1201) (D.N.), the Edward P. Evans Foundation (D.N.), the Vivian L. Smith Foundation (J.F.M.), the MacDonald Research Fund Award (16RDM001) (J.F.M.), the Foundation Leducq Transatlantic Networks of Excellence (J.F.M.), National Institutes of Health (NIH) National Cancer Institute (NCI) Leukemia SPORE Career Development grant P50 CA100632 (K.T.), the Khalifa Scholar Award (K.T.), the Physician Scientist Program at Anderson (K.T.), the Anderson Moon Shot for Research Platforms (P.A.F.), and NIH grants from the NCI (CA193235) (D.N.), National Institute of Diabetes and Digestive and Kidney Diseases (NIDDK) (DK107413) (D.N.), and the National Heart Lung and Blood Institute (HL127717, HL130804, and HL118761) (J.F.M.). Y.J. was supported by NIH NIDDK grant T32DK060445. Flow cytometry was partially supported by the NIH (National Center for Research Resources grant S10RR024574, National Institute of Allergy and Infectious Diseases grant AI036211, and NCI grant P30CA125123) for the Baylor College of Medicine Cytometry and Cell Sorting Core. RNA- and DNA-seq was partially supported by NIH NCI grant CA016672 for the Sequencing and Microarray Core Facility at Anderson.
Authorship
Contribution: T.H. conceived and performed most experiments, with help from Y.J. and A.K.; Y.S. performed some pilot experiments under the supervision of K. Morishita and D.N.; K. Morita, F.W., X.M., P.A.F., and K.T. analyzed human sequencing data; M.C.H. performed CUT&RUN experiments under the supervision of J.F.M.; K.A.H. and T.H. analyzed sequencing data from animal models; and T.H. and D.N. designed experiments, interpreted results, and wrote the manuscript.
Conflict-of-interest disclosure: The authors declare no competing financial interests.
Correspondence: Daisuke Nakada, Baylor College of Medicine, 1 Baylor Plaza, M225, Houston, TX 77030; e-mail: nakada@bcm.edu.

This feature is available to Subscribers Only
Sign In or Create an Account Close Modal