

Key Points
Murine in vivo modeling of PI3K-δ inhibitor resistance identifies hyperactivation of IGF1R signaling in resistant cells.
Targeting IGF1R offers efficacious salvage treatment of PI3K-δ inhibitor–resistant tumors.

Abstract
Targeted therapy is revolutionizing the treatment of cancers, but resistance evolves against these therapies and derogates their success. The phosphatidylinositol 3-kinase delta (PI3K-δ) inhibitor idelalisib has been approved for treatment of chronic lymphocytic leukemia (CLL) and non-Hodgkin lymphoma, but the mechanisms conferring resistance in a subset of patients are unknown. Here, we modeled resistance to PI3K-δ inhibitor in vivo using a serial tumor transfer and treatment scheme in mice. Whole-exome sequencing did not identify any recurrent mutation explaining resistance to PI3K-δ inhibitor. In the murine model, resistance to PI3K-δ inhibitor occurred as a result of a signaling switch mediated by consistent and functionally relevant activation of insulin-like growth factor 1 receptor (IGF1R), resulting in enhanced MAPK signaling in the resistant tumors. Overexpression of IGF1R in vitro demonstrated its prominent role in PI3K-δ inhibitor resistance. IGF1R upregulation in PI3K-δ inhibitor–resistant tumors was mediated by functional activation and enhanced nuclear localization of forkhead box protein O1 transcription factors and glycogen synthase kinase 3β. In human CLL, high IGF1R expression was associated with trisomy 12. CLL cells from an idelalisib-treated patient showed decreased sensitivity to idelalisib in vitro concomitant with enhanced MAPK signaling and strong upregulation of IGF1R upon idelalisib exposure. Thus, our results highlight that alternative signaling cascades play a predominant role in the resistance and survival of cancer cells under PI3K-δ inhibition. We also demonstrate that these pathway alterations can serve as therapeutic targets, because inhibition of IGF1R offered efficacious salvage treatment of PI3K-δ inhibitor–resistant tumors in vitro and in vivo.
Introduction
Cancer therapy has evolved over the past decade from largely unspecific chemotherapy to “targeted therapy” focusing on critical biological disease pathways, providing greater specificity and limiting side effects. Chronic lymphocytic leukemia (CLL) exemplifies the current paradigm shift in the treatment toward such targeted therapy. In CLL, chemotherapy is being replaced more and more by specific inhibitors of B-cell receptor (eg, phosphatidylinositol 3-kinase [PI3K] signaling1-3 ) and BCL2-specific BH3 mimetics4-6 with high clinical efficacy, even in cases with poor-risk biological features, such as defective p53.
Among the different druggable molecules, PI3K has become a favored target because it is 1 of the most commonly activated signal transduction pathways in cancer.7 Moreover, tissue-specific expression of the different PI3K isoforms makes targeted treatment of the tumor possible.8 Accordingly, targeting the PI3K-δ isoform expressed in leukocytes has proven to be highly efficacious in non-Hodgkin lymphoma and CLL, especially in patients with relapsed/refractory disease.9
In spite of the remarkable success in lymphoid malignancies, development of resistance has been observed in patients treated with idelalisib,3,10 and the underlying resistance mechanisms are unresolved. Characterizing the molecular pathways leading to resistance is pivotal for identification of alternative treatment options for patients with resistant tumors.
The clinical mode of action of drugs targeting BTK and PI3K also involves relocalization of tumor cells from the secondary lymphoid organs, and the concomitant deprivation of survival signals is an important step in the elimination of these tumors. Therefore, in the present study, we modeled resistance to PI3K-δ inhibitors in vivo using a murine serial-adoptive transfer and treatment model with GS-649443, a tool compound of idelalisib with favorable pharmacokinetic properties in mice. The Eµ-TCL1 tumor-derived cell line TCL1-192 has previously been demonstrated to be a suitable biological model for studying the efficacy of ibrutinib treatment11,12 and was used to uncover the mechanism mediating resistance to PI3K-δ inhibitors.
Materials and methods
Adoptive transfer model
Prior to the start of the experiment, TCL1-192 cells were transferred 5 times into 8-week-old female CB17 SCID mice.11 For the serial transfer and treatment scheme, 5 million splenic tumor cells were transplanted into recipient mice by IV injection, followed by treatment with GS-649443 or vehicle using oral gavage. Treatments were started on day 5 after tumor transfer, when CLL cells were detectable in peripheral blood. The single–time point experiments consisted of 6 mice per treatment group, and the mice were euthanized after 5 days of treatment. In experiments to analyze the impact of drug treatment on survival, animals were euthanized if they appeared “critically sick,” a surrogate end point defined based on scoring for disease severity, including white blood cell (WBC) count, changes in mobility, and signs of suffering, as approved by the Ulm University animal experimental ethics committee. For syngeneic transfers, 12-week-old female C57BL/6 wild-type mice (Charles River) were injected IV with 20 million syngeneic splenocytes derived from leukemic Eµ-TCL1 donor mice. Tumor cells were purified with Ficoll, and only tumors with ≥95% CD5+CD19+ cells were used. Animals were randomized to treatment with GS-649443 or vehicle on day 14 when they reached 20% CD5+CD19+ cells in blood.
Next-generation sequencing
Highly pure DNA was isolated, according to the manufacturer’s protocol (QIAGEN), from tumors from the third and fourth transfers that were treated with vehicle or GS-649443. Library preparation was performed using SureSelect XT Mouse All Exon kit (Agilent Technologies). Sample preparation, hybridization, indexing and sequencing were performed according to the manufacturer’s instructions. The exomes were sequenced using HiSeq 2000 (Illumina).
RNA sequencing
RNA sequencing (RNA-Seq) was conducted by Expression Analysis (Durham, NC). Total RNA was converted into complementary DNA (cDNA) libraries using a TruSeq Stranded mRNA Sample Prep Kit (Illumina). Paired-end sequencing was conducted using an Illumina HiSeq system with a read length of 50 nt. RNA-Seq reads were aligned to reference genome by STAR,13 and RNA abundance was quantified using RSEM.14 The Bioconductor package edgeR15 was used to normalize sequence count, and limma16 was used for differential gene-expression analysis. Differentially expressed genes (drug treated vs vehicle) were identified as having a fold change > 2 and a false discovery rate < 0.05.
Additional materials and methods are included in supplemental Materials and methods (available on the Blood Web site).
Results
PI3K-δ inhibitor GS-649443 is therapeutically efficacious in murine CLL transfer models
GS-649443 is a potent and highly specific PI3K-δ inhibitor (iPI3K-δ) with a 50% inhibitory concentration (IC50) of 0.3 nM and 87/1496/4142-fold selectivity over PI3K isoforms γ/β/α, respectively.17 Two murine adoptive transfer models were used for assessing the efficacy of GS-649443: 1 with intact tumor microenvironment (syngeneic) and 1 without (NOD SCID) (Figure 1A). In the first model, Eµ-TCL1 tumors were transplanted IV into syngeneic mice, followed by treatment from day 14 with the inhibitor or vehicle. In comparison with vehicle treatment, GS-649443 treatment for 10 days controlled disease development, as shown by lower spleen weight (P = .0033; Figure 1B-C), liver weight (P = .0031; Figure 1D), and WBC count (P = .0047; Figure 1E). Moreover, tumor cells isolated from the spleen of iPI3K-δ treated mice showed a significant decrease in cell proliferation, as analyzed using 5-bromo-2′-deoxyuridine (BrdU) staining (P = .0054; Figure 1F).
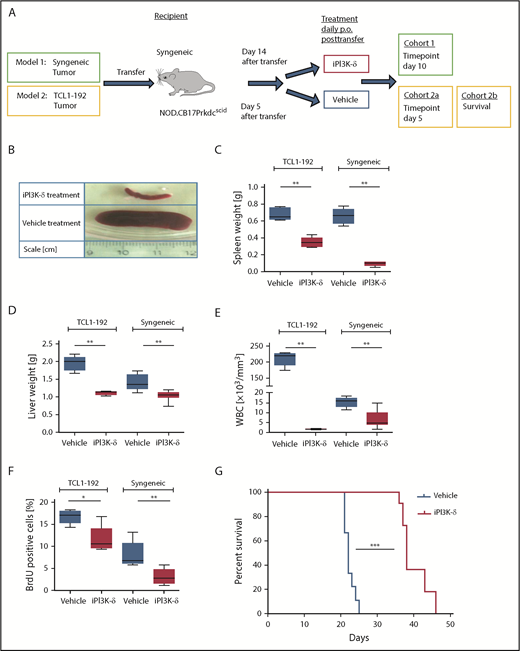
PI3K-δ inhibitor GS-649443 is effective in mice transplanted with TCL1-192 cell line or primary TCL1 tumors. (A) Scheme for the 2 adoptive transfer models for studying the efficacy of GS-649443. Model 1 (green box) involves transfer of tumor from Eµ-TCL1 mice into syngeneic recipients, followed by 10 days of treatment with the inhibitor or vehicle. Model 2 (yellow box) involves transfer of TCL1-192 cells into 2 cohorts of immunodeficient recipients, with a cutoff after 5 days of treatment with vehicle or GS-649443 (cohort 2a) or survival as end point of the study (cohort 2b). (B) Representative photographs of spleens in the Eµ-TCL1 syngeneic tumor-transfer model after 10 days of treatment with GS-649443 or vehicle. Spleen weights (TCL1-192, P = .0053; syngeneic, P = .0033) (C), liver weights (TCL1-192, P = .0079; syngeneic, P = .0031) (D), and WBC counts (TCL1-192, P = .0078; syngeneic, P = .0047) (E) of recipient mice in the TCL1-192–transfer model (n = 6 mice per group), as well as in the syngeneic transfer model (n = 7 mice per group). Measurements were taken at the time of euthanization after 10 days (syngeneic) or 5 days (TCL1-192) of treatment. All P values were calculated using the Mann-Whitney U test. (F) Cell proliferation analyzed by BrdU injection 24 hours prior to euthanizing the mice (n = 6). The BrdU+ fraction of splenic lymphocytes in the immunosuppressed (TCL1-192, P = .0173) and immunocompetent (syngeneic, P = .0054) models is depicted. The P values were calculated using the Mann-Whitney U test. (G) Survival curves of NOD.SCID-Prkdcscid recipient mice transferred with TCL1-192 tumor cells and treated with GS-649443 or vehicle (n = 6 mice per group). ***P ≤ .0001, log rank (Mantel-Cox) test. *P ≤ .05; **P ≤ .01; ***P ≤ .001; ns, P > .05.
PI3K-δ inhibitor GS-649443 is effective in mice transplanted with TCL1-192 cell line or primary TCL1 tumors. (A) Scheme for the 2 adoptive transfer models for studying the efficacy of GS-649443. Model 1 (green box) involves transfer of tumor from Eµ-TCL1 mice into syngeneic recipients, followed by 10 days of treatment with the inhibitor or vehicle. Model 2 (yellow box) involves transfer of TCL1-192 cells into 2 cohorts of immunodeficient recipients, with a cutoff after 5 days of treatment with vehicle or GS-649443 (cohort 2a) or survival as end point of the study (cohort 2b). (B) Representative photographs of spleens in the Eµ-TCL1 syngeneic tumor-transfer model after 10 days of treatment with GS-649443 or vehicle. Spleen weights (TCL1-192, P = .0053; syngeneic, P = .0033) (C), liver weights (TCL1-192, P = .0079; syngeneic, P = .0031) (D), and WBC counts (TCL1-192, P = .0078; syngeneic, P = .0047) (E) of recipient mice in the TCL1-192–transfer model (n = 6 mice per group), as well as in the syngeneic transfer model (n = 7 mice per group). Measurements were taken at the time of euthanization after 10 days (syngeneic) or 5 days (TCL1-192) of treatment. All P values were calculated using the Mann-Whitney U test. (F) Cell proliferation analyzed by BrdU injection 24 hours prior to euthanizing the mice (n = 6). The BrdU+ fraction of splenic lymphocytes in the immunosuppressed (TCL1-192, P = .0173) and immunocompetent (syngeneic, P = .0054) models is depicted. The P values were calculated using the Mann-Whitney U test. (G) Survival curves of NOD.SCID-Prkdcscid recipient mice transferred with TCL1-192 tumor cells and treated with GS-649443 or vehicle (n = 6 mice per group). ***P ≤ .0001, log rank (Mantel-Cox) test. *P ≤ .05; **P ≤ .01; ***P ≤ .001; ns, P > .05.
The second model involved the transfer of murine autoantigen-driven cell line TCL1-192 (second model; Figure 1A), which gives rise to a CLL-like disease in NOD.CB17-Prkdcscid recipient mice, followed by death in ∼3 to 5 weeks.11 TCL1-192–transplanted mice treated with GS-649443, and euthanized at the same point in time at which the vehicle-treated mice became critically sick (as defined in “Materials and methods”; cohort 2a; Figure 1A), showed a significant reduction in spleen weight (P = .005; Figure 1C), liver weight (P = .0079; Figure 1D), WBC count (P = .0078; Figure 1E), and cell proliferation, as analyzed using BrdU staining (P = .0173; Figure 1F). A cohort of TCL1-192–transplanted mice was also analyzed for the impact on survival (cohort 2b; Figure 1A); GS-649443 treatment led to a significant increase in survival (P < .0001; Figure 1G) compared with vehicle treatment. Despite prolongation of survival upon PI3K-δ inhibition, all of the inhibitor-treated mice still died of tumor, indicating that resistance may develop in this model. Hence, we hypothesized that keeping the cells under continued treatment would allow selection and expansion of clones resistant to GS-649443.
Continuous treatment with the PI3K-δ inhibitor results in development of resistance in mice
To generate resistance to GS-649443 in vivo, a serial transfer and treatment scheme was used (Figure 2A). TCL1-192 cells were transplanted into NOD.CB17-Prkdcscid recipient mice, and treatment with inhibitor (n = 6) or vehicle (n = 3) was started on day 5 after transfer and continued until the mice became critically sick (P = .0047, Figure 2B). Mononuclear cells from spleen were transplanted into recipient mice for a second round of treatment with the inhibitor (n = 6) or vehicle (n = 6). The transfer and treatment cycles were repeated for a total of 4 rounds. Mice treated with vehicle had the shortest survivals across the 4 rounds of transfer, irrespective of their treatment in the preceding round (vehicle pretreatment: blue; GS-649443 pretreatment: purple). On the contrary, mice that experienced drug for the first time always responded to treatment, as observed by prolonged survival (green). Strikingly, mice that were continuously treated with the inhibitor across the different transfers (red) finally failed to respond to the drug in the third (P = .0001) and fourth (P = .0004) transfer compared with mice experiencing drug for the first time in their respective rounds (green). Of note, despite having shorter survival, mice transplanted with the resistant tumors showed no difference in tumor burden when euthanized compared with vehicle treatment (supplemental Figure 1A).
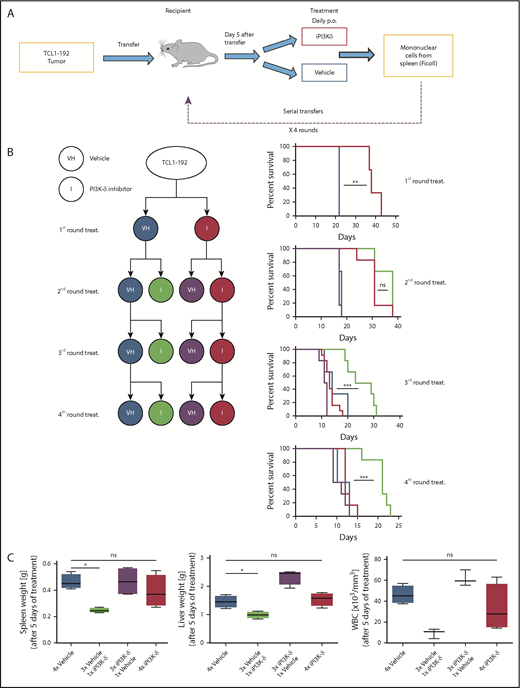
In vivo generation of resistance to PI3K-δ inhibitor GS-649443. (A) Scheme for generation of resistance to PI3K-δ inhibitor in vivo. TCL1-192 cells were transferred into immunodeficient recipients, and starting from day 5 after transfer, the mice were treated with vehicle or GS-649443. Tumors from critically sick mice treated continuously with PI3K-δ inhibitor or vehicle were retransferred into recipient mice, and the treatments were repeated. A total of 4 transfer and treatment rounds was performed. (B) Simplified treatment cohort scheme with the 4 rounds of transfer and treatment to generate resistance and their corresponding survival curves. Red: GS-649443–treated recipient mice that were transferred with cells treated continuously with PI3K-δ inhibitor in all previous transfers. Green: GS-649443–treated recipient mice transferred with cells treated with vehicle in all previous transfers. Blue: vehicle-treated recipient mice transferred with cells that were treated continuously with vehicle in all previous transfers. Purple: vehicle-treated recipient mice transferred with cells treated with GS-649443 in all previous transfers. Red vs blue first round: P = .0047; red vs green third round: P = .0001; red vs green fourth round: P = .0004. All P values were calculated using the Mantel Cox log-rank test. (C) Spleen and liver weights and WBC counts as a representation of the tumor burden in mice from the fourth round of transfer and treatment. Data were collected following 5 days of treatment. Spleen, P = .0286; liver, P = .0294; WBC, P = .0571, Mann-Whitney U test (n = 6). ns, not statistically significant; p.o., by oral gavage *P ≤ .05; **P ≤ .01; ***P ≤ .001; ns, P > .05.
In vivo generation of resistance to PI3K-δ inhibitor GS-649443. (A) Scheme for generation of resistance to PI3K-δ inhibitor in vivo. TCL1-192 cells were transferred into immunodeficient recipients, and starting from day 5 after transfer, the mice were treated with vehicle or GS-649443. Tumors from critically sick mice treated continuously with PI3K-δ inhibitor or vehicle were retransferred into recipient mice, and the treatments were repeated. A total of 4 transfer and treatment rounds was performed. (B) Simplified treatment cohort scheme with the 4 rounds of transfer and treatment to generate resistance and their corresponding survival curves. Red: GS-649443–treated recipient mice that were transferred with cells treated continuously with PI3K-δ inhibitor in all previous transfers. Green: GS-649443–treated recipient mice transferred with cells treated with vehicle in all previous transfers. Blue: vehicle-treated recipient mice transferred with cells that were treated continuously with vehicle in all previous transfers. Purple: vehicle-treated recipient mice transferred with cells treated with GS-649443 in all previous transfers. Red vs blue first round: P = .0047; red vs green third round: P = .0001; red vs green fourth round: P = .0004. All P values were calculated using the Mantel Cox log-rank test. (C) Spleen and liver weights and WBC counts as a representation of the tumor burden in mice from the fourth round of transfer and treatment. Data were collected following 5 days of treatment. Spleen, P = .0286; liver, P = .0294; WBC, P = .0571, Mann-Whitney U test (n = 6). ns, not statistically significant; p.o., by oral gavage *P ≤ .05; **P ≤ .01; ***P ≤ .001; ns, P > .05.
To further verify the generation of resistance, tumors from the third round of GS-649443 (red; resistant) and vehicle (blue; sensitive) treatment were transplanted into recipient mice, followed by treatment with vehicle or GS-649443. Mice euthanized after 5 days of treatment showed decreased disease burden in the sensitive groups upon treatment with iPI3K-δ (Figure 2C; green), whereas the resistant groups showed no difference between the inhibitor and vehicle treatments. Also, it was confirmed that resistance did not develop as a result of transformation into a more aggressive disease (ie, Richter’s transformation) based on cell morphology (supplemental Figure 1B) and cell surface marker expression (supplemental Figure 1C). The persistent response of control tumors (Figure 2B; green) to iPI3K-δ, irrespective of the transfer round, indicated that the generated resistance was not mediated by increasing serial transfers but by clonal selection due to serial treatment with the compound.
Whole-exome sequencing for identifying gene mutations in iPI3K-δ–resistant tumors
In an attempt to elucidate the mechanisms leading to iPI3K-δ resistance, tumors from the third and fourth rounds that were continuously treated with vehicle (blue) or with GS-649443 (red) were analyzed along with the parental TCL1-192 clone using whole-exome sequencing (WES). Genetic variants acquired during serial transfers and treatments were identified by comparing each transplanted tumor with the original TCL1-192 tumor. A total of 99 nonsynonymous somatic variants affecting exons or splice sites with tumor variant allele frequency ≥ 10% was identified in the sensitive and resistant tumors (supplemental Tables 1.1 and 1.2). Of these, 35 mutations were identified in the vehicle-treated tumors (supplemental Table 1.1), whereas 64 mutations were solely found in the GS-649443–resistant tumors (Table 1; supplemental Table 1.2). Intriguingly, no single unifying recurrent mutation or mutations in PI3K isoform genes were identified.
List of treatment-related mutations acquired in each of the iPI3K-δ resistant tumors sequenced by WES
| Mutations in iPI3K-δ–resistant tumors | |||||
|---|---|---|---|---|---|
| Fourth round I-1 | Fourth round I-2 | Fourth round I-3 | Fourth round I-4 | Third round I-5 | Third round I-6 |
| Lypd8 | Pramel1 | Sned1 | Klhl9 | Grb2 | Cd44 |
| Hrh1 | B230219D22Rik | Ddhd1 | Chpt1 | Baz2b | Slc39a12 |
| Mylk | Gpc5 | Pcdh18 | Dnah10 | Irak1bp1 | Fat1 |
| Ddhd1 | Srfbp1 | Fat3 | Enc1 | Usp17lb | Morc2b |
| Elp3 | Clpx | Gdf10 | Il2 | Mpdz | Myct1 |
| Rps12 | Rps12 | Grb2 | Chrna7 | Prkd1 | |
| Gabra4 | Clca4b | Arhgef10l | Xirp2 | Ccp110 | |
| Gc | Mboat1 | Kdm6a | Klhl29 | ||
| Cyp19a1 | Elp3 | Xirp2 | Osbpl1a | ||
| Epb4.1l3 | Siglec1 | Dock5 | Ptk2 | ||
| Plce1 | Eml5 | Ednra | Amy2b | ||
| Klhl29 | Anks4b | Adcy9 | Clpx | ||
| Fat3 | B4galnt3 | ||||
| Mboat1 | Ccdc106 | ||||
| Crim1 | Itga1 | ||||
| Tubal3 | Tmem132e | ||||
| Anks4b | Tubal3 | ||||
| B4galnt3 | Gc | ||||
| Siglec1 | Hrh1 | ||||
| Itga1 | Plce1 | ||||
| Pcdh18 | Mylk | ||||
| Tshb | Lypd8 | ||||
| Clca4b | Calcoco2 | ||||
| Foxp2 | 4930407I10Rik | ||||
Mutations overlapping between the iPI3K-δ–resistant and -sensitive tumors are not included.
To evaluate whether mutations in the different tumors resistant to PI3K-δ inhibition affected specific biological pathways, genes affected by mutations were studied for their potential functional relevance using Ingenuity Pathway Analysis, STITCH, and DAVID. Signaling networks involving immune cell trafficking and inflammatory response, ERBB, and focal adhesion were among the primary pathways significantly enriched for resistance-associated gene mutations (supplemental Tables 2.1-2.3; supplemental Figure 2).Thus the acquired mutations identified in iPI3K-δ–resistant tumors, although not highly recurrent, may impact these functional pathways.
RNA-Seq analysis identifies IGF1R to be consistently upregulated in iPI3K-δ–resistant tumors
Because no recurrent mutation was identified that could be directly implicated in iPI3K-δ resistance, transcriptional alterations associated with iPI3K-δ resistance were analyzed using RNA-Seq. We compared tumors from mice that were continuously treated with iPI3K-δ (“resistant”) with tumors continuously treated with vehicle (“sensitive”). In comparison with the iPI3K-δ–sensitive tumors, Erbb2ip, Ube2e2, Tec, Tgfbr1, Rasgrp3, Rabl5, Igf1r, Tnfaip8l1, Cdkn4, and Ak4 were among the significantly deregulated genes in the iPI3K-δ–resistant tumors (Figure 3A). Among the genes validated using quantitative reverse-transcription PCR (RT-qPCR), Igf1r showed the strongest association with resistance (supplemental Figure 3A-B). The upregulation of Igf1r could also be validated at the protein level, along with an increase in phosphorylated (p)AKT and p-ERK in the iPI3K-δ–resistant tumors (Figure 3B; supplemental Figure 3C-E). Analysis of Igf1r messenger RNA (mRNA) expression in primary tumors from the different transfer rounds and treatment groups showed a robust increase in cells continuously treated with GS-649443 (red) compared with other subgroups (Figure 3C), indicating selection and expansion of clones with Igf1r upregulation under drug treatment pressure. Because receptor tyrosine kinases (RTKs), such as IGF1R, are known to signal through the α, β, or δ PI3K isoform,18 we investigated whether Igf1r mediates iPI3K-δ resistance by activation of alternative PI3K isoforms. However, no specific increase in the protein expression of the PI3K-α or PI3K-β isoform was observed in the resistant tumors (Figure 3D). The results indicate the involvement of alternative cell survival signaling downstream of IGF1R in mediating iPI3K-δ resistance.
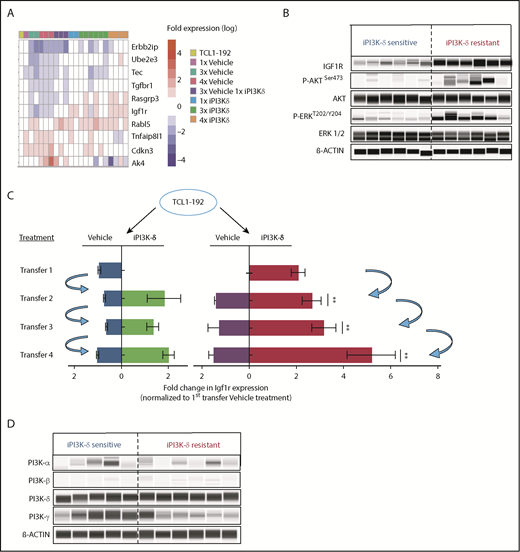
RNA-Seq analysis to identify gene-expression changes in iPI3K-δ–resistant tumor cells. (A) RNA-Seq analysis of tumors from baseline and first, third, and fourth transfers treated with vehicle or GS-649443. The figure shows selected differentially expressed genes with significant differences in expression levels (fold change > 2 and false discovery rate < 0.05). (B) Protein expression analysis using Simple Western to compare levels of IGF1R, p-AKT, and p-ERK in murine primary tumors from the fourth transfer, always treated with vehicle (iPI3K-δ sensitive) or GS-649443 (iPI3K-δ resistant). (C) Fold change in Igf1r expression measured ex vivo by RT-qPCR in tumors from the first to fourth transfers. The blue arrows represent the tumors that were transferred to the subsequent rounds. Mann-Whitney U tests were performed to analyze differences in Igf1r expression between the GS-649443 treatments (green vs red, second transfer, P = .0095; third transfer, P = .0061; fourth transfer, P = .007. (D) Protein expression of PI3K isoforms analyzed using Simple Western in iPI3K-δ–sensitive (fourth-transfer tumors treated with vehicle in all rounds) and iPI3K-δ–resistant (fourth-transfer tumors treated with GS-649443 in all rounds) tumor cells. **P ≤ .01.
RNA-Seq analysis to identify gene-expression changes in iPI3K-δ–resistant tumor cells. (A) RNA-Seq analysis of tumors from baseline and first, third, and fourth transfers treated with vehicle or GS-649443. The figure shows selected differentially expressed genes with significant differences in expression levels (fold change > 2 and false discovery rate < 0.05). (B) Protein expression analysis using Simple Western to compare levels of IGF1R, p-AKT, and p-ERK in murine primary tumors from the fourth transfer, always treated with vehicle (iPI3K-δ sensitive) or GS-649443 (iPI3K-δ resistant). (C) Fold change in Igf1r expression measured ex vivo by RT-qPCR in tumors from the first to fourth transfers. The blue arrows represent the tumors that were transferred to the subsequent rounds. Mann-Whitney U tests were performed to analyze differences in Igf1r expression between the GS-649443 treatments (green vs red, second transfer, P = .0095; third transfer, P = .0061; fourth transfer, P = .007. (D) Protein expression of PI3K isoforms analyzed using Simple Western in iPI3K-δ–sensitive (fourth-transfer tumors treated with vehicle in all rounds) and iPI3K-δ–resistant (fourth-transfer tumors treated with GS-649443 in all rounds) tumor cells. **P ≤ .01.
To verify whether Igf1r upregulation would functionally contribute to iPI3K-δ resistance, Igf1r was overexpressed in murine A20 cells using lentiviral transduction. A20 cells were selected because they do not express endogenous IGF1R and showed high sensitivity to GS-649443 in vitro compared with Ba/F3 and 300-19 murine cell lines (supplemental Figure 3F). Igf1r overexpression in A20 cells led to a strong increase in p-ERK levels (Figure 4A) and a drastically reduced response to GS-649443 treatment (IC50 > 20 µM; P < .0001) compared with empty vector–transduced A20 cells (IC50 = 126 nM; Figure 4B). Because Igf1r upregulation was identified to contribute to iPI3K-δ resistance in murine tumors, the relevance of IGF1R and other RTKs in human CLL was evaluated. The expression levels of key RTKs, such as IGF1R, IGF2R, INSR, FGFR1, FGFR2, FGFR3, FGFR4, ROR1, ROR2, DDR1, DDR2, LTK, AXL, PDGFRA, PDGFRB, ERBB2, ERBB3, ALK, TIE1, and RET, which are known to be expressed in hematopoietic cells, were studied in 337 previously untreated patient samples. Unsupervised clustering identified 2 major clusters that differed primarily with respect to IGF1R expression (Figure 4C). Although the expression levels of other RTKs were rather low, a subset of cases with lower IGF1R expression showed elevated expression of FGFR1 (Figure 4C).
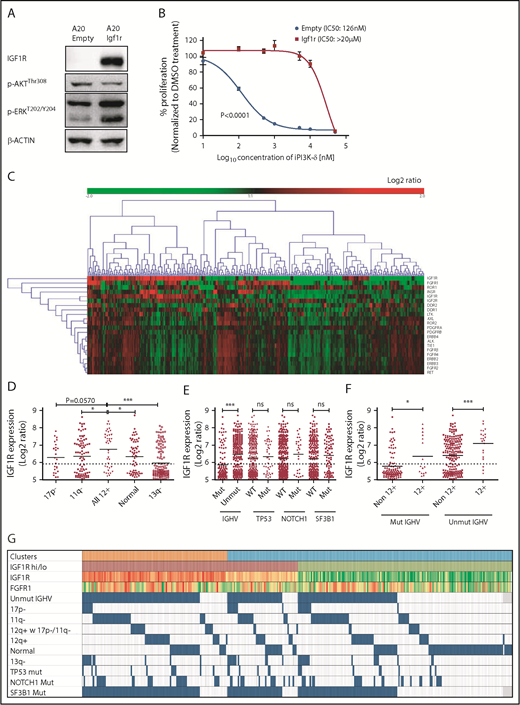
IGF1R expression is associated with unmutated IGHV status and trisomy 12 in human CLL. (A) Western blot analysis for IGF1R, p-AKT, and p-ERK levels in A20 cells overexpressing Igf1r compared with empty vector–transduced cells. (B) Dose-response curve for analyzing sensitivity of Igf1r-overexpressing or empty vector–transduced A20 cells to GS-649443 in vitro using an MTS assay. The P value was calculated using the extra-sum-of-squares F test comparing the best-fit values between the 2 curves. (C) Gene-expression profiling and unsupervised clustering of RTKs in a cohort of 337 previously untreated CLL patient samples identified 2 major clusters distinguished based on high and low levels of IGF1R. A subcluster with lower IGF1R and higher FGFR1 was also observed. (D) Association of IGF1R expression with hierarchical genomic aberration subgroups (with the exception of trisomy 12). (E) Correlation of IGF1R expression with gene mutations. (F) IGF1R expression in cases with and without trisomy 12 within the IGHV subgroups. P values in (D-F) were calculated using the Mann-Whitney U test. (G) Overview of IGF1R and FGFR1 expression with various genetic subgroups in CLL. Among the clusters, orange refers to cluster 1 and blue refers to cluster 2 in Figure 4C. High IGF1R (>median) is shown in red, and low IGF1R (≤median) is shown in green. Heat map with log2 ratios of IGF1R expression shown with a color scale of red (high expression) to green (low expression). Incidence of 17p deletion (17p-), 11q deletion (11q-), normal karyotype, and 13q deletion (13q-) represent the hierarchical model. ns, not statistically significant. *P ≤ .05; ***P ≤ .001; ns, P > .05.
IGF1R expression is associated with unmutated IGHV status and trisomy 12 in human CLL. (A) Western blot analysis for IGF1R, p-AKT, and p-ERK levels in A20 cells overexpressing Igf1r compared with empty vector–transduced cells. (B) Dose-response curve for analyzing sensitivity of Igf1r-overexpressing or empty vector–transduced A20 cells to GS-649443 in vitro using an MTS assay. The P value was calculated using the extra-sum-of-squares F test comparing the best-fit values between the 2 curves. (C) Gene-expression profiling and unsupervised clustering of RTKs in a cohort of 337 previously untreated CLL patient samples identified 2 major clusters distinguished based on high and low levels of IGF1R. A subcluster with lower IGF1R and higher FGFR1 was also observed. (D) Association of IGF1R expression with hierarchical genomic aberration subgroups (with the exception of trisomy 12). (E) Correlation of IGF1R expression with gene mutations. (F) IGF1R expression in cases with and without trisomy 12 within the IGHV subgroups. P values in (D-F) were calculated using the Mann-Whitney U test. (G) Overview of IGF1R and FGFR1 expression with various genetic subgroups in CLL. Among the clusters, orange refers to cluster 1 and blue refers to cluster 2 in Figure 4C. High IGF1R (>median) is shown in red, and low IGF1R (≤median) is shown in green. Heat map with log2 ratios of IGF1R expression shown with a color scale of red (high expression) to green (low expression). Incidence of 17p deletion (17p-), 11q deletion (11q-), normal karyotype, and 13q deletion (13q-) represent the hierarchical model. ns, not statistically significant. *P ≤ .05; ***P ≤ .001; ns, P > .05.
Further, correlating IGF1R expression levels with genomic aberrations identified cases with trisomy 12 to be significantly associated with higher IGF1R expression compared with other subgroups (Figure 4D). Among the gene mutations, unmutated IGHV was significantly associated with higher IGF1R expression (P < .0001; Figure 4E). Of note, within mutated (P = .0235) and unmutated (P = .0008) IGHV subgroups, cases with trisomy 12 had significantly higher IGF1R expression (Figure 4F-G), underlining a functional role for IGF1R signaling in this subset of CLL patients.
Igf1r upregulation in PI3K-δ–resistant tumors is mediated in part by feedback activation through the GSK3-FOXO axis
Because the transcript levels of Igf1r were found to be increased in tumors resistant to iPI3K-δ, we investigated possible mechanisms leading to Igf1r transcriptional upregulation. Accordingly, the expression of known transcriptional activators of Igf1r, such as AngII, b-Fgf, and Pdgf, as well as transcriptional repressors, such as Wt1 and Brca1, were quantified using RT-qPCR (supplemental Figure 4A). Among the genes analyzed, expression of Wt1 was found to be significantly lower in the resistant samples upon treatment with GS-649443, indicating that loss of repression by WT1 may induce Igf1r in these cells (supplemental Figure 4B). Because Igf1r is also known to be transcriptionally activated by FOXO transcription factors, and GSK3 could positively regulate FOXO function,19 the role of FOXO1 and GSK3 in the resistant tumors was analyzed. The resistant and sensitive tumors were treated with the FOXO1 inhibitor AS1842856 or the GSK3 inhibitor CHIR99021 and then sequentially treated with GS-649443. RT-qPCR analysis showed that the robust upregulation of Igf1r expression in the resistant tumors upon GS-649443 treatment (P = .016) could be partially attenuated by inhibition of GSK3 (P = .025) and FOXO1, suggesting that induction of IGF1R upon resistance occurs via GSK3 and FOXO1 (Figure 5A).
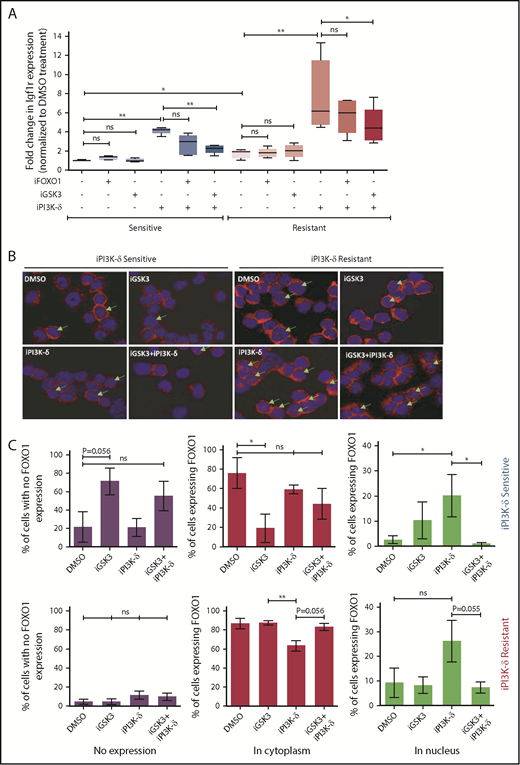
Transcriptional regulators of Igf1r in iPI3K-δ–resistant tumors. (A) Resistant and sensitive tumors were treated with dimethyl sulfoxide (DMSO), GSK3 inhibitor (CHIR99021; iGSK3), or FOXO1 inhibitor (AS1842856; iFOXO1) for 3 hours, followed by treatment with DMSO or GS-649443 for 12 hours; Igf1r expression was analyzed using RT-qPCR. All P values were calculated using a 2-tailed paired Student t test. (B) Representative images from immunohistochemistry analysis showing FOXO1 localization after treatment of iPI3K-δ–resistant and -sensitive tumors with DMSO, GSK3 inhibitor (CHIR99021), GS-649443, or the combination of GS-649443 and CHIR99021. For every slide, 10 fields were analyzed with ×600 magnification and the localization of FOXO1 in all cells in every field was scored. Green arrows indicate FOXO1 localization in the nucleus (transcriptionally active FOXO1). Red: FOXO1 (Cy3), blue: DAPI. (C) Incidence of FOXO1 in the different compartments (only cytoplasm, nucleus, and no expression) was quantified using the mean from the 10 fields of view and normalized to the total number of cells per field. The P values were calculated using the Mann-Whitney U test. (D) Western blot analysis for expression levels of p-IGF1R, IGF1R, p-FOXO1, FOXO1, p-AKT, AKT, p-ERK, and ERK in cells from the fourth transfer and treatment round. Analysis of LAMIN B was included as a loading control. (E) Quantification of FOXO1, p-FOXO1, and p-ERK1/2 protein levels from the western blot analysis using ImageJ densitometry analysis software. All protein expression data were normalized to that of LAMIN B. p-ERK and p-FOXO1 were further normalized to their respective total protein expression levels. All P values were calculated using the Mann-Whitney U test. ns, not statistically significant. *P ≤ .05; **P ≤ .01; ns, P > .05.
Transcriptional regulators of Igf1r in iPI3K-δ–resistant tumors. (A) Resistant and sensitive tumors were treated with dimethyl sulfoxide (DMSO), GSK3 inhibitor (CHIR99021; iGSK3), or FOXO1 inhibitor (AS1842856; iFOXO1) for 3 hours, followed by treatment with DMSO or GS-649443 for 12 hours; Igf1r expression was analyzed using RT-qPCR. All P values were calculated using a 2-tailed paired Student t test. (B) Representative images from immunohistochemistry analysis showing FOXO1 localization after treatment of iPI3K-δ–resistant and -sensitive tumors with DMSO, GSK3 inhibitor (CHIR99021), GS-649443, or the combination of GS-649443 and CHIR99021. For every slide, 10 fields were analyzed with ×600 magnification and the localization of FOXO1 in all cells in every field was scored. Green arrows indicate FOXO1 localization in the nucleus (transcriptionally active FOXO1). Red: FOXO1 (Cy3), blue: DAPI. (C) Incidence of FOXO1 in the different compartments (only cytoplasm, nucleus, and no expression) was quantified using the mean from the 10 fields of view and normalized to the total number of cells per field. The P values were calculated using the Mann-Whitney U test. (D) Western blot analysis for expression levels of p-IGF1R, IGF1R, p-FOXO1, FOXO1, p-AKT, AKT, p-ERK, and ERK in cells from the fourth transfer and treatment round. Analysis of LAMIN B was included as a loading control. (E) Quantification of FOXO1, p-FOXO1, and p-ERK1/2 protein levels from the western blot analysis using ImageJ densitometry analysis software. All protein expression data were normalized to that of LAMIN B. p-ERK and p-FOXO1 were further normalized to their respective total protein expression levels. All P values were calculated using the Mann-Whitney U test. ns, not statistically significant. *P ≤ .05; **P ≤ .01; ns, P > .05.
Further, treatment with iPI3K-δ led to an increase in nuclear localization of FOXO1 (Figure 5B). Inhibition of GSK3 using CHIR99021 prior to treatment with GS-649443 reduced nuclear localization of FOXO1 (P = .055; Figure 5B-C), in line with the decrease in Igf1r expression (Figure 5A). The results indicate that Igf1r upregulation occurs, in part, by increased localization of FOXO1 in the nucleus, mediated by GSK3. Additionally, knockdown of GSK3B in the human NHL cell lines JVM2 and MEC1 led to a decrease in mRNA levels of FOXO genes (supplemental Figure 4C-D), indicating that GSK3 may be directly or indirectly important for the transcriptional upregulation of FOXO genes.
Because the GSK3 and FOXO transcription factors are generally activated upon loss of AKT function in cells with active PI3K/AKT signaling,20 irrespective of iPI3K-δ resistance, we further investigated the differences in the resistant cells that mediate enhanced and early activation of Igf1r. First, a higher percentage of cells in the iPI3K-δ–sensitive tumors showed low or no expression of FOXO1 (Figure 5C), whereas heterogeneous, but rather high, FOXO1 expression was observed in iPI3K-δ–resistant tumors, even in the absence of treatment with GS-649443 (Figure 5D-E). Second, the resistant tumors from mice treated with GS-649443 showed very low levels of FOXO1 inhibitory phosphorylation (Figure 5D-E), indicating the presence of transcriptionally active FOXO1, leading to enhanced Igf1r activation.
PI3K-δ inhibitor resistance can be overcome by targeting IGF1R
IGF1R promotes cell growth and survival by activation of downstream effectors, such as PI3K/AKT and MEK/ERK signaling. Consistent with this, western blot analysis of the tumors from the fourth transfer indicated a significant increase in ERK phosphorylation in the resistant tumors treated with GS-649443 (Figure 5D-E). This finding was in line with the observations from IGF1R-overexpressing A20 cells (Figure 4A). As a first step toward understanding the therapeutic efficacy of targeting IGF1R, A20 cells transduced with IGF1R expression vector or empty vector were treated with the IGF1R inhibitor linsitinib, alone or in combination with GS-649443. Linsitinib as a single agent had minimal impact on A20 cells, irrespective of whether they were transduced with the empty vector (IC50 = 16.3 µM; Figure 6A) or with vectors leading to IGF1R overexpression (IC50 > 20 µM; Figure 6B). However, the resistance of IGF1R-overexpressing A20 cells to GS-649443 (IC50 > 20 µM) was overcome upon combination treatment with linsitinib and GS-649443 (IC50 = 42.5 nM). Importantly, linsitinib treatment led to a decrease in p-ERK levels in A20 cells overexpressing IGF1R, indicating the importance of IGF1R-mediated MAPK signaling in iPI3K-δ resistance (Figure 6C; supplemental Figure 5A).
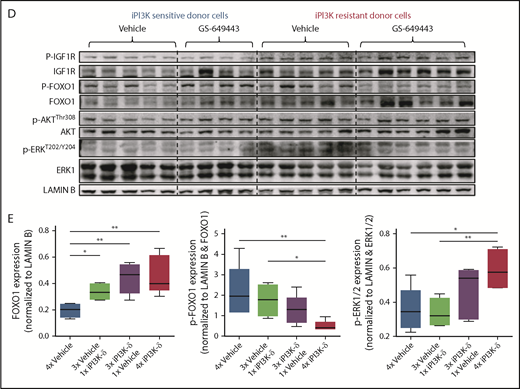
PI3K-δ inhibitor resistance could be overcome by targeting IGF1R. Dose-response curves of IGF1R inhibition in A20 cells transduced with empty vector (A) or Igf1r cDNA (B). The IC50 values of empty vector vs Igf1r cDNA–transduced A20 cells were 100.5 nM vs > 20 µM for iPI3K-δ treatment, 16.3 µM vs >20 µM for linsitinib treatment, and 28.8 nM vs 142.5 nM for combination treatment with linsitinib and iPI3K-δ. (C) Western blot analysis for signaling changes in A20 cells transduced with empty vector or Igf1r cDNA upon treatment with DMSO, GS-649443, or linsitinib in the presence or absence of anti–immunoglobulin G stimulation. (D) RT-qPCR analysis of IGF1R expression after 24 hours of treatment with 1 µM idelalisib in CLL patient samples with high and low IGF1R expression (n = 12). The sample from the single in vivo idelalisib–treated patient is shown in red. The expression levels were normalized to a commonly included representative patient sample with low IGF1R (sample 1). (E) Western blot analysis of IGF1R, p-ERK, and ERK levels in CLL patient samples with low IGF1R (1-6) or high IGF1R (8-10) and 1 sample from an idelalisib-treated patient (11). Sample 7 showed high IGF1R expression for mRNA but not protein. One sample with high IGF1R measured by RT-qPCR was not included in the western blotting because of limitations in sample availability. (F) Dose-response curves from an idelalisib-treated patient sample, treated in vitro with idelalisib, linsitinib, or the combination for 4 days. Viability was assessed using DiOC6/propidium iodide/CD19 staining and fluorescence-activated cell sorting. Kaplan-Meyer survival curves for recipient mice that were transferred with PI3K-δ–sensitive tumor cells (G) or PI3K-δ–resistant cells (H) from the third transfer, followed by treatment with vehicle, linsitinib, GS-649443, or a combination of linsitinib and GS-649443. The P values were calculated using the log-rank (Mantel-Cox) test. **P ≤ .01; ***P ≤ .001.
PI3K-δ inhibitor resistance could be overcome by targeting IGF1R. Dose-response curves of IGF1R inhibition in A20 cells transduced with empty vector (A) or Igf1r cDNA (B). The IC50 values of empty vector vs Igf1r cDNA–transduced A20 cells were 100.5 nM vs > 20 µM for iPI3K-δ treatment, 16.3 µM vs >20 µM for linsitinib treatment, and 28.8 nM vs 142.5 nM for combination treatment with linsitinib and iPI3K-δ. (C) Western blot analysis for signaling changes in A20 cells transduced with empty vector or Igf1r cDNA upon treatment with DMSO, GS-649443, or linsitinib in the presence or absence of anti–immunoglobulin G stimulation. (D) RT-qPCR analysis of IGF1R expression after 24 hours of treatment with 1 µM idelalisib in CLL patient samples with high and low IGF1R expression (n = 12). The sample from the single in vivo idelalisib–treated patient is shown in red. The expression levels were normalized to a commonly included representative patient sample with low IGF1R (sample 1). (E) Western blot analysis of IGF1R, p-ERK, and ERK levels in CLL patient samples with low IGF1R (1-6) or high IGF1R (8-10) and 1 sample from an idelalisib-treated patient (11). Sample 7 showed high IGF1R expression for mRNA but not protein. One sample with high IGF1R measured by RT-qPCR was not included in the western blotting because of limitations in sample availability. (F) Dose-response curves from an idelalisib-treated patient sample, treated in vitro with idelalisib, linsitinib, or the combination for 4 days. Viability was assessed using DiOC6/propidium iodide/CD19 staining and fluorescence-activated cell sorting. Kaplan-Meyer survival curves for recipient mice that were transferred with PI3K-δ–sensitive tumor cells (G) or PI3K-δ–resistant cells (H) from the third transfer, followed by treatment with vehicle, linsitinib, GS-649443, or a combination of linsitinib and GS-649443. The P values were calculated using the log-rank (Mantel-Cox) test. **P ≤ .01; ***P ≤ .001.
To analyze the efficacy of linsitinib in human CLL samples in vitro, a set of samples that displayed high levels of IGF1R (n = 6) or low levels of IGF1R (n = 6) mRNA were included (supplemental Table 3). Among the samples with high IGF1R, 1 sample obtained from a CLL patient after 10 months of treatment with idelalisib showed a strong increase in IGF1R expression following in vitro treatment with 1 µM idelalisib for 24 hours (Figure 6D). Also, a high basal level of p-ERK was observed in the idelalisib-treated patient sample and not in the other samples (sample 11, Figure 6E). Although a full resistance, as seen in IGF1R-overexpressing A20 cell lines (Figure 6A-B) was not detected, the sample from the idelalisib-treated CLL patient showed the lowest response to idelalisib in vitro (IC50 = 3.51 µM; Figure 6F) compared with the other samples (median IC50 = 0.79 µM; range, 0.188-2.55; supplemental Figure 5B), suggesting that the selection of resistant clones coincides with activation of IGF1R and MAPK signaling. Although linsitinib as a single agent had poor efficacy in the idelalisib-pretreated sample (IC50 = 11.76 µM), combination treatment with idelalisib was synergistic (IC50 = 0.39 µM; Figure 6F). The findings show that coinhibition of IGF1R could sensitize CLLs with reduced sensitivity to PI3K-δ inhibitors.
To understand whether IGF1R in the resistant tumors could be targeted in vivo for overcoming iPI3K-δ resistance, GS-649443–resistant and -sensitive TCL1-192–derived tumors from the third treatment round were transplanted into NOD.CB17-Prkdcscid mice. The mice were then treated with vehicle, GS-649443, linsitinib, or the combination of GS-649443 and linsitinib. Mice transplanted with iPI3K-δ–sensitive cells responded to GS-649443 treatment, as indicated by an increase in survival, but they did not respond to treatment with linsitinib as a single agent. Mice transplanted with GS-649443–sensitive tumors failed to benefit from the addition of linsitinib to GS-649443 (Figure 6G). In contrast, the iPI3K-δ–resistant tumors failed to respond to GS-649443, as well as to linsitinib as a single agent (Figure 6H); however, combination treatment of linsitinib and GS-649443 led to a significant increase in survival of mice with iPI3K-δ–resistant tumors compared with treatment with GS-649443 alone (P = .0008; Figure 6H). Additionally, in the same experiment, response of resistant tumors to combination treatment with linsitinib and GS-649443 was evident from the decreased tumor burden in peripheral blood following 5 days of treatment compared with controls treated with vehicle (supplemental Figure 5C). Because IGF1R expression was downregulated in iPI3K-δ–resistant cells in the absence of iPI3K-δ (Figure 5A-D), linsitinib did not show efficacy as a single agent in these cells. Taken together, these data indicate that IGF1R upregulation mediates cell survival signaling through activation of the MAPK pathway in iPI3K-δ–resistant tumors and that IGF1R could be a therapeutic target to overcome iPI3K-δ resistance.
Discussion
Cancer therapy has been revolutionized by specific inhibitors of molecules in key pathways that are critical for cancer cell survival. In CLL, the small molecule inhibitors ibrutinib,1,21,22 idelalisib,3,10 and venetoclax4,6 have proven to be highly efficacious in clinical trials, even in patients with TP53 deletion/mutation and resistance to conventional chemotherapies. However, despite the initial success, resistance develops against these novel agents as tumor clones emerge that do not respond to treatment. Although the molecular basis for ibrutinib resistance has been elucidated,23,24 the mechanisms leading to idelalisib resistance are unknown.
In the present study, cellular resistance toward the PI3K-δ inhibitor GS-649443 was generated in vivo using a murine CLL model.11 We expected to identify unique recurrent gene mutations conferring resistance to PI3K-δ inhibitor, similar to mechanisms identified for ibrutinib; however, the genetic landscape of resistant tumors showed a wide spectrum of acquired mutations, with marginal overlap between different tumors. Similar to our observations reported here, CLL tumors from patients progressing under idelalisib also did not display unifying recurrent mutations that could be implicated in drug resistance.25
Recently, PI3K inhibition was shown to upregulate AID expression, resulting in increased acquisition of translocations and mutations.26 Our data are in line with this notion, because we observed an increase in the number of mutations in cells treated with iPI3K-δ compared with vehicle (mean, 25 vs 14 mutations per clone with tumor variant allele frequency ≥ 10% from fourth transfer tumors; supplemental Tables 1.1 and 1.2). However, our data, together with the human sequencing results, also indicate that PI3K-δ inhibition fails to select for strong driver mutations that could confer resistance, dissimilar to the mechanism of resistance against ibrutinib. Of note, no mutation in PI3K isoform genes that would confer resistance to the inhibitors was found or has been described across the entire spectrum of PI3K inhibitors in leukemia and in solid tumors. Therefore, it could be speculated that mutations resulting in amino acid changes in PI3K that would abrogate drug binding do not sufficiently preserve the physiological protein function and, thus, do not occur in tumors.
However, a subset of these mutations found in idelalisib-resistant cells can be functionally grouped to chemotaxis and focal adhesion pathways. It has been suggested that idelalisib targets integrin-mediated signaling, resulting in relocation of tumor cells from the lymph node to peripheral blood, as a mechanism of action.27 Our WES data are in line with this finding, and it can be speculated that the acquired mutations may alter localization of the tumor clones and contribute to the phenotype of resistant tumors, although they do not universally explain their refractoriness.
Given the absence of unifying recurrent mutations directly implicated in iPI3K-δ resistance, we used RNA-Seq to evaluate overlapping cellular processes underlying resistance. Igf1r, which was upregulated in PI3K-δ inhibitor–resistant tumors, showed an expression pattern reminiscent of clonal selection and expansion with progressive rounds of transfer and drug treatment (Figure 3C). Transcriptional regulation of IGF1R is mediated by growth hormones and transcription factors, among others.19,28-31 Of note, the decrease in IGF1R levels in resistant cells in the absence of PI3K-δ inhibition (Figure 5A,D) implied that genes directly regulated by PI3K/ATK signaling are involved in IGF1R upregulation. WT1, a repressor of IGF1R that is positively regulated by PI3K/AKT signaling,30 was found to be decreased in iPI3K-δ–resistant tumors (supplemental Figure 4B).
In addition, IGF1R upregulation seems to be partially mediated by GSK3/FOXO, which are activated upon PI3K/AKT inhibition (Figure 5A-C). FOXO transcription factors have primarily been associated with tumor suppression, because their activation leads to cell cycle arrest and apoptosis.32 Recently, however, a proproliferative and tumorigenic role has been ascribed to FOXO family members.33-35 In the present study, the cells resistant to iPI3K-δ showed a heterogeneous, but increased, level of total FOXO1 protein. In addition, the inactivating phosphorylation of FOXO1 was highly reduced in the resistant cells treated with GS-649443 (Figure 5D-E), both of which might contribute to a strong upregulation of IGF1R.
Although IGF1R activation per se could lead to iPI3K-δ resistance, RTKs are known to cooperate with integrins for enhanced activation of cell survival pathways.36 Mutations identified in the iPI3K-δ–resistant tumors were found to cluster in focal adhesion pathways, which are primarily mediated by integrins (supplemental Tables 2.1-2.3). Because IGF1R is described to cooperate with integrins αvβ3,37 αvβ5,38 α5β1,39 and α6β4,40 it is possible that IGF1R upregulation functionally cooperates with the gene mutations that we observed in resistant cells to further promote iPI3K-δ resistance and survival. In a hypothesis-driven in vitro study on breast cancer cell lines, FOXO was identified to mediate upregulation of RTKs, such as IGF1R, HER3, and IR, upon inhibition of AKT.41 In the unbiased murine in vivo screen presented here and supported by WES analysis,25 we show that resistance to iPI3K-δ is mediated only in part by gene mutations; rather, feedback activation of IGF1R through FOXO/GSK3 plays a predominant role.
We observed that the IGF1R inhibitor linsitinib, in CLL patient samples in vitro (Figure 6F) and in the murine iPI3K-δ–resistant tumors in vivo (Figure 6G-H), showed efficacy, albeit only in combination with iPI3K-δ. Unlike resistance driven by mutations, when iPI3K-δ–resistant tumors were transplanted into recipient mice, followed by treatment with vehicle, IGF1R levels were again downregulated (Figure 5A,D). IGF1R downregulation in the absence of PI3K inhibitor in resistant tumors is likely due to reactivation of AKT, leading to an increase in FOXO1 phosphorylation (Figure 5D) and exclusion from the nucleus. Thus, with the combination treatment, inhibition of PI3K/AKT activates GSK3 and FOXO1, leading to an increase in IGF1R, which is targeted by linsitinib.
Primary CLL cells chiefly depend on B-cell receptor signaling for their survival, which is shown by multiple lines of experimental evidence and by the exquisite sensitivity to inhibitors targeting BTK or PI3K-δ in the clinical setting. However, additional signaling nodes, such as tumor necrosis factor receptors42-44 or orphan receptors,45 further enhance CLL cell survival and proliferation in mouse models. In the present study, we analyzed expression levels of RTKs in a large patient cohort. Although subsets of cases expressed many RTKs (Figure 4C), IGF1R (as also shown previously46,47 ) and FGFR1 were the key RTKs correlating with poor-risk genetic characteristics. Among the genetic features, IGF1R specifically showed a strong association with trisomy 12 (Figure 4D-G). This finding is of importance, because in a recent report from the phase 3 Duo clinical trial comparing duvelisib monotherapy with ofatumumab in relapsed/refractory CLL, cases with trisomy 12 in the presence or absence of 17p deletion (17p-) or 11q deletion (11q-) were associated with shorter progression-free survival (9.1 months [n = 16] vs 16.5 months [n = 73]).48 These results corroborate our findings on the role of IGF1R in PI3K inhibitor resistance in CLL. Based on the current results, activation of RTKs and alternative cell survival pathways may be explored as biomarkers for guiding treatment with PI3K or other small molecule inhibitors, as well as to derive rational drug treatments or combinations to specifically target these cellular vulnerabilities in patients.
In summary, acquired resistance to PI3K-δ inhibitor treatment in murine in vivo cancer models was not mediated by unifying recurrent mutations, which reproduces observations from patients resistant to idelalisib. However, the mutations functionally clustered in chemotaxis and focal adhesion pathways, together with a consistent feedback activation of cell-survival signaling through upregulation of IGF1R. Exposure of the resistant tumors to PI3K-δ inhibitor led to an increased nuclear localization and activation of FOXO1 mediated by GSK3, resulting in IGF1R upregulation and enhanced MEK/ERK signaling and cell survival. The findings are of potential clinical interest, because IGF1R is a candidate therapeutic target that could be used to resensitize resistant cells to PI3K-δ inhibition. Thus, our findings are an example of how resistance to novel targeted therapies can develop by alterations in signaling pathways and may also lead to novel therapeutic options to treat refractory disease.
The online version of this article contains a data supplement.
The publication costs of this article were defrayed in part by page charge payment. Therefore, and solely to indicate this fact, this article is hereby marked “advertisement” in accordance with 18 USC section 1734.
Acknowledgments
The authors thank Sandra Richter, Melanie Seepe, Vanni Torresi, and Linda Jannetti for excellent technical assistance, Lydia Scarfo for shipping patient samples, and Deyan Yosifov for critical feedback on the manuscript.
This work was supported by research grants from the Else Kröner-Fresenius-Stiftung (2010_Kolleg24, 2012_A146), Bundesministerium für Bildung und Forschung (PRECISE), European Commission/Bundesministerium für Bildung und Forschung (“FIRE CLL,” 01KT160), and Deutsche Forschungsgemeinschaft (SFB 1074 project B1, B2).
Authorship
Contribution: A.S. and B.M.C.J. designed and performed experiments, analyzed and interpreted data, and wrote the manuscript; E.T., J.B., A.Y., and R.P.D. performed experiments, interpreted data, and edited the manuscript; A.D., T.J.B., and L.B. analyzed WES data; S.T. and L.L. provided material and worked on RNA-Seq; P.G., N.C., S.-S.C., and S.D. provided material and reviewed the manuscript; C.S., M.S., H.D., and D.M. interpreted data and edited the manuscript; and S.S. designed the study, interpreted data, and wrote the manuscript.
Conflict-of-interest disclosure: A.Y., L.L., and S.T. are employees of Gilead Sciences, Inc. The remaining authors declare no competing financial interests.
Correspondence: Stephan Stilgenbauer, Department of Internal Medicine III, Ulm University, Albert-Einstein Allee 23, 89081 Ulm, Germany, e-mail: stephan.stilgenbauer@uniklinik-ulm.de.

This feature is available to Subscribers Only
Sign In or Create an Account Close Modal