

Key Points
Upfront bortezomib results in deep and durable hematologic responses in AL amyloidosis.
A stringent dFLC response (<10 mg/L) confers superior outcomes.

Abstract
Bortezomib is a standard therapy in light-chain amyloidosis (AL), but little is known about response duration. A difference in involved amyloidogenic and uninvolved serum-free light chains (dFLC) < 10 mg/L (low dFLC response) predicts survival in AL patients with low presenting dFLC (20-50 mg/L). We report outcomes in the largest AL cohort treated with upfront bortezomib and explore the impact of posttreatment dFLC < 10 mg/L (“stringent dFLC response”). A total of 915 newly diagnosed AL patients treated with bortezomib and assessed at our center were included. Hematologic responses, 6-month dFLC, organ responses, overall survival (OS), and time-to-next-treatment (TNT) (excluded patients who died without starting second-line treatment) were evaluated. Overall response rate (intent-to-treat) was 65%, with 49% complete response (CR)/very good partial response/low dFLC response and with a stringent dFLC response, dFLC 10-40 mg/L, and dFLC > 40 mg/L was 30%, 22%, and 48%, respectively. Median OS was 72 months. A total of 289 patients died without progressing to second-line treatment. Median TNT was not reached, and 55% had not progressed to further treatment at 7 years. Patients with stringent dFLC responses had significantly better OS and TNT than did those with lesser responses. A total of 72% of CR patients did not progress to further treatment at 3 years compared with 84% with stringent dFLC responses. Cardiac responses were better in those with stringent dFLC responses (61%) compared with lesser responses (45%; P = .005). Upfront bortezomib confers durable hematologic responses. A stringent dFLC response predicts prolonged TNT and impressive organ responses.
Introduction
Systemic amyloid light-chain amyloidosis (AL) is characterized by fibrillary deposition of monoclonal immunoglobulin light chains within organs. Cardiac involvement determines outcome. Treatment centers upon rapid reduction of amyloidogenic light chains, and the magnitude of reduction predicts organ response and survival. The main upfront treatment choices are a high-dose melphalan autologous stem cell transplant (ASCT) or combination chemotherapy. Most newly diagnosed AL patients are not eligible for upfront ASCT because of advanced cardiac involvement or poor performance status.
Bortezomib-based regimens have become standard therapy in AL. Early studies (largely in relapsed AL) reported good hematologic responses with bortezomib, with an overall response rate (ORR) of 60% to 94% and a complete hematologic response (CR) rate of 23% to 71%.1-4 Disappointingly, a multicenter retrospective European study concluded that upfront bortezomib-cyclophosphamide-dexamethasone (CyBorD) was unable to overcome poor outcomes in Mayo stage III disease, with median survival of 4.6 months and 17% CR rate.5 Previous studies have not reported in detail about time-to-next treatment (TNT) or long-term organ responses in AL with bortezomib.
Hematologic responses in AL are defined by international amyloidosis consensus criteria (ICC) published in 2012.6 These use the difference in involved amyloidogenic and uninvolved serum-free light chains (dFLC) in response assessment, because this parameter is more predictive of outcomes in AL than the M-protein response.7 The ICC declared that dFLC < 40 mg/L (very good partial response [VGPR]) is the goal of therapy, whereas a >50% reduction in dFLC (partial response [PR]) is inadequate. Presenting dFLC ≥ 50 mg/L is regarded as “measurable” for response assessment, but this excludes 20% of patients from response assessment. Lately, “low dFLC” response criteria have been reported8,9 ; a reduction in dFLC after treatment to <10 mg/L predicted favorable overall survival (OS) and renal survival in patients with presenting dFLC of 20 to 50 mg/L.
Given the data on low dFLC response and the emerging prognostic value of minimal residual disease testing, we posited that a dFLC < 10 mg/L (termed a “stringent dFLC response”) may be important in all AL patients, irrespective of baseline light chain levels. Therefore, we report outcomes in the largest cohort of AL patients treated with upfront bortezomib and explore the impact of dFLC < 10 mg/L on outcomes.
Methods
All patients from a prospective observational study of newly diagnosed AL (ALchemy) treated with upfront bortezomib-based regimens from February of 2010 to August of 2017 were included. Patients were treated at their local centers as per nationally agreed protocols. All were seen at the UK National Amyloidosis Centre at 3 months posttreatment initiation and, approximately, every 6 months for comprehensive assessment. All investigations were done at the UK National Amyloidosis Centre, where data were collected and analyzed. Dose modifications and the number of treatment cycles were at the discretion of the locally treating physician. Patients were treated with IV bortezomib until 2013 and subcutaneous bortezomib thereafter. Steroid doses were at the discretion of the locally treating physician. All decisions for any change in treatment were made by a multidisciplinary team at the UK National Amyloidosis Centre and took into account the patients’ dFLC response (or progression), depth of organ damage, improvement in organ function, and functional status.
Diagnosis of AL was confirmed with biopsy immunohistochemistry and/or proteomics analysis. All patients underwent serial biochemical tests for organ function, serum free light chains, serum and urine protein electrophoresis and immunofixation, cardiac biomarkers, echocardiography, and/or cardiac magnetic resonance imaging (unless contraindicated). Organ involvement and responses were defined by ICC.10,11 Organ responses were assessed at 12 and 24 months from the time of treatment initiation. The European modification of Mayo 2004 staging was used, with stage III stratified into IIIa (N-terminal probrain natriuretic peptide [NT-proBNP] < 8500 ng/L) and IIIb (NT-proBNP ≥ 8500 ng/L).12
Hematologic responses at 6 months were assessed by the ICC in patients with presenting dFLC > 50 mg/L.6 CR was defined as negative serum and urine immunofixation and normal serum-free light chain ratio (0.26-1.65). VGPR was defined as dFLC < 40 mg/L, and PR was defined as >50% dFLC reduction.
Patients with presenting dFLC of 20 to 50 mg/L were regarded as achieving a low dFLC, and patients were regarded as achieving a PR if dFLC < 10 mg/L was reached after treatment. Patients with dFLC < 20 mg/L at presentation were included in survival analysis but excluded from response assessment (20 mg/L is the lowest dFLC analyzed in recent low dFLC studies8,9 ). Absolute dFLC at 6 months was assessed in all patients. Given recent reports of low dFLC response,8,9 we assessed absolute dFLC at 6 months in all patients and termed 6-month dFLC < 10 mg/L as a “stringent dFLC response.” Outcomes were assessed in those with and without stringent dFLC responses. Outcomes were also assessed in patients who achieved dFLC > 10 mg/L but <40 mg/L (ie, VGPR patients without a stringent dFLC response). Survival outcomes were analyzed using the Kaplan-Meier method with comparisons done using the log-rank test.
TNT was defined as time from first-line therapy to the beginning of second-line therapy. Patients who died without having progressed to second-line treatment were excluded from analysis of TNT. Hematologic progression was an indication for second-line treatment. Although some criteria require a substantial increase in serum-free light chains to define progression, patients cannot wait until this threshold is reached. The novel criteria of high-risk progression defined by the Italian amyloidosis group are critically important13 but not universally adopted; we are incorporating these in our decision-making algorithms, but they were not routinely used for the duration of this study. Conversely, in some patients, second-line treatment was deferred after multidisciplinary discussions taking into account all factors in the patients’ disease status, including organ function, performance status, light chain burden, frailty, and comorbidities. Because chemotherapy does not directly impact end-organ damage or its improvement, it is challenging to capture the true benefit of treatment when a patient dies of amyloid-related organ dysfunction. Hence, we have used TNT in a real-world attempt to capture the true impact of benefit or loss of benefit from front-line treatment. All P values were 2-sided with a significance level <.05; median values were used to dichotomize continuous variables. Factors that were significant on univariate analysis were further assessed in multivariate modeling by Cox regression analysis. Statistical analysis was performed using SPSS version 24. Approval for analysis and publication was obtained from the National Health Service institutional review board; written consent was obtained from all patients in accordance with the Declaration of Helsinki.
Results
Patients
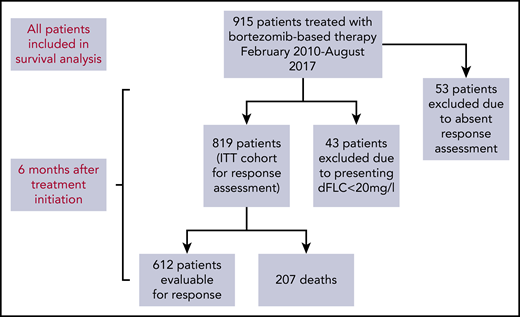
A total of 915 patients underwent bortezomib-based therapy from February of 2010 to August of 2017 (Figure 1). Table 1 shows annual patient recruitment, and baseline characteristics are described in Table 2. The proportions of patients with cardiac, renal, liver, peripheral nerve, autonomic, and gastrointestinal involvement were 71.4%, 68.1%, 13.5%, 6.2%, 5.8%, and 3.0%, respectively. Mayo (2004) stage I, II, and III disease was found in 15.7%, 33%, and 51.3% of patients, respectively. Median NT-proBNP and dFLC were 2228 ng/L (range, 29-93 776) and 180 mg/L (range, 0-15 898), respectively.
Patients recruited to the study per year
| Year | Total patients treated, N | Patients with missing response data, n |
|---|---|---|
| 2010 | 7 | 0 |
| 2011 | 46 | 0 |
| 2012 | 83 | 3 |
| 2013 | 113 | 5 |
| 2014 | 170 | 11 |
| 2015 | 188 | 10 |
| 2016 | 191 | 16 |
| 2017 | 117 | 8 |
| Year | Total patients treated, N | Patients with missing response data, n |
|---|---|---|
| 2010 | 7 | 0 |
| 2011 | 46 | 0 |
| 2012 | 83 | 3 |
| 2013 | 113 | 5 |
| 2014 | 170 | 11 |
| 2015 | 188 | 10 |
| 2016 | 191 | 16 |
| 2017 | 117 | 8 |
Baseline characteristics (N = 915)
| Median (range) or n (%) | |
|---|---|
| Age, y | 66 (29-89) |
| Males/females | 540 (59)/375 (41) |
| NYHA class | |
| 1 | 223 (24.4) |
| 2 | 446 (48.7) |
| 3 | 108 (11.8) |
| 4 | 4 (0.1) |
| Unrecorded | 134 (15.0) |
| ECOG score | |
| 0 | 205 (22.4) |
| 1 | 363 (40.0) |
| 2 | 259 (28.3) |
| 3 | 49 (5.3) |
| 4 | 0 |
| Unrecorded | 39 (4.0) |
| Cardiac involvement | 653 (71.4) |
| NT-proBNP, ng/L | 2 228 (29-93 776) |
| High-sensitivity cardiac troponin T, ng/L | 54 (1-458) |
| Mayo stage | |
| I | 144 (15.7) |
| II | 302 (33) |
| III, NT-proBNP ≤ 8500 ng/L | 344 (37.6) |
| III, NT-proBNP > 8500 ng/L | 125 (13.7) |
| Systolic blood pressure, mm Hg | 118 (63-198) |
| LV wall thickness, mm | 13 (6-23) |
| LV ejection fraction, % | 58 (11-80) |
| Renal involvement | 623 (68.1) |
| Serum creatinine, μmol/L | 97.5 (26-1124) |
| GFR, mL/min | 64 (3-100) |
| Proteinuria, g/24 h | 3.14 (0.08-36.05) |
| Liver involvement | 124 (13.5) |
| Serum bilirubin, μmol/L | 6 (1-449) |
| ALP, U/L | 90 (26-2142) |
| Soft tissue involvement | 124 (13.5) |
| Peripheral nerve involvement | 57 (6.2) |
| Autonomic nerve involvement | 53 (5.8) |
| GI involvement | 28 (3.0) |
| No. of involved organs | 2 (1-5) |
| Involved light chains | |
| κ | 186 (20.3) |
| λ | 680 (74.3) |
| No monoclonal light chain excess | 49 (5.4) |
| Median dFLC, mg/L | 180 (0-15898) |
| IgG/IgA/IgM/IgD/light chain/no detectable serum paraprotein | 239 (26.1)/93(10.2)/26 (2.8)/4(0.04)/61(6.7)/492 (53.8) |
| Median serum monoclonal protein, g/L | 4 |
| Duration from diagnosis to treatment initiation, d | 27 (0-98) |
ALP, alkaline phosphatase; ECOG, Eastern Cooperative Oncology Group; GFR, glomerular filtration rate; GI, gastrointestinal; Ig, immunoglobulin; LV, left ventricular; NYHA, New York Heart Association.
All patients were treated with bortezomib in some form: CyBorD, 94.9%; bortezomib-dexamethasone, 2.9%; bortezomib-thalidomide-dexamethasone, 1.3%; bortezomib-melphalan-prednisolone, 0.4%; bortezomib-melphalan-dexamethasone (BMDex), 0.2%; bortezomib-lenalidomide-dexamethasone, 0.2%; and bortezomib-melphalan-thalidomide-dexamethasone, 0.1%. The median number of chemotherapy cycles was 5 (range, 1-9). Patients found not to be in a hematologic response at 3 months continued bortezomib with addition of cyclophosphamide or thalidomide.
Hematologic responses
Of 915 total patients, response analysis excluded 43 patients as a result of presenting dFLC < 20 mg/L (the lowest dFLC analyzed in recently reported “low dFLC” studies8,9 ) and 53 patients because of missing response data. The latter group did not attend follow-up at our center at 12 months, but survival data for these patients are available and have been incorporated into survival analysis. Therefore, 819 patients were included in hematologic response intent-to-treat (ITT) analysis. Evaluable response analysis included 612 patients (this excluded the patients who died before response assessment). Hematologic responses are shown in Figure 2A. Hematologic responses (ITT) were CR, 25%; VGPR, 20%; PR, 16%; low dFLC PR, 4%; and nonresponse 35% (including 207 deaths, 25%). Evaluable hematologic responses (n = 612) were CR, 35%; VGPR, 27%; PR, 20%; low dFLC PR, 5%; and nonresponse, 13%. Of 421 patients with Mayo stage III disease, hematologic responses (ITT) were CR, 23%; VGPR, 19%; PR, 11%; low dFLC PR, 1%; and nonresponse, 46% (including deaths, 39%). Evaluable hematologic responses (ie, deaths excluded, n = 256) in stage III patients were CR, 38%; VGPR, 32%; PR, 19%; low dFLC PR, 1%; and nonresponse, 10%. ITT hematologic responses in stage IIIB disease were CR, 13%; VGPR, 17%; PR, 8%; low dFLC PR, 1%; and nonresponse, 61% (including deaths, 59%). Evaluable hematologic responses (deaths excluded) in stage IIIB patients included CR, 33%; VGPR, 41%; PR, 18%; low dFLC PR, 2%; and nonresponse, 6%.
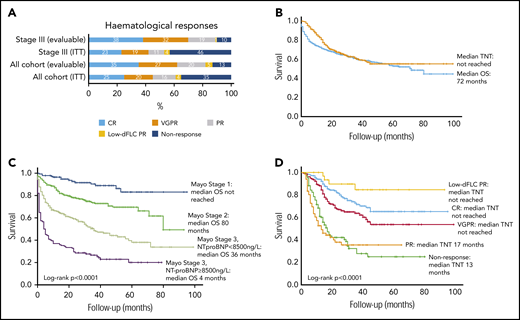
Hematological responses, OS (in the full cohort and stratified by cardiac disease stage), and time to next treatment. (A) Hematologic responses in the cohort. (B) Median OS and TNT. (C) Median OS by Mayo cardiac staging. (D) Median TNT in patients by hematologic response.
Hematological responses, OS (in the full cohort and stratified by cardiac disease stage), and time to next treatment. (A) Hematologic responses in the cohort. (B) Median OS and TNT. (C) Median OS by Mayo cardiac staging. (D) Median TNT in patients by hematologic response.
The proportions of patients in a CR with presenting dFLC of 50 to 200 mg/L, 201 to 600 mg/L, and >600 mg/L were 58%, 28%, and 14%, respectively.
Overall survival and TNT
Median follow-up for all patients and living patients was 23 and 32 months, respectively. Median OS (ITT, n = 915) was 72 months (Figure 2B). A total of 289 patients (31.6%) died without progressing to second-line treatment. Of the remaining 626 patients, the median TNT was not reached, and 55% had not progressed to further treatment at 7 years. Median OS in Mayo stage I, II, IIIa, and IIIb was not reached and 80, 36, and 4 months, respectively (P < .0001; Figure 2C). Median TNT was not reached in Mayo stage I, II, and IIIa, and it was 38 months in stage IIIb.
Median OS was not reached in patients in CR or low dFLC PR; median OS was 71 and 39 months in patients in PR and nonresponders, respectively. Median TNT was not reached in patients with CR, VGPR, or low dFLC response, and it was 17 and 13 months in patients in a PR and nonresponders, respectively (Figure 2D). At 1, 5, and 7 years, 98%, 77%, and 60% of CR patients, respectively, did not require further treatment.
In patients considered transplant eligible upfront (ie, age < 70 years, NT-proBNP < 5000 ng/L, cardiac troponin T < 60 ng/L, serum creatinine < 150 μmol/L, and organ involvement < 3) but who were treated with upfront bortezomib instead, the median OS and TNT were not reached. At 5 years, 78% were still alive, and 71% had not progressed to next treatment.
Assessing impact of achieving a stringent dFLC response at 6 months
Absolute 6-month dFLC responses (ITT, n = 819) were dFLC < 10 mg/L, 30%; dFLC 10 to 20 mg/L, 11%; dFLC 20 to 30 mg/L, 6%; dFLC 30 to 40 mg/L, 5%; dFLC 40 to 50 mg/L, 3%; dFLC > 50 mg/L, 20%; and death, 25% (Table 3). Presenting dFLC levels did not impact upon achievement of stringent dFLC responses (<10 mg/L). Presenting dFLC for all 246 patients reaching a stringent dFLC response was <50 mg/L, 22%; 50 to 200 mg/L, 45%; and >200 mg/L, 33%. Of patients achieving a stringent dFLC response, 13% had an abnormal serum-free light chain ratio.
Absolute 6-month dFLC response (ITT = 819)
| 6-Mo dFLC, ng/mL | Response in each category, % | Cumulative no. of patients in a response, % |
|---|---|---|
| <10 | 30 | 30 |
| 10-20 | 11 | 41 |
| 20-30 | 6 | 47 |
| 30-40 | 5 | 52 |
| 40-5 | 3 | 55 |
| >50 | 20 | 75 |
| 6-Mo dFLC, ng/mL | Response in each category, % | Cumulative no. of patients in a response, % |
|---|---|---|
| <10 | 30 | 30 |
| 10-20 | 11 | 41 |
| 20-30 | 6 | 47 |
| 30-40 | 5 | 52 |
| 40-5 | 3 | 55 |
| >50 | 20 | 75 |
Median OS and TNT were significantly better for patients achieving a stringent dFLC response compared with lesser responses (even if they achieved a VGPR by ICC). Median OS was not reached in patients achieving a stringent dFLC response or dFLC 10 to 40 mg/L compared with 53 months in patients with dFLC ≥ 40 mg/L (P < .0001, log-rank test; Figure 3A). At 1, 3, and 5 years, 98%, 92%, and 86% of patients achieving a stringent dFLC response were alive. In the group with dFLC 10 to 40 mg/L, 97%, 84%, and 66% of patients were alive at 1, 3, and 5 years, respectively. Median TNT in patients with 6-month dFLC < 10 mg/L, 10 to 40 mg/L, and >40 mg/L was not reached and 38 and 13 months, respectively (log-rank P < .0001; Figure 3B).
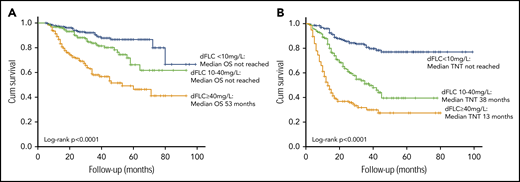
OS and TNT stratified by depth of dFLC response. Median OS (A) and median TNT (B) by absolute 6-month dFLC value.
OS and TNT stratified by depth of dFLC response. Median OS (A) and median TNT (B) by absolute 6-month dFLC value.
There was a significant difference in OS between CR patients with stringent dFLC responses (n = 145, median not reached) and CR patients without stringent dFLC responses (n = 67, median not reached; P = .033; Figure 4A). The median TNT in CR patients with stringent dFLC responses was not reached compared with 38 months in CR patients without a stringent dFLC response (P < .001; Figure 4B).
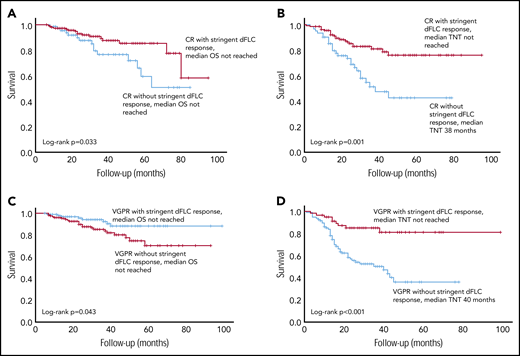
Survival outcomes in patients with a CR, with and without a stringent dFLC response. (A) The OS was significantly better in patients with CR with additional stringent dFLC response compared with those in CR without a stringent dFLC response (P = .033: median not reached in both groups). (B) TNT in CR patients with and without a stringent dFLC response. Median TNT was not reached in the former group and was 38 months in the latter (P = .001). (C) OS was significantly better in patients with a stringent dFLC response (without CR) compared with dFLC 10 to 40 mg/L (without CR), although the median was not reached in either group (P = .043). (D) Median TNT was not reached in patients in VGPR with stringent dFLC response and was 40 months in those in a VGPR without a stringent dFLC response (P < .001).
Survival outcomes in patients with a CR, with and without a stringent dFLC response. (A) The OS was significantly better in patients with CR with additional stringent dFLC response compared with those in CR without a stringent dFLC response (P = .033: median not reached in both groups). (B) TNT in CR patients with and without a stringent dFLC response. Median TNT was not reached in the former group and was 38 months in the latter (P = .001). (C) OS was significantly better in patients with a stringent dFLC response (without CR) compared with dFLC 10 to 40 mg/L (without CR), although the median was not reached in either group (P = .043). (D) Median TNT was not reached in patients in VGPR with stringent dFLC response and was 40 months in those in a VGPR without a stringent dFLC response (P < .001).
OS was significantly better in patients with a stringent dFLC response (without CR) compared with dFLC 10-40 mg/L (without CR), although the median was not reached in both groups (P = .043; Figure 4C). The median TNT in VGPR patients with and without a stringent dFLC response was not reached and 40 months, respectively (P < .001; Figure 4D). The median OS was not reached in patients with a CR and those with a stringent dFLC response without CR, although OS appeared to be better in the latter (P = .089).
In a multivariate analysis, 6-month dFLC was predictive of TNT, independent of Mayo disease stage and presenting serum-free light chains (Table 4).
Multivariate model incorporating Mayo disease stage, presenting dFLC, and 6-month absolute dFLC values
| Hazard ratio | P | 95% confidence interval | |
|---|---|---|---|
| OS | |||
| Mayo disease stage | |||
| 1 | 2.05 | .06 | 0.96-4.34 |
| 2 | 3.7 | .01 | 1.74-7.86 |
| 3 | 6.49 | <.001 | 2.96-14.21 |
| Presenting dFLC < 180 mg/L | 1.3 | .04 | 1.01-1.68 |
| ECOG score | |||
| 1 | 1.25 | .29 | 0.83-1.9 |
| 2 | 2.12 | <.001 | 1.39-3.22 |
| 3 | 2.3 | .004 | 1.3-4.08 |
| TNT | |||
| Mayo disease stage | |||
| 1 | 1.01 | .96 | 0.70-1.47 |
| 2 | 0.84 | .40 | 0.56-1.26 |
| 3 | 0.91 | .73 | 0.52-1.58 |
| Presenting dFLC < 180 mg/L | 0.94 | .70 | 0.71-1.26 |
| 6 mo dFLC, mg/L | |||
| <10 | Reference | ||
| 10-20 | 2.76 | <.001 | 1.72-4.43 |
| 20-30 | 2.78 | <.001 | 1.74-4.46 |
| 30-40 | 3.27 | <.001 | 1.82-5.87 |
| 40-50 | 3.81 | <.001 | 2.32-6.28 |
| >50 |
ECOG, Eastern Cooperative Oncology Group.
A total of 22.9% of patients achieving a dFLC response had amyloidogenic light chains of κ isotype. These patients had a better OS than did those with λ light chain isotype (P = .033). The median was not reached in either group; 100% of patients with κ light chains and 83% of patients with λ light chains were alive at 5 years. Of patients with a stringent dFLC response, patients with λ light chain preponderance were more likely to have cardiac involvement (72.5%) than those κ light chain preponderance (54.5%; P = .026). In the entire cohort, these percentages were 68% and 61%, respectively (P = .073). There was no significant difference in median OS or TNT between these 2 groups in the entire cohort. There was no difference in TNT between the 2 light chain isotypes. Forty-four of 246 (17.9%) patients achieving a stringent dFLC response had reduced creatinine clearance (<30 mL/min); of these 44 patients, 7 (15.9%) had κ amyloidogenic light chains. There was no difference in median OS or TNT in patients with severe renal dysfunction (estimated glomerular filtration rate < 30 mL/min) who had a κ or λ light chain preponderance.
Organ responses
Organ responses were assessed at 12 and 24 months. Table 5 outlines organ responses at 12 months according to 6-month hematologic response. On an ITT basis, 517 patients with cardiac involvement were assessable. At 12 months, 32.5% achieved cardiac responses, 21.7% did not, and 45.8% had died. By 24 months, 88 patients had progressed to next treatment (including 41 who had previously been in a cardiac response). At 24 months, of the remaining patients, 28.6% were in a cardiac response, 11.6% were not, and 59.8% had died. dFLC responses were assessed in patients who were alive at 6 months. Twelve-month cardiac responses were achieved in 76 of 125 (61%) of patients with stringent dFLC responses at 6 months compared with 90 of 199 (45%) patients with lesser responses (P = .005; Figure 5).
Organ responses 12 months after treatment according to 6-month hematologic response
| 6-mo hematologic response | 12-mo cardiac response (%) | 12-mo renal response (%) | 12-mo liver response (%) |
|---|---|---|---|
| CR | 67/113 (59.3) | 32/148 (21.6) | 9/20 (45) |
| CR, dFLC < 10 mg/L | 43/72 (59.7) | 28/100 (28) | 6/16 (37.5) |
| CR, dFLC ≥ 10 mg/L | 24/41 (58.5) | 4/48 (8.3) | 3/4 (75) |
| VGPR | 55/119 (46.2) | 23/122 (18.9) | 9/21 (42.9) |
| PR | 21/59 (35.6) | 12/78 (15.4) | 6/17 (35.3) |
| Nonresponse | 5/25 (20) | 6/56 (10.7) | 2/7 (28.6) |

On an ITT basis, 611 patients with renal involvement were assessable for renal response: 15.4% achieved renal responses, 59.9% did not, and 24.7% had died. At 24 months, 148 patients had progressed to next treatment (including 5 who had achieved a renal response at 12 months). Of the remaining patients, 26% had a renal response, 32% were nonresponders, and 42% died. Twelve-month renal responses were achieved in 55 of 204 (27%) patients with stringent 6-month dFLC responses compared with 38 of 267 (14%) patients with lesser responses (P = .001).
On an ITT basis, 95 patients with liver involvement were assessable for liver response: 30% achieved liver responses, 45% did not, and 25% had died. Achieving a stringent dFLC response or not did not affect liver responses.
Toxicity
Table 6 details the reported toxicities, the most common of which were grade 1-2 lethargy, constipation, fluid overload, and sensory neuropathy.
Grade 1-2 and grade 3-4 toxicities experienced by patients included in this cohort
| Grade 1-2, % | Grade 3-4, % | |
|---|---|---|
| Lethargy | 55.7 | 6.5 |
| Fluid overload | 24.1 | 4.8 |
| Nonneutropenic infection | 6.2 | 4 |
| Neutropenia | 2.5 | 0.2 |
| Febrile neutropenia | 0.04 | 0.001 |
| Hypotension | 12.3 | 2 |
| Sensory neuropathy | 21.1 | 1.3 |
| Motor neuropathy | 0.8 | 0.07 |
| Diarrhea | 13.1 | 1.3 |
| Constipation | 25.5 | 0.03 |
| Rash | 7.4 | 0.03 |
Discussion
In this study, we report outcomes for the largest unselected cohort of AL patients treated with upfront bortezomib (primarily CyBorD) therapy. This cohort captures nearly all AL patients seen at our center, two thirds of whom presented with cardiac involvement, and half had Mayo stage III disease. Hematologic response rates were high (ORR 65%), with half achieving VGPR/better in an ITT analysis. TNT was excellent, with median TNT not reached for responders at 7 years; these data rival outcomes reported with upfront ASCT. However, we remain unable to abrogate the high incidence of early mortality in AL, with 40% of stage III patients dying within 6 months of diagnosis; these data are not captured in prospective clinical trials because of selection bias. Lastly, achieving a stringent dFLC response resulted in significantly better TNT and translated into two thirds of patients achieving cardiac responses. Therefore, achievement of a stringent dFLC response may be a potential new therapy goal in AL.
Treatment in AL has evolved, and the Mayo group reported that the glass ceiling of poor outcomes has been overcome.14 The proapoptotic effect of proteosomal inhibition is a desirable mechanism of treatment because AL plasma cells are substantially more sensitive to proteasome inhibition as a result of the added burden of proteotoxicity.15,16 Although ASCT is associated with excellent hematologic responses and OS,17 only 20% of patients are ASCT eligible, and there are concerns about treatment-related toxicity outside of experienced centers. Bortezomib-based therapy makes up the mainstay of treatment of most newly diagnosed AL patients at our center.
Table 7 summarizes outcomes with upfront bortezomib in previous AL studies. We reported a matched comparison of CyBorD with cyclophosphamide-thalidomide-dexamethasone, with ORR of 71% and CR of 40.6% in the former group.18 A multicenter study of 60 treatment-naive Mayo stage III AL patients treated with CyBorD revealed an ORR of 68%, with a poorer CR rate (17%).5 A European multicenter retrospective study of 230 AL patients treated upfront with CyBorD demonstrated an ORR of 60% and CR of 21%, with inferior outcomes in stage III patients.4 An international randomized phase 3 study of melphalan-dexamethasone compared with BMDex revealed significantly better ORR in the latter group (81%) than in the former (56%).19 The heterogeneous outcomes in these studies likely reflect their differing sample sizes and proportions of patients with severe cardiac involvement. Hematologic and organ responses in our study were similar to the European collaboration study of CyBorD4 and the multicenter study of CyBorD in stage III patients,5 reflecting the large proportions of stage III patients in these studies.
Summary of studies with upfront bortezomib-based therapy in systemic AL amyloidosis
| Bortezomib-containing regimen | Newly diagnosed patients treated with bortezomib, n | Stage III patients, % | Median follow-up, mo | ITT ORR, % | ITT CR, % | Organ response | Median OS | Median PFS or TNT |
|---|---|---|---|---|---|---|---|---|
| Current cohort (primarily CyBorD) | 915 | 51.3 | 23 mo in all patients; 32 mo in living patients. | 65 | 15 | ITT: | 72 mo | Median TNT not reached (55% had not progressed to next treatment at 7 y) |
| Cardiac 32.5% | ||||||||
| Renal 15.4% | ||||||||
| Liver 30% | ||||||||
| CyBorD5 | 60 | 100 | 11.8 | 68 | 17 | Cardiac 32% | 1-y OS, 57%. | Not documented |
| Renal 23% | ||||||||
| Liver 25% | ||||||||
| CyBorD18 | 69 | 58 | 12.7 | 71 | 40.6 | Evaluable responses: | 1-y OS, 65.2%. | Median PFS, 28 mo. |
| Cardiac 35% | ||||||||
| Renal 43% | ||||||||
| Liver 53% | ||||||||
| Bortezomib, dexamethasone24 | 49 treated with bortezomib-dexamethasone (26 with twice-weekly bortezomib, 23 with once-weekly bortezomib). | 28 (twice-weekly bortezomib), 48 (once-weekly bortezomib). | 57 | 77 | 39 | Cardiac 45% | 1-y OS, 67%; 4-y OS, 43%. | 1-y PFS, 58%; 4-y PFS, 26%. |
| Renal 53% | ||||||||
| CyBorD4 | 230 | 49 | 25 (living patients) | 62 | 21 | Cardiac 17% | 5-y OS, 55%. | Median PFS, 13 mo. |
| Renal 25% | ||||||||
| Liver 32% | ||||||||
| BMDex19 | 53 | 15 | 25 (living patients) | 81 | 64 (CR/VGPR) | Cardiac 38% | 1-y OS, 80%. | Not documented |
There is a paucity of data on duration of response with upfront bortezomib in AL. Our European multicenter study of CyBorD reported that 55% of patients were alive at 5 years, and median progression-free survival (PFS) was 13 months.4 Four-year OS in AL reported by the Mayo group was 31% in 2000 to 2004, 54% in 2005 to 2009, and 60% in 2010 to 2014.14 The current cohort shows that the contemporary OS of unselected AL patients was 72 months, confirming a progressive improvement in OS in AL over the last decade at our center20 and others.
PFS and TNT after chemotherapy (particularly bortezomib-based regimens) remain less robustly studied compared with the rates reported after ASCT. The median PFS in the Mayo study was 6, 11, and 16 months in 2000 to 2004, 2005 to 2009, and 2010 to 2014, respectively.14 The Mayo study reported a median PFS of 53 months and 8 months in the ASCT and non-ASCT groups treated from 2010 to 2014, respectively. However, most patients were not treated with upfront bortezomib. Outcomes with ASCT in AL have dramatically improved in recent years, with median OS of 7 to 10 years17,21 ; the median PFS has been reported as 2.6 to 4 years in 2 large retrospective analyses of patients treated with ASCT.21,22 In this study, patients who would be regarded as eligible for upfront ASCT, but were treated with upfront bortezomib instead, had excellent outcomes; 78% were still alive and 71% had not progressed to further treatment at 5 years.
The median TNT was not reached and 55% did not progress to next treatment at 7 years. Of note, 98% of patients in a CR did not require further treatment at 1 year, and 77% and 60% did not require further treatment at 5 and 7 years, respectively. Two key messages are apparent. First, bortezomib cannot overcome the high early mortality that plagues AL. Second, patients achieving hematologic responses, especially deep responses, have a prolonged TNT almost rivaling those achieved with upfront ASCT. Most patients in this study were treated with CyBorD. Perhaps, given remarkable early data with BMDex in the recently concluded phase 3 study,19 the latter may induce more durable responses.
Light chains drive AL, and their reduction has been key to improving outcomes. Current ICC derive from the pivotal international series reported in 2012.6 Most patients in the latter series were not treated with an upfront bortezomib-based regimen, and deep responses were less frequent. Hence, dFLC < 40 mg/L (VGPR) was considered “adequate” and the goal of therapy. Low dFLC criteria (for patients not assessable by standard criteria because of baseline dFLC < 50 mg/L) have subsequently been identified: a low dFLC response is defined as dFLC < 10 mg/L in patients with presenting dFLC 20 to 50 mg/L, predictive of OS and renal survival. The importance of light chain burden has also been demonstrated in a recent study by the Mayo group, whereby an involved free light chain level < 20 mg/L translated into better organ responses, PFS, and OS. In the latter study, normalization of the serum free light chain ratio was not associated with better outcomes.23
We demonstrate here that low dFLC response criteria can be extended to all AL patients, irrespective of presenting dFLC. Patients achieving a stringent dFLC response have excellent outcomes. As a result of the already excellent survival in patients with a deep response, there is no significant apparent difference in OS using dFLC response criteria, although this may become apparent on longer follow-up. However, the TNT in the group achieving absolute dFLC < 10 mg/L is markedly better than in those with lesser responses (even if dFLC was below the threshold of a VGPR [<40 mg/L]). Even in patients who had achieved a conventional CR by ICC, 84% with stringent dFLC responses did not progress to further treatment at 3 years compared with 72% of patients in a CR without stringent dFLC responses. More importantly, stringent dFLC responses translated into strikingly high cardiac responses, with 61% of patients with stringent dFLC responses achieving cardiac responses compared with 32% in the entire cohort.
This study’s strength is its ability to capture a large “real-world” AL cohort treated in multiple centers. However, it only includes patients seen at the UK National Amyloidosis Centre. Although most patients in the United Kingdom are seen here for assessment, there is a referral bias in that the sickest patients are unable to travel to our center. Because of its observational nature, exact treatment regimens and doses were at the discretion of the locally treating physician. Although there was an attempt to capture toxicity, this was reported at the discretion of the local physicians. Because of the lack of source data verification, it is likely that toxicity data have been missed and are likely to be underreported. This remains a significant limitation. The proportion of patients in a CR with and without stringent dFLC responses was small, limiting the comparison of outcomes between a stringent dFLC response and CR. Importantly, we have evaluated the importance of a stringent dFLC response in patients treated with only bortezomib-based therapy. The impact of a stringent dFLC response remains to be ascertained in patients treated with other therapies.
In conclusion, this study confirms the substantial impact of bortezomib in improving long-term outcomes in AL. We show that patients responding to therapy have a long TNT, perhaps approaching that seen with ASCT. Unfortunately, high early mortality remains a feature of AL, and this glass ceiling has not been breached. Finally, this is the first study to apply the new “low dFLC” response criteria to an unselected AL population. Achieving absolute dFLC < 10 mg (a stringent dFLC response) predicts prolonged overall survival and TNT and led to impressive organ responses. If these findings are validated in an independent international collaborative cohort, a stringent dFLC response may potentially become the new goal of therapy in AL.
Because of patient confidentiality and consent issues, the data are not available for sharing.
Presented in abstract form at the 60th annual meeting of the American Society of Hematology, San Diego, CA, 2 December 2018.
The publication costs of this article were defrayed in part by page charge payment. Therefore, and solely to indicate this fact, this article is hereby marked “advertisement” in accordance with 18 USC section 1734.
Acknowledgments
The authors thank their staff in cardiac imaging, genetics, and histopathology, as well as all of those involved in the clinical care of their patients.
Authorship
Contribution: R.M. and A.D.W. designed the study, collected and analyzed data, and wrote the manuscript; O.C. collected data and reviewed the manuscript; and F.S., S.M., S.S., D.F., H.J.L., C.Q., M.F., J.D.G., C.W., and P.N.H. reviewed the manuscript and provided critical input.
Conflict-of-interest disclosure: The authors declare no competing financial interests.
Correspondence: Ashutosh D. Wechalekar, National Amyloidosis Centre, University College London, Royal Free Campus, Rowland Hill St, London NW3 2PF, United Kingdom; e-mail: a.wechalekar@ucl.ac.uk.

This feature is available to Subscribers Only
Sign In or Create an Account Close Modal