

Key Points
EBV miR-BHRF1-2-5p fine-tunes the LMP1-driven amplification of the immune checkpoint ligands PD-L1 and PD-L2.
Further identification of immune checkpoint–targeting miRs may enable potential novel RNA-based therapies to emerge.

Abstract
Epstein-Barr virus–positive (EBV+) diffuse large B-cell lymphomas (DLBCLs) express high levels of programmed death ligand 1 (PD-L1) and PD-L2. MicroRNA (miR) regulation is an important mechanism for the fine-tuning of gene expression via 3′-untranslated region (3′UTR) targeting, and we have previously demonstrated strong EBV miR expression in EBV+ DLBCL. Whereas the EBV latent membrane protein-1 (LMP1) is known to induce PD-L1/L2, a potential counterregulatory role of EBV miR in the fine-tuning of PD-L1/L2 expression remains to be established. To examine this, a novel in vitro model of EBV+ DLBCL was developed, using the viral strain EBV WIL, which unlike common laboratory strains retains intact noncoding regions where several EBV miRs reside. This enabled interrogation of the relationship among EBV latency genes, cell of origin (COO), PD-L1, PD-L2, and EBV miRs. The model successfully recapitulated the full spectrum of B-cell differentiation, with 4 discrete COO phases: early and late germinal center B cells (GCBs) and early and late activated B cells (ABCs). Interestingly, PD-L1/L2 levels increased markedly during transition from late GCB to early ABC phase, after LMP1 upregulation. EBV miR–BamHI fragment H rightward open reading frame 1 (BHRF1)–2-5p clustered apart from other EBV miRs, rising during late GCB phase. Bioinformatic prediction, together with functional validation, confirmed EBV miR-BHRF1-2-5p bound to PD-L1 and PD-L2 3′UTRs to reduce PD-L1/L2 surface protein expression. Results indicate a novel mechanism by which EBV miR-BHRF1-2-5p plays a context-dependent counterregulatory role to fine-tune the expression of the LMP1-driven amplification of these inhibitory checkpoint ligands. Further identification of immune checkpoint–targeting miRs may enable potential novel RNA-based therapies to emerge.
Introduction
Diffuse large B-cell lymphomas (DLBCLs) represent a clinically and biologically highly heterogeneous spectrum of aggressive CD20+ neoplasms. This includes DLBCL not otherwise specified (NOS),1 as well as a less well-characterized subset in which the malignant B cells contain the B-cell lymphotrophic Epstein-Barr virus (EBV), termed EBV+ DLBCL NOS.2
Lymphomagenesis is complex, in part reflecting the nature of the transforming event, as well as the developmental stage of the B cells at which differentiation arrest occurs. Normal B-cell differentiation involves a germinal center (GC) reaction that is initiated when a naïve B cell encounters an antigen, leading to an activated B-cell (ABC) phenotype, and then ends with a terminally differentiated B cell. In DLBCL NOS, interruption of this process by a transforming event results in a clonal proliferation where differentiation of the B cell can go no further. Transcriptome profiling based on the postulated B-cell cell of origin (COO) classifies DLBCL into 2 distinct subtypes according to their similarity to the normal stages of B-cell differentiation: GC B cells (GCBs) and ABCs.3 EBV drives an atypical GCB reaction,4 with a majority of EBV+ DLBCLs having an ABC phenotype.5
DLBCL patients with programmed death ligand 1 (PD-L1) overexpression and/or PD-L1 gene alterations have inferior survival after frontline chemoimmunotherapy.6,7 Diverse somatic alterations leading to dysregulation of PD-L1 and PD-L2 are thought to be key drivers of lymphomagenesis.8-11 Various structural variations (deletions, inversions, tandem duplications, and translocations) result in truncation of the 3′-untranslated regions (3′UTRs) of PD-L1 and PD-L2. Truncation of the 3′UTR of PD-L1 is present in a variety of solid cancers,12 whereas truncation of the 3′UTR of PD-L2 in these tumors is rarely observed. In contrast, truncation involving both PD-L1 and PD-L2 3′UTRs is seen in EBV+ lymphomas, including up to 57% of aggressive natural killer cell leukemias.13 The frequency of structural variations in EBV+ DLBCL is ∼20%, underscoring the importance of the deregulated expression of these PD-L1s in permitting evasion of host immunity to enable EBV-driven malignant B-cell clonal expansion. Consistent with this, in vitro gene editing has shown that disruption of the PD-L1 and/or PD-L2 3′UTR results in significant elevation of PD-L1/L2 expression, respectively, in human B-cell lymphomas.12
Truncation of the 3′UTR likely contributes to tumor growth, which may explain the paucity of mutations in B-cell receptor/NF-κB pathway–associated molecules in EBV+ DLBCL.13 The EBV latent membrane protein-1 (LMP1) is known to induce PD-L1/L2 in malignant B cells.14,15 EBNA2 also increases PD-L1, which it achieves indirectly via regulation of the PD-L1 targeting microRNA-34a (miR-34a).15 By contrast, a role by which EBV might regulate PD-L1 and PD-L2 expression has to our knowledge not been described. Interestingly, EBV was the first human virus found to encode miRs.16-22 MiRs function in part by targeting the 3′UTRs of messenger RNAs (mRNAs) for degradation and/or translational repression, and host miRs have been shown to regulate both PD-1 and PD-L1 expression.23 However, the role of EBV miR in the regulation of PD-L1 and PD-L2 has yet to be established, and its elucidation may have potential therapeutic implications.
Materials and methods
High-efficiency B-cell infection by spinoculation with EBV WIL
Peripheral blood mononuclear cells (PBMCs) were prepared by gradient centrifugation (Ficoll-Paque; Amersham Biosciences) of blood samples from dual-negative (by polymerase chain reaction [PCR] for EBV DNA and by serology) healthy donors. Written informed consent was provided by all blood donors. The study protocol was approved by the local ethics committee. Naïve CD27−CD19+ B cells were isolated from PBMCs by magnetic separation using the Naïve B-Cell Isolation Kit II (Miltenyi Biotec). Flow cytometry indicated >95% purity. Isolated naïve B cells were infected with the EBV WIL strain24 using a high-efficiency spinoculation technique.25 Cells were maintained at 37°C, with 5% carbon dioxide in RPMI 1640 supplemented with penicillin/streptomycin and 10% fetal bovine serum (Gibco). Of note, in the conventional B95-8 strain of EBV, 6 BamHI fragment A rightward transcript (BART) cluster 1 miRs and all BART cluster 2 miRs are deleted in a 14-kb region of the BARTs, whereas all EBV miRs are intact in the EBV WIL strain. Spontaneous lymphoblastoid cell lines (LCLs) were generated as previously described.26
Preparation of RNA, reverse transcription, and gene expression analysis
At 11 selected time points (8 hours, daily for 1-4 days, and weekly from 1-6 weeks) after infection, EBV WIL–infected cells were isolated and RNA extracted using the miRvana Kit (Ambion). For gene expression quantification, complementary DNA (cDNA) was synthesized using Superscript III (Invitrogen) primed with random hexamers (Promega). Quantitative real-time PCR (qRT-PCR) for B-cell differentiation genes and viral promoters was performed using SYBR Green PCR Master Mix (Applied Biosystems), with cDNA equivalent to 10-ng input RNA. For miR expression quantification, cDNA was prepared and qRT-PCR performed as previously described.20 Primers detail have been previously described.20 Samples were quantified using the Rotorgene 6.0 software (Corbett Research) comparative quantitation method, with results expressed relative to a reference LCL and normalized to the EBV genome (EBV genes), the housekeeping gene β2M (host genes), and the cell-derived small RNA molecule U6 (EBV miRs) as previously outlined.20 NanoString for COO using Lymph2Cx and EBER in situ hybridization (ISH) were performed as previously described.27,28 Microarray data sets of B-cell differentiation stages were used for comparison with our qRT-PCR data (supplemental Methods, available on the Blood Web site).
Validations of miR repression of PD-L1 and PD-L2
A dual luciferase reporter assay was performed for validation of miR binding sites in the 3′UTRs of PD-L1 and PD-L2 using a previously developed method (supplemental Methods).29
Flow cytometry was used for functional validations of miR-mediated repression of PD-L1 and PD-L2 proteins in EBV WIL–infected LCLs and EBV B95-8–infected LCLs (more details in supplemental Methods).
Data analysis
Hierarchical clustering using Pearson correlation to measure for distance and complete linkage for agglomeration and statistical analysis of expression was performed using the Genesis software package.30 Other data analyses were performed with Prism (GraphPad), Excel (Microsoft) software, and R statistical packages. The miRanda (version 3.3a) miR binding site prediction bioinformatic program was used to identify putative EBV miR target binding sites located in the 3′UTRs of the PD-L1 and PD-L2 genes.
Results
Segregation of B-cell differentiation stages
To establish candidate genes to test an in vitro model of B-cell differentiation, a panel of 12 marker genes capable of specifying the dynamics of B-cell differentiation was developed. Selection was initially based on a literature search for genes exhibiting expression specific to established states of B-cell differentiation from naïve B cells, from GCB through post-GCB phases.31-41 From this list, expression was examined in isolated B cells from each of these B-cell differentiation states from publicly available microarray data sets (supplemental Table 1).42,43 Results revealed 11 genes that exhibited significant differential expression between naïve cells, GCBs (centroblast and centrocyte), and post-GCBs (memory and plasma). CD5 was added to this panel as a marker of naïve B cells that is also upregulated after antigenic exposure and B-cell receptor stimulation.44
The chosen panel of genes was capable of clearly segregating the 3 B-cell differentiation stages by unsupervised hierarchical clustering (Figure 1A). Clustering initially subdivided naïve cells and GCBs from post-GCBs. Further subdivision of genes clustered the naïve cells away from GCBs. Gene clusters were reciprocally expressed between the GCB and post-GCB groupings. Consistent with prior reports, MME (CD10), LMO2, BCL6, and AICDA (AID) were significantly upregulated in GCBs, and CD27, TIMP1, IGHG1, IRF4 (MUM1), and PRDM1 (BLIMP1) were upregulated in post-GCBs.
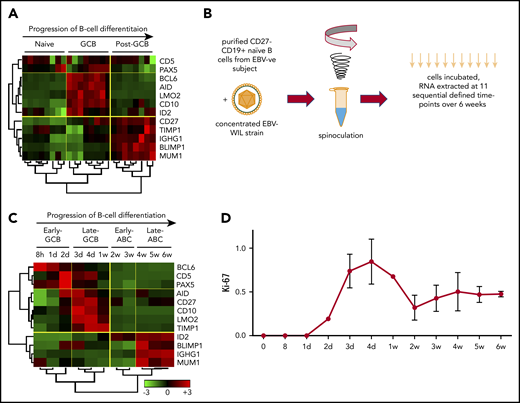
EBV-driven B-cell differentiation comprises 4 discrete phases corresponding to the known biology of B-cell differentiation. (A) Hierarchical clustering of normalized publicly available microarray expression data demonstrates the effectiveness of a selected panel of B-cell marker genes in clearly segregating isolated healthy human B-cell subsets into distinct clusters. (B) Schematic outlining EBV WIL in vitro spinoculation infection model. (C) Hierarchical nonsupervised clustering of normalized panel marker gene qRT-PCR expression data from the EBV in vitro infection model results in clear segregation of 4 discrete phases of B-cell differentiation into clusters. Trees demonstrate the similarity of the expression data between samples (below) and genes (left) as determined by the clustering algorithm. Color saturation within a row indicates differences in expression for each gene relative to the average of the sample population; red indicates a higher expression than the mean expression (black), and green indicates a lower expression. Values are quantified by the scale bar that visualizes differences in normalized expression relative to the mean (0). (D) qRT-PCR for Ki-67 was performed at sequential time points to establish the rate of cell proliferation.
EBV-driven B-cell differentiation comprises 4 discrete phases corresponding to the known biology of B-cell differentiation. (A) Hierarchical clustering of normalized publicly available microarray expression data demonstrates the effectiveness of a selected panel of B-cell marker genes in clearly segregating isolated healthy human B-cell subsets into distinct clusters. (B) Schematic outlining EBV WIL in vitro spinoculation infection model. (C) Hierarchical nonsupervised clustering of normalized panel marker gene qRT-PCR expression data from the EBV in vitro infection model results in clear segregation of 4 discrete phases of B-cell differentiation into clusters. Trees demonstrate the similarity of the expression data between samples (below) and genes (left) as determined by the clustering algorithm. Color saturation within a row indicates differences in expression for each gene relative to the average of the sample population; red indicates a higher expression than the mean expression (black), and green indicates a lower expression. Values are quantified by the scale bar that visualizes differences in normalized expression relative to the mean (0). (D) qRT-PCR for Ki-67 was performed at sequential time points to establish the rate of cell proliferation.
Establishment of an in vitro EBV-driven model of B-cell differentiation
To establish a model of EBV-driven B-cell differentiation, it was important to prevent the in vitro EBV infection process from being contaminated by in vivo EBV-infected B cells and EBV-specific T cells. Hence, only PBMCs from EBV− donors were used. Conventional protocols for in vitro EBV infection inoculated the B cells present within PBMC preparations. However, it is known that naïve and memory B cells have distinct EBV infection and transformation efficiencies, with naïve B cells being more susceptible.25 To provide a homogenous starting population free from the influence of contaminating nonnaïve B cells, infection of CD27−CD19+ naïve B cells isolated from EBV− PBMCs were used (Figure 1B). Spinoculation results in 50% to 60% EBV infection by 48 hours.25 To test the kinetics of transcription of EBER RNA expression after spinoculation, we performed EBER ISH at each of the 11 time points. This showed no EBER ISH+ cells up to and including 96 hours, after which values rose to 19% (day 7) and then to 76% (day 14). From day 21 onward, >95% of cells were EBER ISH+.
At 11 selected time points over 6 weeks after EBV infection, B cells were isolated, and expression levels of the B-cell differentiation panel genes were determined by qRT-PCR. Examination of these expression data by unsupervised hierarchical clustering revealed that B cells displayed distinct profiles exhibiting coordinated expression during specific stages of EBV-driven differentiation (Figure 1C). The principal division of the time course was into 2 groups, with clustering occurring between 1 and 2 weeks. Further subdivision of each group gave rise to 4 discrete phases. Each phase exhibited a distinct expression profile that resembled the components of a B-cell GC reaction. These were termed the early GCB phase (0-2 days), late GCB phase (3 days to 1 week), early ABC phase (2-3 weeks), and late ABC phase (4-6 weeks). Both GCB phases were characterized by upregulation of the GC markers BCL6 and Pax5 and the activation marker CD5 and downregulation of the post-GCB (or ABC) markers ID2, BLIMP1, IGHG1, and MUM1. Relative to the early GCB phase, in the late GCB phase, there was upregulation of the GCB-associated oncogene LMO236 and the GCB survival factors CD10 and TIMP1, with progressive downregulation of BCL6 over time. In the early ABC phase, in which downregulation of LMO2, CD10, and BCL6 occurred, there was upregulation of the Pax5 inhibitor ID2, indicative of a cessation of the GCB phases. Finally, in the late ABC phase, there was upregulation of BLIMP1, IGHG1, and MUM1 and sustained upregulation of ID2 (ie, genes known to be upregulated in the post-GCB differentiation of B cells).45 To determine if the expression profiles observed during specific phases of the EBV model using 12 genes were applicable to patient samples, a time point predictor score algorithm was established (supplemental Materials).46,47 Application to a public data set from Lenz et al48 (GEO accession GSE10846), which profiled genes using the Affymetrix U133 plus 2.0 microarray, supported the relationship between the EBV model phases and DLBCL COO (supplemental Figure 1).
The proliferation marker Ki-67 was quantified by qRT-PCR at each of the 11 time points in 3 healthy donors (Figure 1D). This showed that EBV infection results in highly reproducible proliferative rates across donors, with proliferation greatest during the late GCB phase.
EBV viral latency 3 program is established by the early ABC phase
Transcription of the EBNA genes arises from 1 of 2 promoters, Cp and Wp, located near the left end of the viral genome. Wp is exclusively used to drive EBV nuclear antigen gene transcription during the initial stages of infection in primary B cells, with induction of transcription from Cp afterward.49,50 Whereas LMP1/2 are expressed in latency 2 and 3, EBNA2 is expressed in viral latency 3, where it is involved in upregulating the expression of the other EBNAs. qRT-PCR was used to establish the kinetics of expression for Cp, Wp, LMP1/2, and EBNA2 in relation to the EBV model (Figure 2). Results indicate the expression of the latency 3 program is established by the early ABC phase.
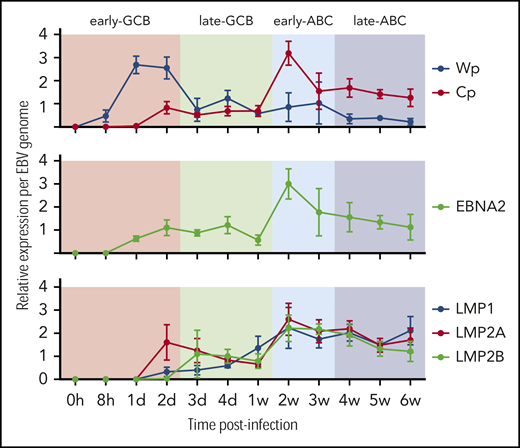
Kinetics of EBV viral expression during the EBV model of B-cell differentiation. Kinetics of expression of the EBV promoters Cp and Wp and key viral latency genes LMP1, LMP2A, LMP2B, and EBNA2 relative to the COO in the EBV model system.
Kinetics of EBV viral expression during the EBV model of B-cell differentiation. Kinetics of expression of the EBV promoters Cp and Wp and key viral latency genes LMP1, LMP2A, LMP2B, and EBNA2 relative to the COO in the EBV model system.
EBV miRs are differentially expressed in lymphoid cells and under different virus latency programs.51 Two distinct EBV miR clusters have been identified. One cluster is located near the mRNA of the BamHI fragment H rightward open reading frame 1 (BHRF1) gene, coding EBV miR-BHRF1-1 to 3, and the other is located in intronic regions of BART.
EBV miRs encoded by BART and BHRF1 loci were assayed by qRT-PCR at the 11 time points. Examination of the expression data by unsupervised hierarchical clustering revealed initial divisions into 2 clusters that separated miR-BHRF1-2-5p, which was relatively elevated during the late GCB phase and then remained raised during the ABC phase, from the remaining EBV miR clusters, which were upregulated between 1 and 2 weeks, corresponding with the exit from the late GCB phase and entry into the early ABC phase (Figure 3). The expression kinetics of the latter are consistent with the onset of an EBV viral latency 3 program by the early ABC phase of the EBV B-cell differentiation model.
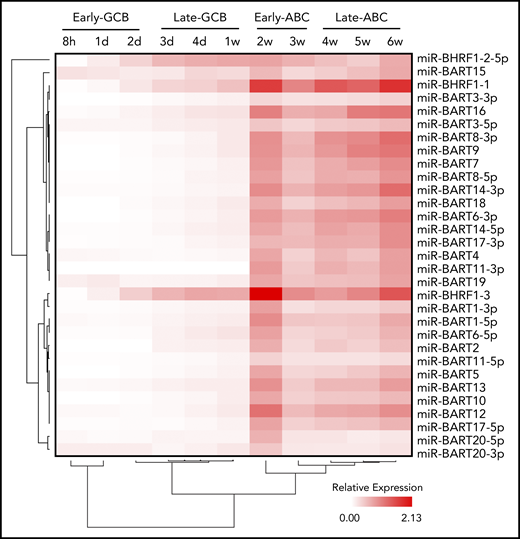
Time course of EBV miR expression. Heatmap representing EBV miR expression during the EBV model of B-cell differentiation (indicated above) as determined by qRT-PCR. Unsupervised hierarchical clustering is indicated by trees for miRs (left) and time points (below).
Time course of EBV miR expression. Heatmap representing EBV miR expression during the EBV model of B-cell differentiation (indicated above) as determined by qRT-PCR. Unsupervised hierarchical clustering is indicated by trees for miRs (left) and time points (below).
PD-L1 and PD-L2 protein expression rises between weeks 1 and 2 of the EBV model
Host miR-34a is capable of fine-tuning PD-L1 expression, notably miR-34a itself is regulated by EBNA2.52 To determine the kinetics of miR-34a in relation to EBV latency genes, we quantified miR-34a at serial time points in the EBV infection model by qRT-PCR (Figure 4A). This showed a steady increase in miR-34a during the early and late GCB phases. miR-34a expression reached a plateau in the early ABC phase, coincident with the peak in EBNA2.
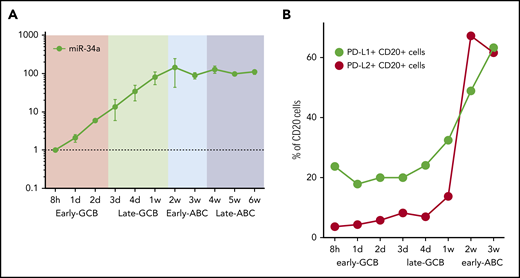
Time course of miR-34a and PD-L1 and PD-L2 protein expression in the EBV model. (A) miR-34a was serially quantified by qRT-PCR (relative to the 8-hour time point) during the EBV model. (B) PD-L1 and PD-L2 protein expression on CD20+ B cells during the time course of the EBV model of B-cell differentiation. After EBV WIL infection, PD-L1 and PD-L2 protein expression, measured by flow cytometry, rises, coincident with transition from the late GCB to early ABC phase. From 3 weeks onward, levels of PD-L1 and PD-L2 are maintained at stable levels (data not shown).
Time course of miR-34a and PD-L1 and PD-L2 protein expression in the EBV model. (A) miR-34a was serially quantified by qRT-PCR (relative to the 8-hour time point) during the EBV model. (B) PD-L1 and PD-L2 protein expression on CD20+ B cells during the time course of the EBV model of B-cell differentiation. After EBV WIL infection, PD-L1 and PD-L2 protein expression, measured by flow cytometry, rises, coincident with transition from the late GCB to early ABC phase. From 3 weeks onward, levels of PD-L1 and PD-L2 are maintained at stable levels (data not shown).
To establish the kinetics of PD-L1 and PD-L2 protein expression, serial quantification of these checkpoint ligands was performed by flow cytometry after infection with EBV WIL (Figure 4B). Levels increased markedly during the transition from the late GCB to early ABC phase, coincident with the observed increase in LMP1 gene expression, known to be a strong activator of PD-L1 and PD-L2 expression. From 3 weeks onward, levels of PD-L1 and PD-L2 remained stable.
Identification of putative EBV miR candidates that target the 3′UTR of PD-L1 and PD-L2
The 3′UTR sequences of the PD-L1 and PD-L2 genes were scanned for potential binding sites to EBV miRs using the miRanda program.53 Only 13 EBV miRs were found to have putative binding sites located on PD-L1 and/or PD-L2 (supplemental Table 2). Of these, only 2 miRs, EBV miR-BART19-3p and EBV miR-BHRF1-2-5p, had putative binding sites on both PD-L1 and PD-L2 genes.
EBV miR-BHRF1-2-5p is 22 nucleotides long and has 2 target sites for each gene (Figure 5), labeled PD-L1 sites 1 and 2 and PD-L2 sites 1 and 2, depending on the location of the proposed binding site in the relevant gene. The PD-L1 site 1 had the most complementary match, with a mismatch in the seed region (positions 2-8 nt in the 5′ end of the miR sequence) and additional compensatory binding (on the 3′ end of the miR sequence) between the miR and target sequence, and possessed the highest free energy score (−18.7 Kcal/mol) and 1 of the highest miRanda scores of all 6 sites. The remaining 3 EBV miR-BHRF1-2-5p sites (PD-L1 site 1, PD-L2 sites 1 and 2) all had strong complementary seed regions and also compensatory binding. EBV miR-BART19-3p is 21 nucleotides long and has 1 target site on each gene, named PD-L1 site 1 and PD-L2 site 1 (Figure 5). EBV miR-BART19-3p PD-L1 site 1 had a free energy score of −14.6 Kcal/mol, because it had a relatively strong seed region but lacked compensatory binding. miR-BART19-3p PD-L2 site 1, however, had quite poor seed region binding and bare compensatory binding, reflected in the lowest free energy score (−10.67 Kcal/mol) of all 6 potential binding sites (Figure 5). The strength of the predicted binding, as well as EBV miR-BHRF1-2-5p having 2 target sites on each gene, was an indicator that this miR was the more likely to effectively target PD-L1 and PD-L2 genes. Both EBV miR-BHRF1-2-5p and EBV miR-BART-19-3p were selected for further investigation.
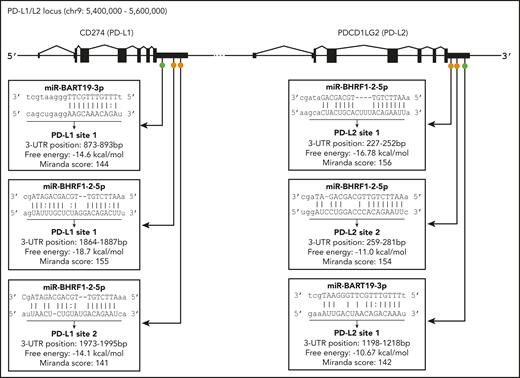
Location of predicted binding sites for EBV miR in the 3′UTRs of PD-L1 and PD-L2. Diagram indicates general location of 6 putative binding sites of EBV miR-BART19-3p and EBV miR-BHRF1-2-5p in the 3′UTRs of the PD-L1 and PD-L2 genes. On PD-L1, EBV miR-BART19-3p site 1 is closest to the 3′UTR, with EBV miR-BHRF1-2-5p ∼1800 nt downstream, possessing the highest free energy and score for this gene. For PD-L2, EBV miR-BHRF1-2-5p site 1 is closest to the 3′UTR and has the highest free energy and score for this gene. EBV miR-BHRF1-2-5p site 2 is only 7 nt downstream of site 1, and EBV miR-BART19-3p is the farthest away, being just under 1000 nt downstream of EBV miR-BHRF1-2-5p site 2.
Location of predicted binding sites for EBV miR in the 3′UTRs of PD-L1 and PD-L2. Diagram indicates general location of 6 putative binding sites of EBV miR-BART19-3p and EBV miR-BHRF1-2-5p in the 3′UTRs of the PD-L1 and PD-L2 genes. On PD-L1, EBV miR-BART19-3p site 1 is closest to the 3′UTR, with EBV miR-BHRF1-2-5p ∼1800 nt downstream, possessing the highest free energy and score for this gene. For PD-L2, EBV miR-BHRF1-2-5p site 1 is closest to the 3′UTR and has the highest free energy and score for this gene. EBV miR-BHRF1-2-5p site 2 is only 7 nt downstream of site 1, and EBV miR-BART19-3p is the farthest away, being just under 1000 nt downstream of EBV miR-BHRF1-2-5p site 2.
Validation of interaction between EBV miRs with PD-L1 and PD-L2
To validate the results obtained in the bioinformatic target prediction analysis, an integrated approach was used. Initially, binding of EBV miR-BHRF1-2-5p and EBV miR-BART-19-3p to the 3′UTRs of PD-L1 and PD-L2 was evaluated by a dual luciferase reporter assay.29 The 4 EBV miR-BHRF1-2-5p target sites and 2 EBV miR-BART-19-3p target sites were cloned into the 3′UTR of the reporter gene Renilla luciferase in the psiCHECK2 vector. HEK293T cells were then cotransfected with the vector and either EBV miR-BHRF1-2-5p, EBV miR-BART-19-3p, or Caenorhabditis elegans miR-67-5p (used as a negative control) mimics. The luciferase reporter assay (Figure 6A-D) showed that EBV miR-BHRF1-2-5p functionally binds to all 4 candidate miR target sites, PD-L1 sites 1 and 2 and PD-L2 sites 1 and 2, as evidenced by significant reduction in the expression of Renilla luciferase. However, EBV miR-BART-19-3p was not able to suppress the Renilla luciferase carrying the 2 candidate target sites: PD-L1 site 1 and PD-L2 site 1 (Figure 6E-F). Additional luciferase reporter assays to test the effect of EBV miR-BHRF1-2-5p inhibitor (rescue condition) confirmed that target transcripts carrying PD-L1 and PD-L2 binding sites are regulated by EBV miR-BHRF1-2-5p (supplemental Figure 2).
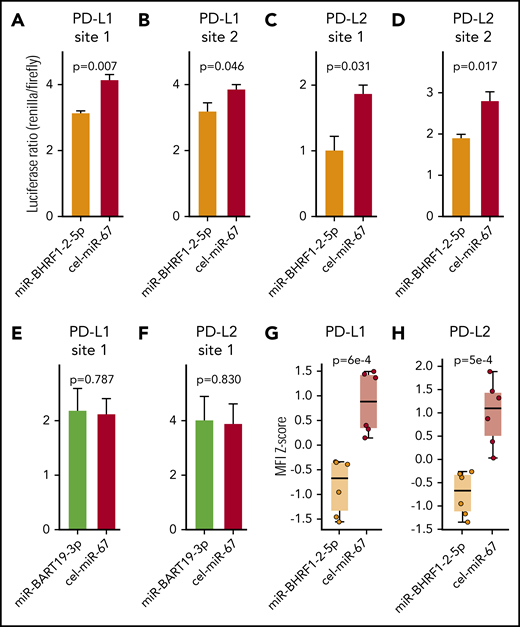
EBV miR-BHRF1-2-5p represses the expression of PD-L1 and PD-L2 by directly binding to target sites in the 3′UTRs of PD-L1 and PD-L2 transcripts. Dual luciferase reporter assays in HEK293 cells of EBV miR-BHRF1-2-5p target sites predicted in the 3′UTR of PD-L1, PD-L1 site 1 (A) and PD-L1 site 2 (B), and in the 3′UTR of PD-L2, PD-L2 site 1 (C) and PD-L2 site 2 (D). Luciferase reporter assays were also performed for EBV miR-BART19-3p target sites predicted in the 3′UTR of PD-L1, PD-L1 site 1 (E) and PD-L2 site 2 (F). Renilla luciferase is the reporter gene with the candidate miR binding site cloned in its 3′UTR, and firefly luciferase is used as normalizer constitutively expressed by the same vector. A decrease in the luciferase ratio is indicative of an effective functional binding of the miR to its target site. All 4 EBV miR-BHRF1-2-5p target sites contribute to the downregulation of Renilla luciferase by synthetic EBV miR-BHRF1-2-5p mimic treatment compared with a control miR mimic based on Caenorhabditis elegans miR-67 (cel-miR-67), whereas EBV miR-BART19-3p mimics have no significant effect over the predicted binding sites in the 3′UTRs of PD-L1 and PD-L2. EBV WIL LCLs were treated with EBV miR-BHRF1-2-5p or cel-miR-67 (control) mimics, and PD-L1 and PD-L2 protein levels were quantified by flow cytometry. Results of 2 independent experiments were combined to quantify PD-L1 (G) and PD-L2 (H) protein levels at 8 and 24 hours after miR mimic treatment. Welch’s 2-sample t test was used for statistical analysis. MFI, mean fluorescence intensity.
EBV miR-BHRF1-2-5p represses the expression of PD-L1 and PD-L2 by directly binding to target sites in the 3′UTRs of PD-L1 and PD-L2 transcripts. Dual luciferase reporter assays in HEK293 cells of EBV miR-BHRF1-2-5p target sites predicted in the 3′UTR of PD-L1, PD-L1 site 1 (A) and PD-L1 site 2 (B), and in the 3′UTR of PD-L2, PD-L2 site 1 (C) and PD-L2 site 2 (D). Luciferase reporter assays were also performed for EBV miR-BART19-3p target sites predicted in the 3′UTR of PD-L1, PD-L1 site 1 (E) and PD-L2 site 2 (F). Renilla luciferase is the reporter gene with the candidate miR binding site cloned in its 3′UTR, and firefly luciferase is used as normalizer constitutively expressed by the same vector. A decrease in the luciferase ratio is indicative of an effective functional binding of the miR to its target site. All 4 EBV miR-BHRF1-2-5p target sites contribute to the downregulation of Renilla luciferase by synthetic EBV miR-BHRF1-2-5p mimic treatment compared with a control miR mimic based on Caenorhabditis elegans miR-67 (cel-miR-67), whereas EBV miR-BART19-3p mimics have no significant effect over the predicted binding sites in the 3′UTRs of PD-L1 and PD-L2. EBV WIL LCLs were treated with EBV miR-BHRF1-2-5p or cel-miR-67 (control) mimics, and PD-L1 and PD-L2 protein levels were quantified by flow cytometry. Results of 2 independent experiments were combined to quantify PD-L1 (G) and PD-L2 (H) protein levels at 8 and 24 hours after miR mimic treatment. Welch’s 2-sample t test was used for statistical analysis. MFI, mean fluorescence intensity.
Next, EBV miR-BHRF1-2-5p was tested for its ability to functionally decrease PD-L1 and PD-L2 protein expression using an EBV-WIL LCL transfected with EBV miR-BHRF1-2-5p mimics (Figure 6G-H; supplemental Figure 3). Flow cytometry showed PD-L1 and PD-L2 expression in EBV WIL LCLs treated with miR-BHRF1-2-5p mimics was significantly reduced when compared with control cel-miR-67 mimics (Figure 6G-H). To test the role of miR-BHRF1-2-5p in a different viral strain, we performed a similar miR mimic assay using the EBV B95-8 LCL (known to lack a majority of miR BARTs) established from the same healthy donor. This confirmed downregulation of PD-L1 and PD-L2 protein expression in the EBV B95-8 LCL when treated with miR-BHRF1-2-5p mimic (supplemental Figure 4A-B). We also performed a rescue assay with the EBV B95-8 LCL and found the effect of miR-BHRF1-2-5p mimics upon PD-L1 (but not PD-L2) expression could be reversed by anti–miR-BHRF1-2-5p (rescue condition) compared with anti–miR control (negative control), although only a partial rescue of PD-L2 expression was noted (supplemental Figure 4C-D). The cumulative evidence confirms that miR-BHRF1-2-5p is an important miR regulator of PD-L1 and PD-L2 for both viral strains (Figure 6G-H; supplemental Figures 3 and 4).
EBV miR-BHRF1-2-5p expression in the context of DLBCL and EBV+ PTLD
To establish whether miR-BHRF1-2-5p expression varied by COO, we applied the Lymph2Cx Nanostring assay to 6 primary EBV+ DLBCL tissue samples and also 18 spontaneous LCLs derived from an EBV+ posttransplantation lymphoproliferative disorder (PTLD) patient’s normal B cells generated by spontaneous infection with wild-type virus found from the patient (supplemental Figure 5). Results show that miR-BHRF1-2-5p is typically expressed, but expression levels are highly variable, and do not vary according to COO.
In EBV+ lymphomas, prior evidence indicates that LMP1 is the principal driver of PD-L1 expression. In contrast, microRNAs are known to be fine-tuners of gene expression. In keeping with this, we observed a very strong correlation between PD-L1 and LMP1 gene expression (Spearman R = 0.94; P = .008), whereas there was no correlation between miR-34a and miR-BHRF1-2-5p (Spearman R = 0.6; P = .09) in the 6 EBV+ DLBCL tissue samples. Sanger sequencing of the regions containing the putative binding sites for BHRF1-2-5p in the 3′UTRs of PD-L1 and PD-L2 in the 6 patient EBV+ DLBCL tissues found no deletions.
Discussion
In this study, we established and interrogated an in vitro model of EBV-driven B-cell differentiation that recapitulated important aspects of EBV+ DLBCL biology. The model characterized the kinetics of immune checkpoint ligands (PD-L1 and PD-L2) and relevant viral gene, EBV miR, and host miR expression in relation to the phases of the COO. Coordinated host gene expression was observed in discrete early and late GCB and ABC phases, each exhibiting distinct expression profiles resembling components of the GC reaction. EBV miR-BHRF1-2-5p showed a distinct expression profile, clustering separately from other EBV miRs. Bioinformatic prediction, together with functional validation, showed EBV miR-BHRF1-2-5p bound to PD-L1 and PD-L2 3′UTRs, and its ability to reduce PD-L1 and PD-L2 surface protein expression was confirmed.
LMP1 emulates CD40 signaling to activate B cells54 and is also known to upregulate PD-L1 mediated by JAK/STAT-dependent promoter and AP-1 associated enhancer activity.14,55 Its expression rose during the late GCB phase, immediately preceding upregulation of PD-L1 and PD-L2 (which occurred during transition from the late GCB to early ABC phase). Binding of EBV miR-BHRF1-2-5p to 2 binding sites within the 3′UTRs of both PD-L1 and PD-L2 was identified and validated. The regulatory effect of each site was tested individually, but it is possible that for both PD-L1 and PD-L2, binding to both sites occurs in vivo. The ability of EBV miR-BHRF1-2-5p to reduce PD-L1 and PD-L2 surface protein expression was confirmed in both EBV-WIL and EBV B95-8 LCLs. Together, the data indicate EBV miR-BHRF1-2-5p is an important viral miR in the fine-tuning regulation of these immune checkpoint inhibitors. However, 3′UTRs can be targeted by multiple miRs, and the data do not rule out the contribution of other EBV miRs (including BART miRs) to the fine-tuning of PD-L1 and PD-L2 expression. Also, we cannot rule out the possibility that the enrichment of 3′UTR truncations in these ligands seen in EBV+ DLBCL13 may be in part an adaptation to circumvent EBV miR-BHRF1-2-5p–mediated PD-L1 and PD-L2 regulation. Although we did not observe 3′UTR truncations in our 6 primary DLBCL samples, a larger series is required to test whether there is a concomitant relationship between 3′UTR truncations and EBV miR-BHRF1-2-5p expression. Alternatively, it maybe that EBV miR-BHRF1-2-5p represents a distinct mechanism of PD-L1/L2 regulation that occurs independently of 3′UTR truncations.
PD-L1 is also known to be regulated by miR-34a, which is itself regulated by EBNA2,15 leading us to quantify the kinetics of this host miR in the EBV model. This showed there was a steady increase in miR-34a during the early and late GCB phases. Consistent with the known role of EBNA2 in regulating miR-34a,15 miR-34a expression reached a plateau in the early ABC phase, coincident with the peak in EBNA2 levels.
It is postulated that EBV+ DLBCL has a tolerogenic tumor microenvironment that promotes immune escape,27,56 much as iatrogenic immunosuppression does in EBV+ PTLD.57,58 In keeping with this, although substantially higher clonal T-cell responses are observed in EBV+ DLBCL vs DLBCL NOS,59 EBV+ DLBCL biopsies are associated with high levels of PD-L1 and PD-L2.60 In EBV+ lymphomas, PD-L1 is inducible by EBV LMP1.14 This translates into increased tumor cell surface expression of PD-L1 protein, with high frequency of PD-L1 overexpression in EBV+ DLBCL and EBV+ PTLD, associated with EBV latency 2 and 3 and non-GCB COO subtype DLBCL.61,62 Analysis of human EBV+ DLBCL biopsies indicate that the antigen-presenting machinery is typically intact, and polymorphisms in functionally defined CD8+ T-cell epitope–encoding regions are rare,63 making this an attractive immunotherapy target.5 In vitro experiments indicate that PD-1 blockade is more effective in inducing antitumor immunity in EBV+ DLBCL than DLBCL NOS,64 and PD-1 blockade inhibits EBV+ lymphoma in humanized mice.65 Collectively, this suggests that EBV+ lymphomas may be specifically vulnerable to strategies that interfere with the PD-1/PD-L1/PD-L2 axis.66 Therefore, a greater understanding of the molecular basis that underpins the regulation of PD-L1 and PD-L2 expression may identify new therapeutic avenues.
Although EBV is believed to encode more miRs than any other human virus,67 to date EBV miRs that target these regions have not been identified. EBV miRs are located in 2 distinct clusters: near the mRNA of the BHRF1 gene and in intronic regions of BART. EBV miRs are differentially expressed in lymphoid cells under different virus latency programs. The EBV BHRF1 miRs are expressed at low levels in latency 1 EBV+ Burkitt lymphoma but have high levels in LCLs and in the viral lytic cycle.16,68,69 These miRs are expressed from the EBNA-LP transcript that is initiated from the Wp or Cp promoters. Primary EBV miR-BHRF1-2 stem loops are also present in the 3′UTR of EBNA-LP, and their presence stabilizes expression of EBNA-LP mRNA. The expression of EBV miR-BHRF1-2-5p occurred after Wp and Cp initiation and followed the same kinetics as LMP1, which rose during the late GCB phase immediately preceding upregulation of PD-L1 and PD-L2 (which occurred during transition from the late GCB to early ABC phase). One interpretation is that EBV miR-BHRF1-2-5p plays a context-dependent counterregulatory role, which is to fine-tune the expression of the LMP1-driven amplification of these inhibitory checkpoint ligands. Specifically, the concomitant rise in LMP1 might overrule the inhibitory effect of miR-BHRF1-2-5p (and miR-34a), illustrating that the role of these miRs is to fine-tune rather than downregulate PD-L1 and PD-L2.
miRs can have multiple targets as a result of binding not requiring 100% complementarity.70 EBV miR-BHRF1-2-5p inhibits the MALT1 gene, which is a known regulator of immune homeostasis,71 as well as the B-cell differentiation regulator/tumor suppressor gene PRDM1/BLIMP1,72 but it was not previously known to bind PD-L1 or PD-L2. Using an integrated approach, we predicted and subsequently validated the interaction between EBV miR-BHRF1-2-5p with the 3′UTRs of both PD-L1 and PD-L2. Its ability to reduce PD-L1 and PD-L2 protein expression in LCLs was then confirmed. Results indicate a novel mechanism by which EBV fine-tunes the expression of these immune checkpoint ligands. Additionally non-3′UTR mRNA regions can also potentially bind miRs, and individual mRNAs can be affected by multiple miRs.67 Therefore, it is likely that there are additional viral and host miRs that also target ≥1 of these checkpoint ligands. Their identification may enable potential novel RNA-based therapies to emerge.
The online version of this article contains a data supplement.
The publication costs of this article were defrayed in part by page charge payment. Therefore, and solely to indicate this fact, this article is hereby marked “advertisement” in accordance with 18 USC section 1734.
Acknowledgments
A.S.C. and M.K.G. were supported by a grant from the Metro South Health Research Support Scheme Study, Education and Research Trust; C.K. received support from the Australian National Health and Medical Research Council; and M.K.G. received support from the Leukaemia Foundation and the Mater Foundation. The Translational Research Institute is supported by the Australian Government.
Authorship
Contribution: A.S.C. and J.N. designed assays, performed data analysis, and cowrote the manuscript; R.A.W., M.B.S., S.C.L., F.V., J.G., S.M., G.T., C.S., M.G., and C.K. performed assays and/or assisted with data analysis; M.K.G. conceived and oversaw the project and cowrote the manuscript; and all authors approved the final version.
Conflict-of-interest disclosure: The authors declare no competing financial interests.
Correspondence: Alexandre S. Cristino, Griffith Institute for Drug Discovery, Brisbane, 4111, QLD, Australia; e-mail: a.cristino@griffith.edu.au; and Maher K. Gandhi, Mater Research, University of Queensland, Translational Research Institute, Brisbane, 4102, QLD, Australia; e-mail: maher.gandhi@mater.uq.edu.au.
