

Key Points
cHL is enriched for CTLA-4–positive T cells that lack PD-1 and engage HRS cells and HRS-associated macrophages expressing CD86.
The CTLA-4:CD86 signaling network is distinct from PD-1:PD-1 ligand signaling network and a rational target for immunotherapy in cHL.

Abstract
Classic Hodgkin lymphoma (cHL) is a tumor composed of rare, atypical, germinal center–derived B cells (Hodgkin Reed-Sternberg [HRS] cells) embedded within a robust but ineffective inflammatory milieu. The cHL tumor microenvironment (TME) is compartmentalized into “niches” rich in programmed cell death-1 ligand (PD-L1)–positive HRS cells and tumor-associated macrophages (TAMs), which associate with PD-1–positive T cells to suppress antitumor immunity via PD-L1/PD-1 signaling. Despite the exquisite sensitivity of cHL to PD-1 checkpoint blockade, most patients eventually relapse and need therapeutic alternatives. Using multiplex immunofluorescence microscopy with digital image analysis, we found that cHL is highly enriched for non–T-regulatory, cytotoxic T-lymphocyte-associated protein 4 (CTLA-4)–positive T cells (compared with reactive lymphoid tissues) that outnumber PD-1–positive and lymphocyte-activating gene-3 (LAG-3)–positive T cells. In addition, T cells touching HRS cells are more frequently positive for CTLA-4 than for PD-1 or LAG-3. We further found that HRS cells, and a subset of TAMs, are positive for the CTLA-4 ligand CD86 and that the fractions of T cells and TAMs that are CTLA-4–positive and CD86-positive, respectively, are greater within a 75 μm HRS cell niche relative to areas outside this region (CTLA-4, 38% vs 18% [P = .0001]; CD86, 38% vs 24% [P = .0007]). Importantly, CTLA-4–positive cells are present, and focally contact HRS cells, in recurrent cHL tumors following a variety of therapies, including PD-1 blockade. These results implicate CTLA-4:CD86 interactions as a component of the immunologically privileged niche surrounding HRS cells and raise the possibility that patients with cHL refractory to PD-1 blockade may benefit from CTLA-4 blockade.
Introduction
Classic Hodgkin lymphoma (cHL) is a unique lymphoid malignancy. It is composed of rare (1%-5% of total cellularity) atypical germinal center–derived B cells (Hodgkin Reed-Sternberg [HRS] cells) embedded within an ineffective tumor microenvironment (TME) that includes macrophages, T cells, B cells, plasma cells, eosinophils, and additional immune cells.1 We, and others, have identified mechanisms by which HRS cells evade antitumor immunity, including gains of chromosome 9p24.1, encompassing PDL1/PDL2/JAK2, and augmented JAK-STAT signaling. Together, these factors drive expression of programmed cell death-1 ligands (PD-L1 and PD-L2) that bind PD-1 (CD279) on the surface of antigen-experienced T cells, diminishing their activity.2,3 cHLs also have reduced or absent expression of β2-microglobulin/major histocompatibility complex (MHC) class I and/or MHC class II molecules, preventing recognition by the adaptive immune response.4 In addition, tumor-associated macrophages (TAMs) in the cHL TME often express PD-L1, which increases the total pool of available PD-1 ligand.5 More recently, we used multiplex immunofluorescence microscopy and digital image analysis to examine the topography of cHL and defined a microenvironmental niche composed of PD-L1–positive TAMs and PD-1/CD4–positive T cells that encircle PD-L1–positive HRS cells.6
Patients with cHL are exquisitely sensitive to PD-1 blockade. Pilot studies of the PD-1– blocking antibodies pembrolizumab and nivolumab, in patients with relapsed and/or refractory disease, had objective response rates (ORRs) of 65% and 87%, respectively.7-10 Subsequent phase 2 trials confirmed the high ORRs and highlighted the potential durability of responses to anti–PD-1 therapy, with a median duration of response of 16.6 months and median progression-free survival of 14.7 months for nivolumab.8-10 Based on these results, both agents have been approved by the US Food and Drug Administration for the treatment of patients with relapsed and/or refractory cHL. More recently, the combination of nivolumab with adriamycin, vinblastine, and dacarbazine was tested in patients with newly diagnosed, advanced-stage disease and was found to be highly effective, with an ORR of 87% and a complete response rate of 67%.11 Together, the results of these and other trials have established that cHL has the highest sensitivity to PD-1 blockade of any reported tumor type.12
Despite the clear efficacy of antibody-mediated PD-1 blockade, this approach is not curative for the majority of patients, and most will progress while on therapy or after treatment.7-10,13 Additional approaches and effective combination therapies are therefore needed. Cytotoxic T-lymphocyte–associated protein 4 (CTLA-4) and lymphocyte-activating gene-3 (LAG-3) are 2 other immune checkpoints that could serve as therapeutic targets, as they similarly diminish T-cell activity upon engagement of their cognate ligands, CD80 (B7.1)/CD86 (B7.2) or MHC class II/fibrinogen-like protein I, respectively.14-17 Thus far, only one small study has considered the combination of CTLA-4 and PD-1 blockade in cHL, and the results did not identify a clear added benefit of dual therapy; however, anti–CTLA-4 monotherapy in anti–PD-1 refractory patients has not yet been formally evaluated.18 The current study further explored the topography of the TME in cHL, focusing specifically on the immune checkpoints CTLA-4 and LAG-3, relative to PD-1.
Methods
Tissue samples
Formalin-fixed, paraffin-embedded excisional biopsy specimens from newly diagnosed, untreated cHL tumors were derived from the archives of Brigham and Women’s Hospital, (Boston, MA) with institutional review board approval (2010P002736). Hematoxylin and eosin–stained tissue sections, as well as the original diagnostic reports, were reviewed by 2 board-certified hematopathologists (S.S.P. and S.J.R.). Twenty cases were selected for the study, based on the availability of high-quality, whole lymph node excisional biopsy tissue; this cohort is distinct from that used previously by our group.6 These samples included 13 nodular sclerosis, 4 mixed cellularity, 1 lymphocyte-rich, 1 lymphocyte-depleted, 1 with indeterminate morphology, and 3 Epstein-Barr virus–positive cases (supplemental Table 1, available on the Blood Web site). In addition, a separate cohort of recurrent cHL biopsy tissues (n = 18) was used for limited analyses. These included 9 after anti–PD-1 therapy; 4 after doxorubicin, bleomycin, vinblastine, and dacarbazine (ABVD) therapy; and 5 after stem cell transplantation (SCT).
Multiplexed immunofluorescence
Multiplexed immunofluorescence (mIF) was performed by staining 4-μm-thick formalin-fixed, paraffin-embedded whole-tissue sections in a Bond RX automated stainer (Leica Biosystems, Buffalo Grove, IL), using published protocols.6 Three major panels of primary antibody/fluorophore pairs were applied to the cases: (1) “CTLA-4 panel” (anti-PAX5, anti-CD4, anti-CD8, anti–CTLA-4, anti–PD-1, and anti-FOXP3; n = 20); (2) “checkpoint panel” (anti-PAX5, anti-CD3, anti–CTLA-4, anti–PD-1, and anti–LAG-3; n = 18); and (3) “CD86 panel” (anti-PAX5, anti-CD86, and anti–CTLA-4; n = 18). An additional PD-L1–inclusive panel (PAX5, CD68, CD86, and PD-L1) was performed on a subset of cases (n = 12). The CTLA-4 panel was also applied to 9 reactive lymphoid tissues (RLTs), including 6 lymph nodes (RLNs) and 3 tonsils (TSs); a slightly modified CD86 panel (with the addition of an anti-CD68 antibody) was also evaluated in a subset of cases (n = 15). An additional CD28-inclusive panel (PAX5, CD3, CD28, CTLA-4, CD86, and FOXP3) was evaluated in a subset of cases (n = 10). The original checkpoint and CD86 panels were applied to posttherapy biopsy samples (n = 18). Details regarding the staining panels and all antibodies (n = 13) used are provided in supplemental Tables 2 and 3.
Image acquisition
For each slide stained with either the CTLA-4 or checkpoint panels, 3 representative regions of interest (areas enriched for HRS cells) were captured at 20× resolution as multispectral images by using the Mantra Quantitative Pathology Workstation (Akoya Biosciences, Hopkinton, MA). For the stained reactive tissues (RLTs), T-cell–rich interfollicular zones were specifically captured as regions of interest. In addition, 2 geographically distinct regions were selected for each tumor stained with the CTLA-4 and CD86 panels (original and modified) to best represent the overall tissue TME and to include weakly PAX5-positive HRS tumor cells. These regions were imaged by using the Vectra multispectral imaging platform (Vectra 3; Akoya Biosciences), and 4 tiled fields of view were acquired at 20× resolution. Areas with nontumor or residual normal tissue (ie, residual lymph node) were excluded.
Cell identification
After image capture, the fields of view were spectrally unmixed and analyzed by using supervised machine-learning algorithms within inForm 2.4.2 (Akoya Biosciences); this software assigns phenotypes to all cells in the image according to a combination of mIF characteristics associated with segmented nuclei (4′,6-diamidino-2-phenylindole signal). Each cell phenotype–specific algorithm is based on an iterative training/test process, whereby a small number of cells (training phase, typically 15-20 cells) are manually selected by the pathologist as being most representative of each phenotype of interest, and the algorithm then predicts the phenotype for all remaining cells (testing phase).19 The decisions made by the software can be overruled to improve accuracy until phenotyping is optimized. Unique phenotyping was performed by using each mIF panel, for each tumor, and then applied to individually captured study images (Mantra). A similar process was separately performed for tiled study images (Vectra) to account for intersample variability of signal intensities. The Mantra system uses manually driven image capture of regions of interest, and the Vectra system additionally enables automated capture of contiguous regions of interest to produce tiled images. Thresholds for “positive” staining and the accuracy of phenotypic algorithms were confirmed by the pathologists (S.S.P. and S.J.R.) for each case. inForm automatically derives maps of cell membranes and Cartesian coordinates for each phenotyped cell within the image.
Quantification of the microenvironment
Quantities, spatial attributes, and graphical abstractions were generated from inForm-exported images and metadata by our image analysis pipeline, which extends our previously reported methods6 (available at https://github.com/jason-weirather/pythologist). Physical contacts between HRS cells and neighboring cells were determined on the basis of the membrane maps produced by inForm; the percentages of each cell phenotype among cells in contact with HRS cells were measured on a per-case basis (eg, percent CTLA-4–positive, PD-1–positive, and/or LAG-3–positive T cells). We also calculated the percentages of populations that were within the immediate vicinity (75 µm) of HRS cells, based on the Euclidean distance to the nearest HRS cell; this distance is derived from the inForm-provided coordinates and cell phenotypes.
Hypothesis testing was conducted by using 2-tailed nonparametric testing. Differences in quantities of cell phenotype–count densities or cell phenotype proportions between cHL cases and reactive tissues were tested by using a 2-tailed Mann-Whitney U test. Differences between cell phenotype proportions or mean marker intensities paired according to case were tested by using a 2-tailed Wilcoxon signed-rank test. All data outputs are provided parenthetically as median values (across analyzed cases) followed by full ranges, unless otherwise stated.
Results
CTLA-4 is a predominant checkpoint protein expressed on T cells within the cHL TME
Sequential mIF staining of 20 cases of cHL revealed the expected patterns of cellular staining, with weak PAX5 positivity delineating cells morphologically consistent with HRS cells (Figure 1A). The number, distribution, and morphology of PAX5-positive HRS cells observed with mIF were indistinguishable from those observed with chromogenic immunohistochemistry (IHC). A machine-learning algorithm trained on the morphological and staining characteristics of selected PAX5-dim HRS cells identified the tumor cells accurately, as judged by visual review, and distinguished them from small, PAX5-bright B cells (Figure 1B). Immunofluorescence staining for CTLA-4 in the cHL study cases revealed an abundance of CTLA-4–positive cells, which were morphologically consistent with lymphocytes and visually appeared more numerous in the vicinity of HRS cells than in the interfollicular T-cell–rich zones of RLTs (Figure 1C-D). A comparison of mIF and chromogenic IHC staining for CTLA-4 revealed no significant differences in the quality or quantity of CTLA-4–positive cells within the cHL TME (supplemental Figure 1A-C). The processed outputs of the mIF imaging data confirmed that the densities of both CD4-positive/CTLA-4–positive (median, 1243 cells/mm2 vs 135 cells/mm2; P = .0004) and CD8-positive/CTLA-4–positive (median, 113 cells/mm2 vs 22 cells/mm2; P = .02) cells were greater in the cHLs than in the RLTs (Figure 1E). In addition, the CTLA-4–positive fraction of total CD4-positive and CD8-positive T cells was greater in cHLs (median, 32%; range, 6%-87%) compared with RLTs (median, 2%; range, 0.4%-5%) (cHL vs RLT, P = .00001) (Figure 1F). Studies of solid tumor and mouse models have suggested that CTLA-4 selectively marks FOXP3-positive regulatory T cells (Tregs).20,21 In our series, the density of CD4/CTLA-4/FOXP3-positive cells was greater in cHLs relative to RLTs (median, 260 cells/mm2 vs 14 cells/mm2; P = .003) (Figure 1G). However, we found that the FOXP3-positive fraction of CTLA-4–positive T cells was a minority of the total CTLA-4–positive T cells in cHL (median fraction for the series, 25%; range, 0.07%-66%) and was comparable to the FOXP3-positive fraction of CTLA-4–positive T cells in RLTs (median, 31%; range, 0.15%-68%; cHL vs RLT, P > .05) (Figure 1H).
![CTLA-4–positive T cells are enriched in cHL. (A-B) Representative mIF image of cHL (CHL9) [inset: CTLA-4–positive cells in contact with PAX5-positive HRS cells] and the cell segmentation and phenotype map for the same image (panel B) [purple, HRS; green, CTLA-4–positive/FOXP3-negative; red, CTLA-4–negative/FOXP3-positive; yellow, CTLA-4–positive/FOXP3-positive; dark gray, “other” cell]. (C-D) mIF image of interfollicular zone from representative RLT [inset: rare CTLA-4–positive/FOXP3-positive cells] and the cell segmentation and phenotype map for the same image (panel D) [green, CTLA-4–positive/FOXP3-negative; red, CTLA-4–negative/FOXP3-positive; yellow, CTLA-4–positive/FOXP3-positive; dark gray, “other” cell]. (E) The densities of CTLA-4–positive/CD4-positive (median, 1243 cells/mm2 vs 135 cells/mm2; P = .0004) and CTLA-4–positive/CD8-positive (median, 113 cells/mm2 vs 22 cells/mm2; P = .02) cells are greater in cHL than in RLTs. Each dot corresponds to the results of an individual case. (F) CTLA-4–positive fraction of total T cells (CD4-positive plus CD8-positive cells) is greater in cHL (32%; 6%-87%) compared with RLTs (2%; 0.4%-5%) [cHL vs RLT, P = .0002]. (G) The density of CTLA-4–positive/CD4-positive/FOXP3-positive cells is greater in cHL relative to RLT (median, 260 cells/mm2 vs 14 cells/mm2; P = .0032), whereas there is no significant difference in the density of CD8-positive/CTLA-4–positive/FOXP3-positive cells between groups (median, 11 cells/mm2 vs 9 cells/mm2; P > .05). Each dot corresponds to the results of an individual case. (H) FOXP3-positive fraction of total CTLA-4–positive T cells in cHL (25%; 0.07%-66%) and RLTs (31%; 0.15%-68%) [cHL vs RLT, P > .05]. Epstein-Barr virus (EBV)-positive cases are marked by asterisks. DAPI, 4′,6-diamidino-2-phenylindole; RLN, reactive lymph node; TS, tonsil.](https://ash.silverchair-cdn.com/ash/content_public/journal/blood/134/23/10.1182_blood.2019002206/4/m_bloodbld2019002206f1.png?Expires=1769196321&Signature=cHkNjv~v4ls4ES1bAe~R1Zh-cYEGrn5vUpkifvInzBvP1ltKNda31TYu7Qk-QaMk2IWri~SZTdpE0TNE736RHFMc4xyY-h9ajIy6S3ugiIVZyT~SD10-IcVtjVXnbQHBY7Q0G~JGJ4lCD3wVmEW6y4GMCBpl5Cyi~MWIXXnw5H4Jbw4NzePmxlAT8DZNDcsJz09uAFAMbkEyLbinRxY9g~xLSt68x0-MINRMvhE28avwsrzEIosjEtcFikf110ZfbJ3ph7ktkgAXt1HC8ez32N7jJUiKmVciH9CcmdMHU0Qy0e~yeKISSFGQIbkq2mgiaVLGGSHn1AKIEuWSqOBuDQ__&Key-Pair-Id=APKAIE5G5CRDK6RD3PGA)
CTLA-4–positive T cells are enriched in cHL. (A-B) Representative mIF image of cHL (CHL9) [inset: CTLA-4–positive cells in contact with PAX5-positive HRS cells] and the cell segmentation and phenotype map for the same image (panel B) [purple, HRS; green, CTLA-4–positive/FOXP3-negative; red, CTLA-4–negative/FOXP3-positive; yellow, CTLA-4–positive/FOXP3-positive; dark gray, “other” cell]. (C-D) mIF image of interfollicular zone from representative RLT [inset: rare CTLA-4–positive/FOXP3-positive cells] and the cell segmentation and phenotype map for the same image (panel D) [green, CTLA-4–positive/FOXP3-negative; red, CTLA-4–negative/FOXP3-positive; yellow, CTLA-4–positive/FOXP3-positive; dark gray, “other” cell]. (E) The densities of CTLA-4–positive/CD4-positive (median, 1243 cells/mm2 vs 135 cells/mm2; P = .0004) and CTLA-4–positive/CD8-positive (median, 113 cells/mm2 vs 22 cells/mm2; P = .02) cells are greater in cHL than in RLTs. Each dot corresponds to the results of an individual case. (F) CTLA-4–positive fraction of total T cells (CD4-positive plus CD8-positive cells) is greater in cHL (32%; 6%-87%) compared with RLTs (2%; 0.4%-5%) [cHL vs RLT, P = .0002]. (G) The density of CTLA-4–positive/CD4-positive/FOXP3-positive cells is greater in cHL relative to RLT (median, 260 cells/mm2 vs 14 cells/mm2; P = .0032), whereas there is no significant difference in the density of CD8-positive/CTLA-4–positive/FOXP3-positive cells between groups (median, 11 cells/mm2 vs 9 cells/mm2; P > .05). Each dot corresponds to the results of an individual case. (H) FOXP3-positive fraction of total CTLA-4–positive T cells in cHL (25%; 0.07%-66%) and RLTs (31%; 0.15%-68%) [cHL vs RLT, P > .05]. Epstein-Barr virus (EBV)-positive cases are marked by asterisks. DAPI, 4′,6-diamidino-2-phenylindole; RLN, reactive lymph node; TS, tonsil.
CTLA-4–positive T cells are enriched in cHL. (A-B) Representative mIF image of cHL (CHL9) [inset: CTLA-4–positive cells in contact with PAX5-positive HRS cells] and the cell segmentation and phenotype map for the same image (panel B) [purple, HRS; green, CTLA-4–positive/FOXP3-negative; red, CTLA-4–negative/FOXP3-positive; yellow, CTLA-4–positive/FOXP3-positive; dark gray, “other” cell]. (C-D) mIF image of interfollicular zone from representative RLT [inset: rare CTLA-4–positive/FOXP3-positive cells] and the cell segmentation and phenotype map for the same image (panel D) [green, CTLA-4–positive/FOXP3-negative; red, CTLA-4–negative/FOXP3-positive; yellow, CTLA-4–positive/FOXP3-positive; dark gray, “other” cell]. (E) The densities of CTLA-4–positive/CD4-positive (median, 1243 cells/mm2 vs 135 cells/mm2; P = .0004) and CTLA-4–positive/CD8-positive (median, 113 cells/mm2 vs 22 cells/mm2; P = .02) cells are greater in cHL than in RLTs. Each dot corresponds to the results of an individual case. (F) CTLA-4–positive fraction of total T cells (CD4-positive plus CD8-positive cells) is greater in cHL (32%; 6%-87%) compared with RLTs (2%; 0.4%-5%) [cHL vs RLT, P = .0002]. (G) The density of CTLA-4–positive/CD4-positive/FOXP3-positive cells is greater in cHL relative to RLT (median, 260 cells/mm2 vs 14 cells/mm2; P = .0032), whereas there is no significant difference in the density of CD8-positive/CTLA-4–positive/FOXP3-positive cells between groups (median, 11 cells/mm2 vs 9 cells/mm2; P > .05). Each dot corresponds to the results of an individual case. (H) FOXP3-positive fraction of total CTLA-4–positive T cells in cHL (25%; 0.07%-66%) and RLTs (31%; 0.15%-68%) [cHL vs RLT, P > .05]. Epstein-Barr virus (EBV)-positive cases are marked by asterisks. DAPI, 4′,6-diamidino-2-phenylindole; RLN, reactive lymph node; TS, tonsil.
Given the known interplay between CTLA-4 and the T-cell costimulatory receptor CD28, we evaluated their coexpression in a subset of cases (n = 10). Most CTLA-4-positive T-cells expressed CD28 (supplemental Figure 2A-C). Pooled CTLA-4–positive T-cell counts (26 691 T cells) across analyzed cases (n = 10) revealed that CD28-positive/FOXP3-negative cells (13 921 [52%]) outnumbered the CD28-positive/FOXP3-positive (4414 [17%]), CD28-negative/FOXP3-positive (965 [3.6%]), and CD28-negative/FOXP3-negative (7391 [28%]) populations (supplemental Figure 2A-D). The CD28-positive fraction of CTLA-4–positive T cells did not differ with respect to FOXP3 expression (P > .05) (supplemental Figure 2E). Previous studies into the mechanisms underlying the CD28/CTLA-4–to–CD80/CD86 axes have shown that CTLA-4 interacts with both of the cognate ligands it shares with CD28 with a higher affinity and avidity.22-24
Relationships between, and localization of, CTLA-4–, PD-1–, and LAG-3–positive cells
Visual inspection of stained tissue sections suggested an abundance, and mutual exclusivity, of CTLA-4–positive lymphocytes relative to PD-1 and/or LAG-3–positive lymphocytes (Figure 2A). Cell phenotyping and quantitation (Figure 2B) revealed that, across the entire cohort, total CTLA-4–positive T cells (46 981) outnumbered PD-1–positive (26 256) and LAG-3–positive (22 061) T cells, and that 25% of total T cells were CTLA-4–positive and PD-1/LAG-3–negative (Figure 2C). Overall, the fraction of CTLA-4–positive cells expressing another checkpoint protein (27%; 5%-58%; P = .0004) was significantly lower than that for PD-1 (42%; 11%-73%; P > .05) or LAG-3 (51%; 16%-80%; P > .05) (supplemental Figure 3).
![CTLA-4 is the predominant checkpoint on T cells in cHL, which are frequently negative for either PD-1 or LAG-3 and are often in direct contact with HRS cells. (A-B) Representative case of cHL (CHL5) including full field view (panel A) following cell segmentation and phenotyping (panel B) [purple, HRS; blue, B cell; green, CTLA-4–positive T cell; orange, LAG-3–positive T cell; yellow, PD-1–positive T cell; red, T-cell positive for multiple checkpoints; gray, triple-negative T cell; dark gray, “other” cell]. (C) Pooled cell counts (135 298 T cells) across all analyzed cases (n = 18) reveals that CTLA-4–positive cells (46 981) outnumber PD-1–positive (26 256) and LAG-3–positive (22 061) cells (58 349 T cells were negative for CTLA-4, PD-1, and LAG-3). (D) Focal view of a representative case (CHL5) showing examples of isolated CTLA-4–positive cells (single arrow) and PD-1/LAG-3 double-positive cells (double arrow). (E) Cell segmentation and phenotype map corresponding to panel D. Filled cell borders denote cells in direct contact with HRS cells, whereas skeletal cell borders denote cells not in contact with HRS cells [purple, HRS; blue, B cell; green, CTLA-4–positive T cell; orange, LAG-3–positive T cell; yellow, PD-1–positive T cell; red, T-cell positive for multiple checkpoints; gray, triple-negative T cell; dark gray, “other” cell]. (F) CTLA-4–positive cells (median, 28%; range, 8%-73%) comprise a greater fraction of T cells in direct contact with HRS cells than do PD-1–positive (median, 9%; range, 3%-66%) or LAG-3–positive (median, 14%; range, 0%-36%) cells [CTLA-4 vs PD-1, P = .09; CTLA-4 vs LAG-3, P = .02].](https://ash.silverchair-cdn.com/ash/content_public/journal/blood/134/23/10.1182_blood.2019002206/4/m_bloodbld2019002206f2.png?Expires=1769196321&Signature=2z3L1qBWUjO-GQCfqPw0C4pqG3DmBjx7N2c4YH3JsvaFzCIiCLJCiSlD98OUuf9eycEBj-p3LdSzX5QWOd5DIGIUoBNuCO1l8rhrup6~Qk4IbT2JtsL~8XnY6vRTACyZZfj9Zi2tadN5LdZpwMcVGK2cZXpNQrrL8i-wE6xTfxY5OLu2PSa-fADoj6JaUZWujguIWdvS8jBF-Wpj-tSwbdZDCgZDUuJQSKwlegzLDtMDOFAvD8r-fiDqns76lm6xlBP0aKoMbocimnql3bqFL5sj7eedJHJ7w2ekUojN3fCkoB1ZUzh8anMXWklcMeJrduaGwcm9ZHcYt7mHDLo6ow__&Key-Pair-Id=APKAIE5G5CRDK6RD3PGA)
CTLA-4 is the predominant checkpoint on T cells in cHL, which are frequently negative for either PD-1 or LAG-3 and are often in direct contact with HRS cells. (A-B) Representative case of cHL (CHL5) including full field view (panel A) following cell segmentation and phenotyping (panel B) [purple, HRS; blue, B cell; green, CTLA-4–positive T cell; orange, LAG-3–positive T cell; yellow, PD-1–positive T cell; red, T-cell positive for multiple checkpoints; gray, triple-negative T cell; dark gray, “other” cell]. (C) Pooled cell counts (135 298 T cells) across all analyzed cases (n = 18) reveals that CTLA-4–positive cells (46 981) outnumber PD-1–positive (26 256) and LAG-3–positive (22 061) cells (58 349 T cells were negative for CTLA-4, PD-1, and LAG-3). (D) Focal view of a representative case (CHL5) showing examples of isolated CTLA-4–positive cells (single arrow) and PD-1/LAG-3 double-positive cells (double arrow). (E) Cell segmentation and phenotype map corresponding to panel D. Filled cell borders denote cells in direct contact with HRS cells, whereas skeletal cell borders denote cells not in contact with HRS cells [purple, HRS; blue, B cell; green, CTLA-4–positive T cell; orange, LAG-3–positive T cell; yellow, PD-1–positive T cell; red, T-cell positive for multiple checkpoints; gray, triple-negative T cell; dark gray, “other” cell]. (F) CTLA-4–positive cells (median, 28%; range, 8%-73%) comprise a greater fraction of T cells in direct contact with HRS cells than do PD-1–positive (median, 9%; range, 3%-66%) or LAG-3–positive (median, 14%; range, 0%-36%) cells [CTLA-4 vs PD-1, P = .09; CTLA-4 vs LAG-3, P = .02].
CTLA-4 is the predominant checkpoint on T cells in cHL, which are frequently negative for either PD-1 or LAG-3 and are often in direct contact with HRS cells. (A-B) Representative case of cHL (CHL5) including full field view (panel A) following cell segmentation and phenotyping (panel B) [purple, HRS; blue, B cell; green, CTLA-4–positive T cell; orange, LAG-3–positive T cell; yellow, PD-1–positive T cell; red, T-cell positive for multiple checkpoints; gray, triple-negative T cell; dark gray, “other” cell]. (C) Pooled cell counts (135 298 T cells) across all analyzed cases (n = 18) reveals that CTLA-4–positive cells (46 981) outnumber PD-1–positive (26 256) and LAG-3–positive (22 061) cells (58 349 T cells were negative for CTLA-4, PD-1, and LAG-3). (D) Focal view of a representative case (CHL5) showing examples of isolated CTLA-4–positive cells (single arrow) and PD-1/LAG-3 double-positive cells (double arrow). (E) Cell segmentation and phenotype map corresponding to panel D. Filled cell borders denote cells in direct contact with HRS cells, whereas skeletal cell borders denote cells not in contact with HRS cells [purple, HRS; blue, B cell; green, CTLA-4–positive T cell; orange, LAG-3–positive T cell; yellow, PD-1–positive T cell; red, T-cell positive for multiple checkpoints; gray, triple-negative T cell; dark gray, “other” cell]. (F) CTLA-4–positive cells (median, 28%; range, 8%-73%) comprise a greater fraction of T cells in direct contact with HRS cells than do PD-1–positive (median, 9%; range, 3%-66%) or LAG-3–positive (median, 14%; range, 0%-36%) cells [CTLA-4 vs PD-1, P = .09; CTLA-4 vs LAG-3, P = .02].
Visual inspection revealed CTLA-4–positive T cells that were frequently in direct contact with, and occasionally rosetting, HRS cells (Figure 2D). Cell-to-cell contact analysis (Figure 2E) revealed that CTLA-4–positive cells comprised a greater fraction of T cells in direct contact with HRS cells (median fraction of HRS cell contacts, 28%; range, 8%-73%) than did PD-1–positive T cells (9%; range, 3%-66%) or LAG-3–positive T cells (13%; range, 0%-36%) (CTLA-4 vs PD-1, P = .09; CTLA-4 vs LAG-3, P = .02) (Figure 2F). We identified no significant enrichment for the FOXP3-positive subset of CTLA-4–positive cells in contact with HRS cells relative to PD-1 or LAG-3–positive T cells (P > .05).
CD86 is uniformly expressed on HRS cells and on a subset of TAMs
Based on the frequent direct contact of HRS cells with CTLA-4–positive T cells, we interrogated for the expression of CD86, a cognate ligand for CTLA-4, on HRS cells. We observed marked CD86 expression on HRS cells by mIF (Figure 3A), which was confirmed by chromogenic IHC (supplemental Figure 4). The majority of HRS cells were CD86-positive in all cases according to quantitative analysis (median fraction of HRS cells positive for CD86, 86%; range, 65%-100%) (Figure 3B).
![CD86 is uniformly and strongly expressed on HRS cells and also on a subset of TAMs. (A) Representative mIF image of a cHL case (CHL24) [inset: PAX5-positive HRS cells with strong CD86 expression]. (B) HRS cells are predominantly CD86-positive (median, 86%; range, 65%-100%) [overlay, density of HRS cells across analyzed cases; median, 243/mm2; range, 55-548/mm2]. (C) Representative mIF image of a cHL case (CHL24) showing weakly CD86-positive TAMs (arrows) [inset, PAX5-positive HRS cells with strong CD86 expression next to CD68-positive TAMs with weaker CD86 expression]. (D) A subset of CD68-positive TAMs is CD86-positive in each case (median, 32%; range, 12%-79%) [overlay, density of TAMs across analyzed cases; median, 1236/mm2; range, 261-2,670/mm2]. (E) CD86 expression is higher on HRS cells (median of mean cell membrane intensity, 4.5; range, 1.7-7.2) than on TAMs (median of mean cell membrane intensity, 1.8; range 1.1-3.1) in each case of cHL (HRS vs TAM, P = .0007). (F) Contribution of cellular CD86 expression in cHL attributable to HRS cells (median, 27%; range, 2%-73%) and to TAMs (median, 73; range, 27%-98%). EBV-positive cases are marked by asterisks. DAPI, 4′,6-diamidino-2-phenylindole.](https://ash.silverchair-cdn.com/ash/content_public/journal/blood/134/23/10.1182_blood.2019002206/4/m_bloodbld2019002206f3.png?Expires=1769196321&Signature=N4HY~IVpYuSireeMPEkBVbCUcYahgMWAO-eR~lFuXNRvW5mFDtjeC0PtBnz2P2Bl9AH8OHmCix0orBJCjSlrF46KkdM8Y9ERp~83P-6uDu3~XxjyzmGOMvYt~1myNQTYRVpcQRRyjGWCVrLgENjDMNw4FC~2HjXENSWEIsFJhGJge3MhuCBRgiYbHTZNYieNU9BrYus1FoaVGdKZ~v5q6LtkXN0qR6ZV7b4Bx8ViydGoKM9Av6yI4uvcCyrH6TiyvDKwR8AM5Q6EAjIF7PXHqjaqzGrrR1YyP4DLZmaib1OSpGnd5UdS6qBxph-ToufRVVYDfty5vIpo7XX-4bE-Mw__&Key-Pair-Id=APKAIE5G5CRDK6RD3PGA)
CD86 is uniformly and strongly expressed on HRS cells and also on a subset of TAMs. (A) Representative mIF image of a cHL case (CHL24) [inset: PAX5-positive HRS cells with strong CD86 expression]. (B) HRS cells are predominantly CD86-positive (median, 86%; range, 65%-100%) [overlay, density of HRS cells across analyzed cases; median, 243/mm2; range, 55-548/mm2]. (C) Representative mIF image of a cHL case (CHL24) showing weakly CD86-positive TAMs (arrows) [inset, PAX5-positive HRS cells with strong CD86 expression next to CD68-positive TAMs with weaker CD86 expression]. (D) A subset of CD68-positive TAMs is CD86-positive in each case (median, 32%; range, 12%-79%) [overlay, density of TAMs across analyzed cases; median, 1236/mm2; range, 261-2,670/mm2]. (E) CD86 expression is higher on HRS cells (median of mean cell membrane intensity, 4.5; range, 1.7-7.2) than on TAMs (median of mean cell membrane intensity, 1.8; range 1.1-3.1) in each case of cHL (HRS vs TAM, P = .0007). (F) Contribution of cellular CD86 expression in cHL attributable to HRS cells (median, 27%; range, 2%-73%) and to TAMs (median, 73; range, 27%-98%). EBV-positive cases are marked by asterisks. DAPI, 4′,6-diamidino-2-phenylindole.
CD86 is uniformly and strongly expressed on HRS cells and also on a subset of TAMs. (A) Representative mIF image of a cHL case (CHL24) [inset: PAX5-positive HRS cells with strong CD86 expression]. (B) HRS cells are predominantly CD86-positive (median, 86%; range, 65%-100%) [overlay, density of HRS cells across analyzed cases; median, 243/mm2; range, 55-548/mm2]. (C) Representative mIF image of a cHL case (CHL24) showing weakly CD86-positive TAMs (arrows) [inset, PAX5-positive HRS cells with strong CD86 expression next to CD68-positive TAMs with weaker CD86 expression]. (D) A subset of CD68-positive TAMs is CD86-positive in each case (median, 32%; range, 12%-79%) [overlay, density of TAMs across analyzed cases; median, 1236/mm2; range, 261-2,670/mm2]. (E) CD86 expression is higher on HRS cells (median of mean cell membrane intensity, 4.5; range, 1.7-7.2) than on TAMs (median of mean cell membrane intensity, 1.8; range 1.1-3.1) in each case of cHL (HRS vs TAM, P = .0007). (F) Contribution of cellular CD86 expression in cHL attributable to HRS cells (median, 27%; range, 2%-73%) and to TAMs (median, 73; range, 27%-98%). EBV-positive cases are marked by asterisks. DAPI, 4′,6-diamidino-2-phenylindole.
We additionally observed weaker, but distinct, membranous CD86 expression on a subset of CD68-positive TAMs (Figure 3C). Quantitative analysis confirmed that, in general, a minority of TAMs expressed detectable CD86 (median, 32%; range, 12%-79%) (Figure 3D) and that the mean fluorescence intensity of staining for CD86 was consistently lower among TAMs than for HRS cells (P = .0007) (Figure 3E). However, most CD86-positive cells within regions of interest enriched for HRS cells were TAMs (median fraction of CD86-positive cells, 73%; range, 27%-98%) rather than HRS cells (27%; range, 2%-73%) (Figure 3F).
Delineation of the HRS cell immune-suppressive niche
We next examined 4 tiled fields of view at 20× resolution to evaluate the spatial distributions of cells of defined phenotypes within the cHL TME. In several cases, distinct microstructures were observed wherein CD86-positive HRS cells lay in proximity to CD86-positive TAMs and CTLA-4–positive cells (Figure 4A). Quantitative analyses using cell phenotype fractional heatmaps confirmed that the highest densities of HRS cells, CD86-positive cells, and CTLA-4–positive cells were localized within overlapping areas (Figure 4B-F). To more precisely quantify this finding, an “HRS proximal” region was delineated, defined by an area within 75 μm of an HRS cell (ie, < 75 μm from the HRS cell) (Figure 5A-C), a region significant in the PD-1/PD-L1 analyses reported previously.6 CTLA-4–positive T cells were enriched within the HRS proximal region (median, 38%; range, 3%-84%) in each individual case, and across all cases, relative to the distal region (median, 18%; range, 2%-53%) (P = .0001) (Figure 5D). We did not find the FOXP3-positive subset of CTLA-4–positive T cells to be similarly enriched (P > .05). We also found that CD86-positive TAMs were enriched within the HRS proximal region (median, 38%; range, 22%-91%) in each individual case, and across cases, relative to the distal region (median, 24%; range, 0%-69%; P = .0007) (Figure 5E). As expected, the majority of CD86-positive TAMs within the HRS proximal region also expressed PD-L1 (Figure 5F, supplemental Figure 5). In contrast to CTLA-4, we did not visually observe colocalization of LAG-3–positive cells with HRS cells to suggest local enrichment for T cells expressing this additional immune checkpoint protein.
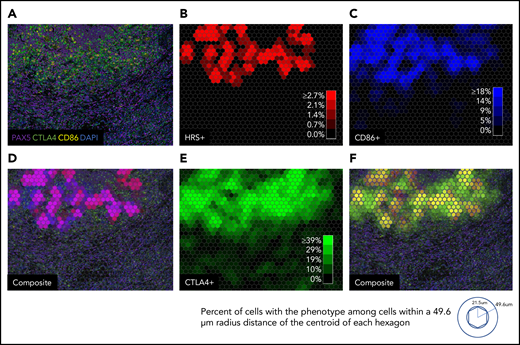
Macroscopic view showing zonal distribution of CTLA-4–positive cells, HRS cells, and CD86-positive cells. (A) Four 20× fields of view merged to form a macroscopic mIF image from a representative case of cHL (CHL12). (B) Phenotypic cell fraction represented as a spatially distributed heatmap for HRS cells. (C) Phenotypic cell fraction represented as a spatially distributed heatmap for CD86-positive cells. (D) Composite heatmap for HRS cells and CD86-positive cells (purple, colocalization of HRS cells and CD86-positive cells) overlaid on the original mIF image in panel A. (E) Phenotypic cell fraction represented as a spatially distributed heatmap for CTLA-4–positive cells. (F) Composite of heatmaps for HRS cells and CTLA-4–positive cells (yellow, colocalization of HRS cells and CTLA-4–positive cells) overlaid on the original mIF image (from panel A). The color intensities for each heatmap were determined by calculating percentage of cells with the given phenotype among all cells within a 49.6 µm radius distance of the centroid of each hexagon. DAPI, 4′,6-diamidino-2-phenylindole.
Macroscopic view showing zonal distribution of CTLA-4–positive cells, HRS cells, and CD86-positive cells. (A) Four 20× fields of view merged to form a macroscopic mIF image from a representative case of cHL (CHL12). (B) Phenotypic cell fraction represented as a spatially distributed heatmap for HRS cells. (C) Phenotypic cell fraction represented as a spatially distributed heatmap for CD86-positive cells. (D) Composite heatmap for HRS cells and CD86-positive cells (purple, colocalization of HRS cells and CD86-positive cells) overlaid on the original mIF image in panel A. (E) Phenotypic cell fraction represented as a spatially distributed heatmap for CTLA-4–positive cells. (F) Composite of heatmaps for HRS cells and CTLA-4–positive cells (yellow, colocalization of HRS cells and CTLA-4–positive cells) overlaid on the original mIF image (from panel A). The color intensities for each heatmap were determined by calculating percentage of cells with the given phenotype among all cells within a 49.6 µm radius distance of the centroid of each hexagon. DAPI, 4′,6-diamidino-2-phenylindole.
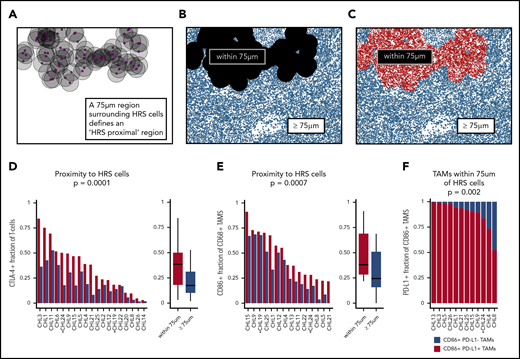
The HRS cell microenvironmental niche is enriched for CTLA-4–positive cells and CD86-positive TAMs. (A-C) Schematic showing generation of “HRS proximal” and distal regions in the representative case shown in Figure 4 (CHL12). (D) The HRS proximal region is enriched for T cells that are CTLA-4–positive (median percentage positive, 38%; range, 3%-84%) in each individual case, and across cases, relative to the distal region (median, 18%; range, 2%-53%; P = .0001). (E) The HRS proximal region is enriched for CD68-positive TAMs that are CD86-positive (median percentage positive, 38%; range, 22%-91%) in each individual case, and across cases, relative to the distal region (median percentage positive, 24%; range, 0%-69%; P = .0007). (F) The CD86-positive TAMs within 75 μm of HRS cells were predominantly PD-L1–positive (median percentage positive, 92%; range, 52%-99%) (PD-L1–positive vs PD-L1–negative, P = .002). EBV-positive cases are marked by asterisks.
The HRS cell microenvironmental niche is enriched for CTLA-4–positive cells and CD86-positive TAMs. (A-C) Schematic showing generation of “HRS proximal” and distal regions in the representative case shown in Figure 4 (CHL12). (D) The HRS proximal region is enriched for T cells that are CTLA-4–positive (median percentage positive, 38%; range, 3%-84%) in each individual case, and across cases, relative to the distal region (median, 18%; range, 2%-53%; P = .0001). (E) The HRS proximal region is enriched for CD68-positive TAMs that are CD86-positive (median percentage positive, 38%; range, 22%-91%) in each individual case, and across cases, relative to the distal region (median percentage positive, 24%; range, 0%-69%; P = .0007). (F) The CD86-positive TAMs within 75 μm of HRS cells were predominantly PD-L1–positive (median percentage positive, 92%; range, 52%-99%) (PD-L1–positive vs PD-L1–negative, P = .002). EBV-positive cases are marked by asterisks.
Detection of CTLA-4–positive cells in cHL after PD-1 blockade
We next sought to determine whether CTLA-4/CD86 interactions are a feature of the cHL TME in recurrent cHL tumors (n = 18) after PD-1 blockade (n = 9), ABVD (n = 4), and/or SCT (n = 5). We performed mIF staining and analysis on biopsy samples from the aforementioned subtypes of relapsed cHL. In each biopsy sample, frequent CTLA-4–positive lymphoid cells were observed, which were often in direct contact with CD86-positive HRS cells (Figure 6A-E). Quantitative analysis revealed that relapsed cHL cases (n = 17) had a large portion of HRS cells in contact with CTLA-4–positive cells (median, 54%; range, 13%- 98%); this was greater (Mann-Whitney U test, P = .11) than the portion of HRS cells in contact with CTLA-4–positive cells among diagnostic cases (n = 20; median, 40%; range, 7%-76%) (Figure 6F). The majority of CTLA-4–positive T cells (70%) in cHLs after PD-1 treatment were negative for both PD-1 and LAG-3.
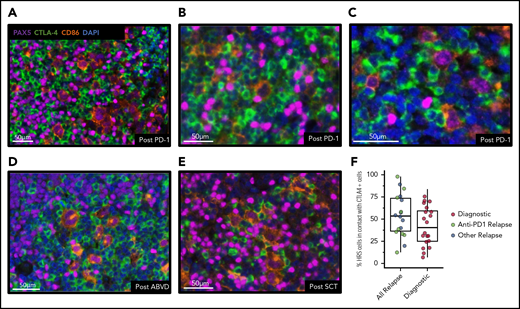
CTLA-4–positive cells are present after anti–PD-1 immunotherapy and focally contact HRS cells. Representative mIF images of core tissue biopsy samples from 3 patients with recurrent cHL after anti–PD-1 immunotherapy (A-C), from 1 patient after doxorubicin, bleomycin, vinblastine, and dacarbazine therapy (ABVD) (D), and from 1 patient after SCT (E), and showing the presence of CTLA-4–positive cells, including CTLA-4–positive T cells focally in contact with CD86-positive/PAX5-positive HRS cells. (F) Relapsed cHL cases (n = 18) have a large portion of HRS cells in contact with CTLA-4–positive cells (median, 54%; range, 13%-98%); this is greater (Mann-Whitney U test, P = .11) than the portion of HRS cells in contact with CTLA-4–positive cells among diagnostic cases (n = 20; median, 40%; range, 7%-76%). DAPI, 4′,6-diamidino-2-phenylindole.
CTLA-4–positive cells are present after anti–PD-1 immunotherapy and focally contact HRS cells. Representative mIF images of core tissue biopsy samples from 3 patients with recurrent cHL after anti–PD-1 immunotherapy (A-C), from 1 patient after doxorubicin, bleomycin, vinblastine, and dacarbazine therapy (ABVD) (D), and from 1 patient after SCT (E), and showing the presence of CTLA-4–positive cells, including CTLA-4–positive T cells focally in contact with CD86-positive/PAX5-positive HRS cells. (F) Relapsed cHL cases (n = 18) have a large portion of HRS cells in contact with CTLA-4–positive cells (median, 54%; range, 13%-98%); this is greater (Mann-Whitney U test, P = .11) than the portion of HRS cells in contact with CTLA-4–positive cells among diagnostic cases (n = 20; median, 40%; range, 7%-76%). DAPI, 4′,6-diamidino-2-phenylindole.
Discussion
Several previous studies have examined expression of immunological regulatory proteins beyond PD-1 in cHL by using flow cytometry or qualitative, single-marker chromogenic IHC.25-29 Multiplexed, quantitative, and spatially resolved analyses of the major, targetable immune checkpoint proteins have only been performed for the PD-1/PD-L1 signaling axis, however.6 In the current study, an in situ characterization was performed for the immune checkpoints CTLA-4 and LAG-3 in relation to PD-1 in cHL. Based on the initial findings, we explored the topography of CTLA-4 and its cognate ligand CD86 in greater detail. Our findings revealed that the TME of cHL is characterized by: (1) a markedly expanded population of CTLA-4–positive, PD-1–negative, and LAG-3–negative T cells; (2) strong expression of CD86, a cognate ligand for CTLA-4, on nearly all HRS cells and weaker CD86 expression on a subset of TAMs; (3) enrichment for CTLA-4–positive T cells and CD86-positive TAMs within the specialized niche of PD-L1–positive TAMs surrounding PD-L1–positive HRS cells; and (4) the persistence of CTLA-4–positive T cells within the TME and in direct contact with HRS cells after PD-1 blockade.
As anticipated, we observed that FOXP3-positive regulatory T cells are predominantly CTLA-4–positive.20,21 However, we found that CTLA-4–positive T cells exceed numbers of Tregs and, consistent with this observation, that most CTLA-4–positive T cells are FOXP3-negative in cHL. Moreover, we did not observe enrichment for FOXP3-positive cells within the vicinity of HRS cells, which may indicate preferential importance of the CTLA-4–positive non-Treg cell population. Additional characterization of this major population is ongoing. Earlier studies using flow cytometric immunophenotyping of single-cell suspensions, and complementary tissue microarray-based IHC techniques, suggested enrichment for type 1 T helper cells (Th1) and central memory cells in the TME of cHL.25 Our subsequent analyses using mass cytometry have additionally shown that the TME is enriched for PD-1–positive, Th1-polarized, CD4-positive effectors, and PD-1–negative (likely functional), Th1-polarized, CD4-positive Tregs, compared with RLTs.30 It will be of interest to determine whether these two T-cell populations represent the CTLA-4–positive/FOXP3-negative and the CTLA-4–positive/FOXP3-positive T-cell populations identified in this study.
By quantitative analysis, we also found that HRS cells consistently express much higher amounts of CD86 than TAMs or other non-HRS cells in the TME. CD86 ligand is thus analogous to the PD-1 ligands, PD-L1 and PD-L2, which are also robustly expressed by HRS cells.5 PD-L1/2 expression is mediated, in part, by gains of PD-L1/PD-L2 on chromosome 9p24.1, which is a defining feature of HRS cells.3 Examination of genomic data derived from isolated HRS cells revealed no alterations of CD86 that would account for CD86 protein overexpression (K. Wienand et al, personal communication). However, genetic alterations resulting in enhanced JAK-STAT signaling in response to interferon are also a feature of HRS cells that could provide a basis for enhanced CD86 expression.31,32
Perhaps the most striking results of the current study are that CTLA-4–positive T cells, similar to PD-1–positive T cells, and CD86-positive TAMs, similar to PD-L1–positive TAMs, are highly enriched in proximity to HRS cells.6 Whereas CTLA-4 and PD-1 identify largely distinct T-cell populations, CD86 and PD-L1 seem to identify a common TAM population (supplemental Figure 5). Akin to the examination of PD-L1 within the TME, we found that TAMs, rather than HRS cells, contributed to a greater extent to the total microenvironmental pool of CD86 available to engage CTLA-4–positive T cells in the vicinity of HRS cells. Taken together, these data provide further evidence that HRS cells reside within a specialized microenvironmental, immunologically privileged niche, within which they may exploit CD86:CTLA-4 signaling as an alternative and coexistent escape pathway to the PD-L1:PD-1 axis (Figure 7).
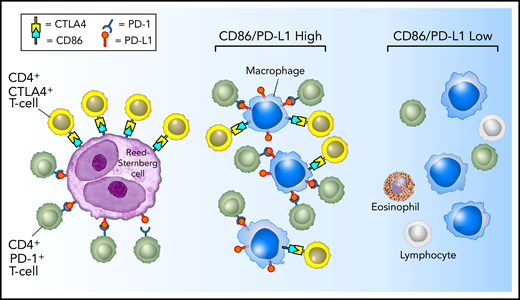
Model of PD-1:PD-L1 and CTLA-4:CD86 interactions in cHL. HRS cells (purple) express PD-L1 (and PD-L2) and CD86. TAMs (blue) that are in proximity to HRS cells frequently coexpress both PD-L1 and CD86, likely in response to local cytokine production, and thereby significantly increase the total amount of these ligands in proximity to the malignant cells. PD-L1 and CD86 on TAMs and HRS cells are available to bind PD-1–positive/CD4-positive T cells (green) and CTLA-4–positive/CD4-positive T cells (yellow). PD-1–positive T cells (previously shown)6 and CTLA-4–positive T cells are specifically enriched in the vicinity of PD-L1–positive/CD86-positive HRS cells.
Model of PD-1:PD-L1 and CTLA-4:CD86 interactions in cHL. HRS cells (purple) express PD-L1 (and PD-L2) and CD86. TAMs (blue) that are in proximity to HRS cells frequently coexpress both PD-L1 and CD86, likely in response to local cytokine production, and thereby significantly increase the total amount of these ligands in proximity to the malignant cells. PD-L1 and CD86 on TAMs and HRS cells are available to bind PD-1–positive/CD4-positive T cells (green) and CTLA-4–positive/CD4-positive T cells (yellow). PD-1–positive T cells (previously shown)6 and CTLA-4–positive T cells are specifically enriched in the vicinity of PD-L1–positive/CD86-positive HRS cells.
It will be of interest to determine the clinical significance of this specialized niche in the context of clinical response to conventional and targeted immunotherapy. Our results suggest that anti–CTLA-4 or combination anti–CTLA-4 and anti–PD-1 might benefit a subset of patients with cHL, especially those unresponsive or resistant to anti–PD-1 alone. Importantly, we found that the majority of CTLA-4–positive cells are also positive for the T-cell costimulatory receptor CD28, which shares as its ligands CD80/CD86; we therefore hypothesize that CTLA-4 blockade would allow for re-activation of a large portion of intratumoral T cells via the CD28 pathway.
Patients with metastatic melanoma treated with a combination of ipilimumab and nivolumab have superior outcomes compared with patients treated with nivolumab alone, and combination therapy is now the standard of care for this disease.33,34 Although a clear benefit of combination therapy was not observed for patients with relapsed and/or refractory cHL previously untreated with immune checkpoint blockade,18 this result was likely due to the extraordinarily high ORR to anti–PD-1 therapy alone (65%-80%).35 Two other smaller studies have suggested that ipilimumab may have some efficacy alone, or in combination with brentuximab vedotin, in relapsed and/or refractory patients, including those after SCT.36,37 The total number of patients receiving anti–PD-1 therapy has increased substantially with the approvals by the US Food and Drug Administration of nivolumab and pembrolizumab for patients with relapsed and/or refractory cHL in 2016, and it is becoming apparent that many, if not most, patients responsive to PD-1 blockade eventually experience disease recurrence.8,9 These patients lack a clear therapeutic alternative. Our data support the notion that CD86:CTLA-4 signaling represents an immunosuppressive pathway distinct from PD-L1/2:PD-1 signaling that is enriched within the immune-privileged niche of HRS cells. The potential efficacy of ipilimumab, either as a single agent or in combination with an inhibitor of an additional immune checkpoint protein warrants further exploration. Prospective clinical studies will be required to test this hypothesis.
All e-mails regarding data sharing should be sent to the corresponding author.
The online version of this article contains a data supplement.
The publication costs of this article were defrayed in part by page charge payment. Therefore, and solely to indicate this fact, this article is hereby marked “advertisement” in accordance with 18 USC section 1734.
Acknowledgments
P.A. recognizes the generous support of the Harold and Virginia Lash Foundation and the Leukemia and Lymphoma Society. This work was supported in part by the Ruth L. Kirschstein National Research Service (National Institutes of Health T32) Award (S.S.P.) and research support from the International Immuno-Oncology Network (II-ON) of Bristol-Myers Squibb (S.J.R. and M.A.S.), National Cancer Institute, National Institutes of Health, grant R01CA061026 (M.A.S.), and the Miller Family Fund (M.A.S.).
Authorship
Contribution: S.S.P. and S.J.R. designed the study and wrote the manuscript; S.S.P., M.L., A.L., and P-H.C. performed the research; J.L.W. performed statistical and other computational analyses; G.K.G. collected samples; and P.A. and M.A.S. contributed to experimental design, reviewed data, and provided clinical insight. All authors reviewed, edited, and approved the final manuscript.
Correspondence: Scott J. Rodig, Department of Pathology, Brigham and Women’s Hospital, 75 Francis St, Boston, MA 02115; e-mail: srodig@bwh.harvard.edu.

This feature is available to Subscribers Only
Sign In or Create an Account Close Modal