

Key Points
Most patients with U-MRD by flow cytometry (sensitivity 10−4) after first-line FCR for CLL are MRD+ by NGS (sensitivity 10−6).
Patients with undetectable MRD by NGS have superior PFS.

Abstract
Patients with chronic lymphocytic leukemia (CLL) who achieve blood or bone marrow (BM) undetectable minimal residual disease (U-MRD) status after first-line fludarabine, cyclophosphamide, and rituximab (FCR) have prolonged progression-free survival (PFS), when assessed by an assay with sensitivity 10−4 (MRD4). Despite reaching U-MRD4, many patients, especially those with unmutated IGHV, subsequently relapse, suggesting residual disease <10−4 threshold and the need for more sensitive MRD evaluation. MRD evaluation by next-generation sequencing (NGS) has a sensitivity of 10−6 (MRD6). To better assess the depth of remission following first-line FCR treatment, we used NGS (Adaptive Biotechnologies Corporation) to assess MRD in 62 patients, all of whom had BM U-MRD by multicolor flow cytometry (sensitivity 10−4) at end-of-FCR treatment. Samples from these patients included 57 BM samples, 29 peripheral blood mononuclear cell (PBMC) samples, and 32 plasma samples. Only 27.4% of the 62 patients had U-MRD by NGS. Rate of U-MRD by NGS was lowest in BM (25%), compared with PBMC (55%) or plasma (75%). No patient with U-MRD by NGS in BM or PBMC was MRD+ in plasma. Patients with mutated IGHV were more likely to have U-MRD by NGS at the end of treatment (EOT; 41% vs 13%, P = .02) than those with unmutated IGHV. Median follow-up was 81.6 months. Patients with U-MRD at EOT had superior PFS vs MRD+ patients, regardless of sample type assessed (BM, P = .02, median not reached [NR] vs 67 months; PBMC, P = .02, median NR vs 74 months). More sensitive MRD6 testing increases prognostic discrimination over MRD4 testing.
Introduction
Over 50% of patients with mutated immunoglobulin heavy chain variable gene (M-IGHV) achieve prolonged progression-free survival (PFS) and are potentially cured of their chronic lymphocytic leukemia (CLL) after first-line treatment with fludarabine, cyclophosphamide, and rituximab (FCR).1-3 In the series with longest follow-up, long-term PFS approached 80% in patients with M-IGHV who had undetectable minimal residual disease when tested at a sensitivity of 10−4 (U-MRD4) at the completion of therapy.1 Subsequent series confirmed the prognostic relevance of end-of-treatment (EOT) U-MRD4 status after chemotherapy or chemoimmunotherapy.4-13 Of note, in all of these series, a significant number of patients who attained U-MRD4 status eventually relapsed, particularly those with higher-risk pretreatment biological characteristics, such as unmutated-IGHV (UM-IGHV).4
Potential reasons for relapse after achieving U-MRD4 include the presence of residual disease below the level of sensitivity of the test in the assayed compartment (cellular fraction of blood or bone marrow [BM]) or presence of disease in tissue compartments not directly sampled by the assay.14 The latter may be especially relevant in diseases predominantly present in the tissue, such as diffuse large B-cell lymphoma (DLBCL),15,16 but may also be relevant in CLL, which is a multicompartmental disease and in which relapse/response patterns differ between patients. Of particular interest is the phenomenon of U-MRD4 in patients who achieve partial remission, where patients may have lymph nodes >1.5 cm by computed tomographic (CT) scan, despite BM U-MRD4. Some, but not all, of these patients may have clinically significant residual disease present within lymph nodes, which could potentially be detected by sequencing-based MRD analysis from plasma of circulating tumor cell-free DNA (ctDNA), which is released into the circulation from apoptotic and necrotic tumor cells in lymph nodes and other tissues.17
Accurate posttreatment prognostic assignment in CLL is important, particularly because there is potentially a “cure fraction” after first-line FCR treatment; additionally, clinical trials are now being designed with U-MRD as both a primary end point and a trigger for treatment discontinuation. We hypothesized that, among patients with BM U-MRD4 after first-line FCR, more sensitive MRD6 testing would more accurately assign prognosis and that there may be differential sensitivity for MRD6 testing according to sample type, including BM, blood, and plasma. The quantitative NGS-MRD assay (Adaptive Biotechnologies Corporation, Seattle, WA) can be performed on cells from BM, on peripheral blood mononuclear cells (PBMCs), and on ctDNA in plasma.16,18-21 A recent study in patients with multiple myeloma demonstrated the ability of this assay to identify MRD6+ patients who had been previously assessed as U-MRD4 by flow cytometry (FLC); those patients who were MRD6− had a higher probability of prolonged PFS.22 We tested prospectively banked, posttreatment BM, PBMC, and plasma samples from patients treated on a prospective, phase 2 clinical trial of first-line FCR, who all achieved BM U-MRD4 at EOT to determine the proportion of patients with residual disease by the more sensitive test and who correlate with PFS outcomes. Clinical results from this study, with a focus on pretreatment prognostic variables and the prognostic impact of serial multiparameter FLC MRD assessment, have been previously published.4,11
Patients and methods
Patients
Patients were treated on a prospective, phase 2 clinical trial with standard FCR for up to 6 courses (NCT00759798).11,23 This trial was designed to prospectively evaluate the impact of pretreatment biological and clinical prognostic factors on outcomes, as well as the prognostic impact of interim and posttreatment BM MRD4 results. MRD4 analysis was performed ∼2 months after the EOT, with 4-color FLC, according to the standardized protocol proposed by the ERIC group.24 Patients were eligible for the current analysis if they had BM U-MRD by standard multicolor FLC at end of first-line FCR treatment and had a banked pretreatment and at least 1 EOT sample (BM, PBMC, or plasma) available for testing using Adaptive’s NGS MRD assay. In all, 122 patients achieved U-MRD by FLC at the EOT. Of these patients, 62 had stored, posttreatment samples, taken at the same time as the posttreatment BM FLC analysis was performed; these were analyzed by NGS for MRD6. The following posttreatment samples were available: 57 BM, 29 PBMC, and 32 plasma. Twenty-two patients had all 3 sample types available, and 12 had 2 sample types available, allowing comparison of sensitivity for MRD detection in different sample types (Figure 1). Patients provided written informed consent for sample storage on an institutional review board–approved protocol, and a separate institutional review board–approved protocol was obtained for the current analysis; these studies adhered to the principles outlined in the Declaration of Helsinki.

Sample types tested. 28 patients had only bone marrow specimens available, 22 patients had all 3 specimens (bone marrow, peripheral blood mononuclear cells, and plasma), and 12 patients had 2 available specimens.
Sample types tested. 28 patients had only bone marrow specimens available, 22 patients had all 3 specimens (bone marrow, peripheral blood mononuclear cells, and plasma), and 12 patients had 2 available specimens.
Sample collection, processing, and storage
Sample collection, processing, and storage are described in detail in supplemental Methods, available on the Blood Web site. Briefly, peripheral blood samples were centrifuged, and plasma was removed and stored at −80°C in 2-mL aliquots. Mononuclear cells were separated using Ficoll Hypaque, and then viable cells were stored in 2-mL vials with 1 mL fetal bovine serum and 10% dimethyl sulfoxide. BM cells were centrifuged; red cells were lysed and then stored in 1-mL vials with 1 mL fetal bovine serum/10% dimethyl sulfoxide.
Next-generation sequencing (NGS)
Pretreatment specimens (BM or PBMC) were evaluated by Adaptive’s NGS MRD assay for the identification of dominant sequence(s) of VDJ or DJ fragment(s) associated with the disease. This assay can detect MRD at levels <1 in 1 million (<10−6). Dominant sequences were identified by previously defined criteria.25 Using this NGS MRD assay, multiplex polymerase chain reaction (PCR) and NGS were used to amplify and sequence rearrangements within the B-cell receptor IgH, IgK, and IgL CDR3 region.26,27 Clonal leukemic sequences were identified by previously defined criteria.28 Specifically, the assay utilizes multiplexed primers complementing V-J rearrangements (IgH, IgK/L) and D-J (IgH) rearrangements, and a synthetic immune repertoire to identify and computationally correct for amplification bias following PCR and NGS.26 Clonal frequencies from posttreatment samples were determined as previously described.25,26 For each posttreatment sample, 1 vial of cells or plasma was analyzed.
Statistical analysis
PFS was defined as the time from the start of treatment until disease progression or death from any cause. Overall survival was defined as the time from the start of treatment until death from any cause. Survival curves were calculated using the Kaplan-Meier method, and cross-group comparisons were made using the log-rank test. Six-month landmark analyses (6 months representing the EOT in the majority of patients) were performed for PFS and reemergence of MRD to determine the association between MRD6 status at the EOT and time-to-event end points. Multivariable analyses for association between pretreatment characteristics and time-to-event outcomes were performed using Cox regression analysis. Univariable and multivariable analyses for binary outcomes were performed using logistic regression analysis. All P values are 2-sided, with a significance level of ≤.05. Statistical analysis was performed using SPSS version 22 (IBM Corp, Armonk, NY), GraphPad Prism 6 (La Jolla, CA), and R version 3.4.0 (Vienna, Austria), with packages “survey” version 3.36 and “survival” version 2.42.
Results
Patients and samples
Sixty-two patients with U-MRD by FLC in BM at the EOT had a pretreatment specimen, and at least 1 posttreatment specimen was available. Pretreatment patient characteristics are shown in Table 1. The distribution of available samples is shown in Figure 1.
Pretreatment patient characteristics
| Characteristic (N = 62 unless stated) | Number (%) with U-MRD* | OR, P |
|---|---|---|
| Age, median (range), y | ||
| <65 (n = 53) | 13 (24.5) | 0.4 (0.1-1.7), .23 |
| ≥65 (n = 9) | 4 (44.4) | |
| Rai stage | ||
| 0-II (n = 40) | 11 (29.7) | 2.2 (0.6-7.7), .23 |
| III-IV (n = 22) | 3 (15.0) | |
| B2M mg/L (n = 61) | ||
| <4.0 (n = 39) | 11 (28.2) | 1.1 (0.3-3.4), .94 |
| ≥4.0 (n = 22) | 6 (27.3) | |
| ZAP70 (n = 52) | ||
| Negative (n = 23) | 7 (30.4) | 1.4 (0.4-4.7), .61 |
| Positive (n = 29) | 7 (24.1) | |
| FISH (n = 61) | ||
| Del(13q) (n = 19) | 4 (21.1) | |
| No abnormalities (n = 21) | 5 (23.8) | |
| Trisomy 12 (n = 11) | 6 (54.5) | 4.8 (1.2-18.9), .02 |
| Del(11q) (n = 8) | 0 | |
| Del(17p) (n = 2) | 1 (50.0) | |
| IGHV mutation status | ||
| Mutated (n = 32) | 13 (41) | 4.4 (1.3-15.8), .02 |
| Unmutated (n = 30) | 4 (13) |
B2M, β-2 microglobulin; FISH, fluorescence in situ hybridization; ZAP70, ζ-associated protein 70, by immunohistochemistry in BM.
MRD result from in BM (n = 57) where available or PBMC (n = 5). U-MRD defined for this analysis as undetectable MRD, regardless of assay sensitivity.
MRD assay performance and rates of detection
Regardless of assay sensitivity, U-MRD rates by NGS according to sample type were 14/57 (25%) in BM; 16/29 (55%) in PBMC; 24/32 (75.0%) in plasma. The correlation between MRD results in different sample types is shown in Figure 2. Notably, all patients with MRD+ in plasma simultaneously had detectable disease in either BM or PBMC. Of 16 patients who had U-MRD in PBMC, 7 of 12 with simultaneous BM samples were MRD+ in BM. No patient with U-MRD in BM was MRD+ in PBMC.
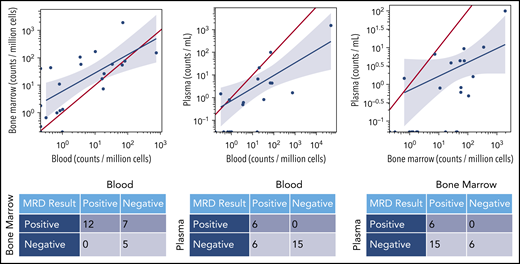
MRD concordance between sample types. The red line in each graph represents equivalent disease quantification for each sample type. In a given patient, quantities of malignant clone detected were generally higher in BM than PBMCs and higher in BM or PBMCs than plasma. The blue line is the linear regression line demonstrating the mathematical correlation between sample types.
MRD concordance between sample types. The red line in each graph represents equivalent disease quantification for each sample type. In a given patient, quantities of malignant clone detected were generally higher in BM than PBMCs and higher in BM or PBMCs than plasma. The blue line is the linear regression line demonstrating the mathematical correlation between sample types.
Sensitivity of at least 10−6 was achieved in 74% and 62% of samples in BM and PBMC, respectively. Overall, in 10 of 62 patients, FLC-based MRD analysis from BM at the EOT did not achieve sensitivity of 0.01% (median 0.03%, range 0.02% to 0.1%). Nine of 10 patients did not have 10−4 sensitivity by FLC had BM samples for NGS; 7 of 9 (78%) had at least 10−6 sensitivity in the NGS assay, similar to the proportion for the total cohort. Of these patients, 3 of 9 (33%) had U-MRD by NGS (all of whom achieved sensitivity of at least 10−6). This is a similar rate of U-MRD by NGS in BM in the overall cohort (25%). Thus, there did not appear to be inferior NGS assay performance in patients whose FLC sensitivity did not reach 0.01%.
Among patients with U-MRD by NGS, 4 of 14 BM (range 1.06 to 3.2 × 10⁻⁶, median 1.96 × 10⁻⁶) and 8 of 16 PBMC (range 1.001 × 10⁻⁶ to 3.56 × 10⁻⁶, median 1.54 × 10⁻⁶) samples did not have sensitivity of 10−6. Notably, 3 patients also had detectable disease at a level <10−6 in BM, 2 of whom subsequently relapsed (Figure 3C); these 2 patients had MRD just below the 10−6 threshold (0.90 × 10⁻⁶ and 0.98 × 10⁻⁶, respectively). Two patients had detectable disease at a level of <10−6 in PBMC, both of whom had detectable disease at a level of >10−6 in BM.
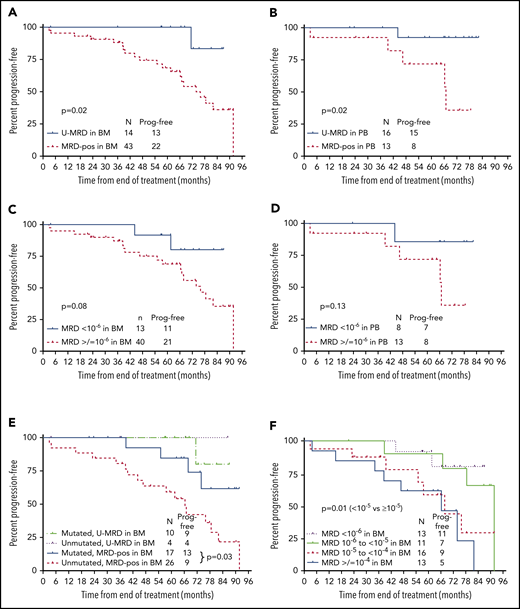
PFS according to posttreatment MRD status by NGS. (A) PFS from the end of treatment (EOT) according to MRD status in BM by NGS. Fifty-seven patients had BM specimens available. Results were dichotomized as detectable vs undetectable, regardless of sensitivity. (B) PFS from the EOT according to MRD status (detectable vs undetectable) in PBMC by NGS. Twenty-nine patients had PBMC specimens available. Results were dichotomized as detectable vs undetectable, regardless of sensitivity. (C) PFS from the EOT according to MRD6 status (<10−6 vs ≥10−6) in BM. Fifty-three of 57 BM specimens were useful for this analysis; 4 were not included as MRD was undetectable, but sensitivity did not reach 10−6. (D) PFS from the EOT according to MRD status (<10−6 vs ≥10−6) in PBMC. Twenty-one of 29 PBMC specimens were useful for this analysis; 8 were not included as MRD was undetectable, but sensitivity did not reach 10−6. (E) PFS from the EOT according to MRD status (detectable vs undetectable) by NGS in BM and IGHV mutation status. (F) PFS from the EOT according to absolute MRD level. Fifty-three of 57 BM specimens were useful for this analysis; 4 were not included as MRD was undetectable, but sensitivity did not reach 10−6. Prog. free, progression free.
PFS according to posttreatment MRD status by NGS. (A) PFS from the end of treatment (EOT) according to MRD status in BM by NGS. Fifty-seven patients had BM specimens available. Results were dichotomized as detectable vs undetectable, regardless of sensitivity. (B) PFS from the EOT according to MRD status (detectable vs undetectable) in PBMC by NGS. Twenty-nine patients had PBMC specimens available. Results were dichotomized as detectable vs undetectable, regardless of sensitivity. (C) PFS from the EOT according to MRD6 status (<10−6 vs ≥10−6) in BM. Fifty-three of 57 BM specimens were useful for this analysis; 4 were not included as MRD was undetectable, but sensitivity did not reach 10−6. (D) PFS from the EOT according to MRD status (<10−6 vs ≥10−6) in PBMC. Twenty-one of 29 PBMC specimens were useful for this analysis; 8 were not included as MRD was undetectable, but sensitivity did not reach 10−6. (E) PFS from the EOT according to MRD status (detectable vs undetectable) by NGS in BM and IGHV mutation status. (F) PFS from the EOT according to absolute MRD level. Fifty-three of 57 BM specimens were useful for this analysis; 4 were not included as MRD was undetectable, but sensitivity did not reach 10−6. Prog. free, progression free.
Association between pretreatment characteristics and likelihood of U-MRD by NGS at the EOT
Association between likelihood of achieving U-MRD by NGS and pretreatment characteristics is shown in Table 1, for the 62 patients with NGS results. However, as described above, the patient group analyzed by NGS was a subgroup of a larger study. To assess the relationship between each of the predictors of interest and the probability of achieving U-MRD by NGS in the total patient cohort, we performed a weighted logistic regression. We included all subjects with an unambiguous MRD result: the 62 patients with U-MRD by flow with available NGS results; 114 with positive MRD by flow who did not have NGS testing but were assumed to be MRD+ by NGS. In addition to the 62 patients with NGS MRD results, there were 60 patients in the total cohort who had U-MRD by FLC but did not have samples available for NGS MRD analysis. To adjust for the fact that these subjects had U-MRD by FLC but did not have NGS results available, we assigned a weight of 122 of 62 to each subject with an NGS result, to reflect the fact that these 62 subjects represent the larger group of 122 with U-MRD by FLC.
Patients with trisomy 12 vs other (odds ratio [OR] 4.2 [1.4-13.1], P = .01) and with M-IGHV vs UM-IGHV (OR 6.0 [1.8-19.5], P = .003) had an increased likelihood of achieving U-MRD by NGS at the EOT. There were no other pretreatment characteristics associated with increased likelihood of U-MRD by NGS (supplemental Table 1).
PFS according to NGS-MRD
Data lock occurred on April 2, 2018. Median follow-up was 82 months (range: 28-112). Fifty-six of 62 (90.3%) patients are alive; 28 are progression free. Five patients were censored in the PFS analysis, for the following reasons: allogeneic stem cell transplant in ongoing complete remission for a patient with del(17p) (n = 1); received subsequent therapy with lenalidomide for MRD, after MRD was detected by FLC in a follow-up BM specimen, in the absence of clinical disease progression (n = 1); received systemic chemotherapy for other primary malignancy (n = 3). Median PFS for the whole cohort was 89 months.
First, PFS was analyzed according to whether MRD was detected or not (regardless of assay sensitivity). In this analysis, patients described above (3 in BM and 2 in PBMC) who had detectable MRD, but at a quantity of <10−6, were considered MRD+. In addition, patients who had undetectable MRD, but in whom assay sensitivity did not reach 10−6 (4 in BM and 8 in PBMC) were considered to have U-MRD. Patients with U-MRD at the EOT had superior PFS vs MRD+ patients, whether the sample type used was BM (P = .02, median not reached [NR] vs 67 months) or PBMC (P = .02, median NR vs 74 months) (Figure 3A-B).
Next, PFS was analyzed according to whether MRD was <10−6 vs ≥10−6 (MRD6); 40 of 53 (75%) in BM and 13 of 21 (62%) in PBMC were MRD6+. For this analysis, 4 patients who had U-MRD by NGS in BM and 8 patients who had U-MRD in PBMC, but where assay sensitivity did not reach at least 10−6, were excluded. Three patients who had detectable MRD at a quantity of <10−6 in BM and 2 patients who had detectable MRD at a quantity of <10−6 in PBMC were considered U-MRD6. Despite smaller numbers, there were trends toward shorter PFS for patients with MRD6+ vs U-MRD6 in the BM and in PBMC (Figure 3C-D).
We next analyzed PFS based on absolute level of BM MRD. Patients were divided into 4 categories: U-MRD or <10−6, 10−6 to <10−5, 10−5 to <10−4, and ≥10−4. Patients with MRD <10−5 had superior PFS to those with MRD ≥10−5 (P = .01; Figure 3F).
Association between clinical response, U-MRD by NGS, and PFS
Clinical response in this study was assessed according to National Cancer Institute–Working Group 1996 criteria,29 which did not require CT scans. Fifty-seven of 62 patients were in complete remission and 5 in partial remission (PR). There was no difference in PFS (P = .33) or time to MRD reemergence (P = .35) by FLC according to clinical remission status. Indeed, no relapses were seen in the 5 patients who were in PR after treatment. Of the 5 patients in PR, 3 of 4 who had an end of treatment (EOT) BM sample available had U-MRD6. Four of the 5 patients in PR have had no MRD reemergence detected by FLC during follow-up (supplemental Figure 1).
Association between pretreatment biological characteristics and progression
Two of 13 patients with MRD <10−6 and 5 of 12 with MRD <10−5 but ≥10−6 developed disease progression. We have previously shown that, among patients with U-MRD4, unmutated IGHV and pretreatment B2M ≥4.0 mg/L are associated with a higher risk of subsequent disease progression, while, among those with detectable MRD, ZAP70+ status is associated with higher risk of disease progression.4
Individual patient characteristics among those with MRD <10−5 who subsequently progressed are shown in Table 2. There was no patient who had low-risk features for disease progression (ie, mutated IGHV and B2M <4.0 mg/L). Among the 57 patients with BM samples for NGS, there was no difference in PFS in patients with U-MRD according to IGHV mutation status (although only 4 patients with UM-IGHV had U-MRD). Among patients who were MRD+, PFS was longer in those with M-IGHV compared with UM-IGHV (P = .03) (Figure 3E), and there was a trend toward longer PFS in patients with B2M <4.0 mg/L vs ≥4.0 mg/L (hazard ratio [HR] 2.4 [0.97-6.1], P = .06) (supplemental Table 2). On multivariable analysis, both M-IGHV (HR 4.6 [1.4-14.9], P = .01) and B2M <4.0 mg/L (HR 4.0 [1.4-11.0], P = .01) were significantly associated with longer PFS in patients with BM MRD+.
MRD levels and patient characteristics in patients with MRD <10−5 who subsequently developed disease progression
| MRD level | IGHV-MS | B2M (mg/L) | ZAP70 | FISH subtype |
|---|---|---|---|---|
| 0.98 × 10⁻⁶ detectable | Unmutated | 3.1 | Positive | Negative |
| 0.90 × 10⁻⁶ detectable | Unmutated | 5.9 | Positive | Del(11q) |
| Undetectable (limit of detection 1.9 × 10⁻⁶) | Unknown | 7.7 | Positive | Trisomy 12 |
| 6.78 × 10⁻⁶ | Unmutated | 3.1 | Unknown | Trisomy 12 |
| 5.30 × 10⁻⁶ | Unmutated | 3.1 | Positive | Del(11q) |
| 1.87 × 10⁻⁶ | Mutated | 6.9 | Positive | Del(13q) |
| 7.32 × 10⁻⁶ | Unmutated | 1.8 | Negative | Negative |
Time to blood MRD4 reemergence by FLC, according to EOT U-MRD status by NGS
Fifty-six patients had serial blood MRD4 by FLC performed approximately every 12 months during follow-up. Thirty of 56 patients (53.6%) have had reemergence of blood MRD4 by FLC. Median time to reemergence of blood MRD4 from the EOT was 51.6 months, which preceded clinical progression by a median of ∼2 years. Median time to next treatment was only marginally longer than time to progression, at ∼32 months, indicating that MRD reemergence predicted clinically important disease progression (Figure 4E).
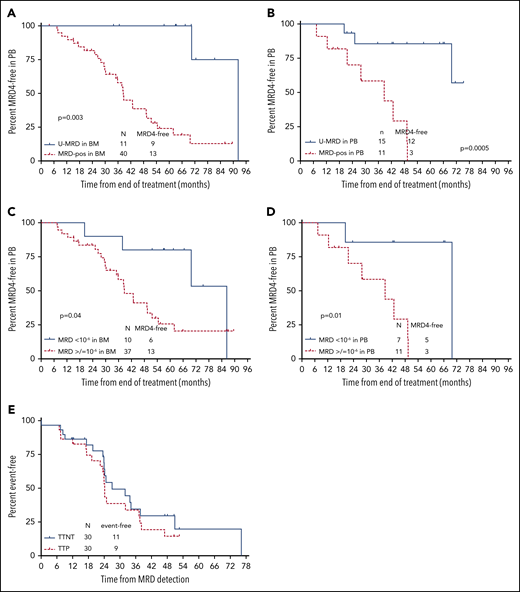
Time to MRD reemergence according to posttreatment MRD status by NGS. (A) Time to MRD reemergence, according to MRD status (detectable vs undetectable) in BM at the EOT, assessed by NGS. Testing for MRD reemergence was performed with 4-color FLC, in peripheral blood (PB). Fifty-one of 57 patients who had BM samples available for NGS MRD testing had serial PB FLC MRD results available in PB for this analysis. (B) Time to MRD reemergence according to NGS-MRD status (detectable vs undetectable) in PB. Twenty-six of 29 patients who had PBMC samples available had serial FLC MRD results available for this analysis. (C) Time to MRD reemergence according to NGS-MRD status (<10−6 vs ≥10−6) in BM. Of 51 patients with BM samples for NGS and serial FLC MRD in PB, 47 were included in this analysis. Four were excluded as they had U-MRD in BM by NGS, but sensitivity did not reach 10−6. (D) Time to MRD reemergence by NGS-MRD status (<10−6 vs ≥10−6) in PBMC. Of 26 patients with PBMC samples for NGS and serial FLC MRD performed in PB, 18 were included in this analysis. Eight were excluded as they had U-MRD in PBMC by NGS, but sensitivity did not reach 10−6. (E) Time to progression (TTP) and time to next treatment (TTNT) after reemergence of PB MRD. Thirty patients had reemergence of MRD by FLC during follow-up and were included in this analysis.
Time to MRD reemergence according to posttreatment MRD status by NGS. (A) Time to MRD reemergence, according to MRD status (detectable vs undetectable) in BM at the EOT, assessed by NGS. Testing for MRD reemergence was performed with 4-color FLC, in peripheral blood (PB). Fifty-one of 57 patients who had BM samples available for NGS MRD testing had serial PB FLC MRD results available in PB for this analysis. (B) Time to MRD reemergence according to NGS-MRD status (detectable vs undetectable) in PB. Twenty-six of 29 patients who had PBMC samples available had serial FLC MRD results available for this analysis. (C) Time to MRD reemergence according to NGS-MRD status (<10−6 vs ≥10−6) in BM. Of 51 patients with BM samples for NGS and serial FLC MRD in PB, 47 were included in this analysis. Four were excluded as they had U-MRD in BM by NGS, but sensitivity did not reach 10−6. (D) Time to MRD reemergence by NGS-MRD status (<10−6 vs ≥10−6) in PBMC. Of 26 patients with PBMC samples for NGS and serial FLC MRD performed in PB, 18 were included in this analysis. Eight were excluded as they had U-MRD in PBMC by NGS, but sensitivity did not reach 10−6. (E) Time to progression (TTP) and time to next treatment (TTNT) after reemergence of PB MRD. Thirty patients had reemergence of MRD by FLC during follow-up and were included in this analysis.
Time to blood MRD4 reemergence was longer in patients with U-MRD by NGS in BM or PBMC, dichotomized as U-MRD vs MRD+, regardless of sensitivity (Figure 4A-B) and analyzed as <10−6 vs ≥10−6 (Figure 4C-D).
Discussion
Assessment of MRD6 by NGS after first-line FCR treatment of CLL demonstrated that the majority of patients who achieved U-MRD4 status in BM had detectable MRD, below the 10−4 threshold. Patients with U-MRD by NGS had superior PFS compared with those who were MRD+, indicating that more sensitive MRD analysis provided additional prognostic information.
As technology improves, we will increasingly be able to detect very low-level MRD. FLC assays can now reliably achieve sensitivity of 10−5 in CLL using an 8-color flow cytometer30 and 10−6 in multiple myeloma using a 10-color flow cytometer.31 The optimal “cut-point” for MRD results remains to be determined and will likely be treatment and context dependent. Our data in this treatment setting suggest that considering results as either “detectable” or "undetectable,” regardless of assay sensitivity in an individual patient, achieved excellent prognostic discrimination, both in PBMC and in BM. However, for standardization of results and for widespread applicability, a dichotomous cutoff is required, and a minimum level of sensitivity must be set. Setting a threshold of <10−5 vs ≥105 in BM was prognostic; patient numbers were too small, however, to determine whether there was a difference in outcome for patients with MRD levels of 10−5 to 10−6 vs <10−6.
If results were dichotomized as <10−6 vs ≥10−6 (MRD6), a substantial number of patients, particularly when using PBMC samples, had undetectable MRD, but assay sensitivity did not reach 10−6. These patients had excellent outcomes; however, if strict 10−6 sensitivity is imposed for reporting, these data would be reported as unevaluable. These data can be attributed to the specimen concentration submitted for analysis. For the aforementioned specimens that contained less than the required 1.9 million cells worth of DNA to achieve a sensitivity of 10−6 (1.903 million reflects the limit of detection),32 the sensitivity of the assay was limited by the amount of cellular equivalents (genomic DNA) analyzed.27 The sensitivity of the NGS-MRD assay increases with increasing amounts of analyzed DNA. This study examined prospectively banked specimens that were not specifically collected for the purpose of NGS testing, which may, in part, explain why ∼30% of samples did not achieve sensitivity of at least 10−6 with 95% confidence interval. However, with prospective specimen collection ensuring adequate cellular equivalents, evaluation of MRD by NGS at 10−6 sensitivity can be achieved. Also of note, 3 patients had detectable disease below a level of 10−6 in BM, 2 of whom relapsed, suggesting that detecting even very low-level residual disease may still be prognostically relevant (ie, achieving even <10−6 MRD does not always indicate “cure”).
Although absolute MRD level is a critical prognostic feature, the question as to whether and when a patient will relapse likely remains more complex than simply the absolute level of MRD detectable posttreatment. Other factors, including disease compartmentalization and growth kinetics, are likely important in determining the likelihood and timing of eventual progression. Our study did not routinely use posttreatment CT scans, limiting our ability to determine the influence of residual nodal enlargement on relapse rate. The potential utility of ctDNA analysis for assessing nodal disease is discussed below. Regarding disease biology, we have previously shown a higher relapse rate in patients with MRD <10−4 after FCR treatment in those who have UM-IGHV compared with those with M-IGHV.1,4 Based on the data from the current study, disease biology remains important in 2 respects: first, patients were more likely to achieve U-MRD6 if they had M-IGHV compared with UM-IGHV and trisomy 12 compared with other FISH categories. In addition, if they had low-level MRD+ (10−6 to 10−4), they had shorter PFS if they had UM-IGHV or pretreatment B2M ≥4.0 mg/L, likely reflecting more rapid proliferation of CLL with UM-IGHV and/or high B2M. The number of patients with del(11q) or del(17p) was too small to assess the impact of these on PFS. Given the low number of relapses in this current analysis, particularly among patients with MRD level <10−6, analysis of larger data sets will be required to fully integrate pretreatment biological characteristics with MRD6 data to gain a comprehensive understanding of the likelihood of relapse in a specific patient. Notably, however, all 7 patients with MRD <10−5 in BM who subsequently relapsed had unfavorable pretreatment characteristics (either UM-IGHV or B2M ≥4.0 mg/L, or both), indicating that high-risk disease biology clearly negatively impacts PFS of patients with very low level residual disease.
In the current study, only 41% of patients with M-IGHV who had U-MRD4 had U-MRD by NGS. In our original FCR study, patients with U-MRD4 and M-IGHV had 79% PFS at a median follow-up of 12.8 years and plateaued on the PFS curve after 8 years. Within the limitations of cross-study comparison, it appears that the number of patients with U-MRD4 who have M-IGHV and achieved U-MRD by NGS in the current study (41%) is lower than the number of expected long-term disease-free survivors with U-MRD4 and M-IGHV from the FCR300 study (79%).1 This must be interpreted cautiously, given that the number of patients with U-MRD4 and M-IGHV tested in the current cohort is relatively small, and there were differences between the MRD4-detection technology used in the FCR300 cohort (ligase-based PCR, rather than FLC, was used) and the current cohort. Despite these caveats, we cannot exclude the possibility that some patients, particularly those with M-IGHV, who have low-level MRD6+ by NGS posttreatment, may potentially remain long-term disease-free survivors. Additional studies of follow-up samples from this cohort are planned to further elucidate the temporal dynamics of low-level residual disease.
The optimal sample type to use in CLL for MRD testing by NGS remains to be determined. In part, this will be dependent upon the specific clinical scenario. In the current cohort of patients treated with first-line FCR, the detection rate for very low-level residual disease was higher in BM than in PBMC, demonstrating a “compartment effect.” This is consistent with large data sets using chemoimmunotherapy and venetoclax-based regimens. Combined data from the CLL8 and CLL10 studies demonstrated that the rate of U-MRD by 4-color FLC in 351 patients with paired samples was considerably lower in BM (40.7%) than PBMC (64.9%).33 In addition, data from the venetoclax + rituximab arm of the MURANO study demonstrated a somewhat lower rate of U-MRD in BM than peripheral blood at the end of combination therapy (80% of patients with U-MRD4 in blood had U-MRD in BM).34 However, despite lower sensitivity, and with the caveat of relatively small numbers, the prognosis for patients with U-MRD by NGS in PBMC in the current study was generally excellent. At this time, no additional treatment is offered to eradicate low-level MRD (<10−4) after first-line treatment of CLL, given the generally favorable prognosis for such patients. Thus, if NGS-MRD is used for purely prognostic purposes, analysis of PBMC after first-line chemoimmunotherapy may be adequate. In the future, however, we envisage that treatment decisions may be made on the basis of highly sensitive MRD results: first, in patients where first-line treatment is given with curative intent, consolidation treatment may be offered to patients with high-risk biological features; second, in patients receiving venetoclax-based combinations, U-MRD4 or U-MRD6 may be used as a trigger for treatment discontinuation. In these scenarios, the most sensitive sample type (BM) may be preferred. Finally, ctDNA analysis using NGS to detect monoclonal VDJ rearrangements has proven to be a powerful tool for monitoring disease in DLBCL. It has been shown to predict DLBCL relapse prior to detection by CT15 or positron emission tomography/CT16 and to be significantly more sensitive for detecting disease progression than analysis of DNA in the PBMCs.16 In DLBCL, circulating lymphoma cells are generally uncommon, whereas there is also a higher rate of cell turnover and release of tumor DNA into the plasma35 than is likely the case in CLL. In this specific clinical setting (first-line treatment of CLL with FCR), analysis of plasma specimens for MRD did not appear to provide any advantage over analysis of PBMCs or BM. No MRD was detected in plasma in patients who were negative in blood or BM. In contrast, many patients had U-MRD in plasma, but detectable MRD6 in blood or BM. This suggests that detection of circulating or BM-resident CLL cells remains the mainstay of MRD detection in CLL in the setting of first-line chemoimmunotherapy treatment. However, the number of patients with plasma samples analyzed in this cohort was relatively small, and it may be that ctDNA MRD analysis proves to have a complementary role in subsets of patients treated with chemoimmunotherapy. In addition, there may be other scenarios in which ctDNA may prove to have an important role in MRD evaluation, analogous to DLBCL, such as Richter transformation or analysis of patients with predominantly nodal disease. Finally, in DLBCL, the use of CAPP-seq, due to the fact it allows monitoring of multiple mutations rather than solely BCR (IgH, IgK/L), was shown to be more sensitive for detecting low-level ctDNA than using IgH sequence.36 It is unclear whether the use of this technology to detect ctDNA will improve sensitivity for detection of tissue-resident CLL cells. Overall, the use of ctDNA analysis as an MRD-detection tool in CLL requires further study.
For original data, please contact wwierda@mdanderson.org.
The online version of this article contains a data supplement.
The publication costs of this article were defrayed in part by page charge payment. Therefore, and solely to indicate this fact, this article is hereby marked “advertisement” in accordance with 18 USC section 1734.
Acknowledgments
The authors acknowledge Joyce Breaker, who maintains the sample bank in the CLL group at MD Anderson Cancer Center and the contributions of the late Susan Lerner, and Mark Hess in the maintenance of the CLL database at MD Anderson Cancer Center. Editorial assistance was provided by Brian Haas, an employee of Adaptive Biotechnologies.
This work was supported, in part, by MD Anderson Cancer Center Support Grant P30 CA016672. NGS was performed free of charge by Adaptive Biotechnologies.
Adaptive Biotechnologies was not involved in the analysis and synthesis of the data, which were performed by P.A.T. and W.G.W.
Authorship
Contribution: P.A.T. collected and analyzed data, designed the study, provided clinical care to patients, and wrote the paper; J.S. and T.H. analyzed patient samples and cowrote the paper; P.S. collected data and cowrote the paper; J.L.J. performed flow cytometric analysis and cowrote the paper; M.J.K., S.M.O., A.F., J.A.B., Z.E., and N.J. provided clinical care to patients and cowrote the paper; W.G.W. designed the study, provided clinical care to patients, and wrote the paper; and C.P. performed statistical analysis and cowrote the paper.
Conflict-of-interest disclosure: P.A.T. has received research funding from Pharmacyclics, AbbVie, Genentech, Amgen, Pfizer, Adaptive Biotechnologies and serves on the advisory board or as consultant for Pharmacyclics, AbbVie, Genentech, Gilead, Amgen. S.M.O. has received research support from Kite, Regeneron, Acerta, Gilead, Pharmacyclics, TG Therapeutics, Pfizer, and Sunesis and serves as a consultant to Amgen, Astellas, Celgene, GlaxoSmithKline, Janssen Oncology, Aptose Biosciences Inc, Vaniam Group LLC, Abbvie, Alexion, Gilead, Pharmacyclics, TG Therapeutics, Pfizer, Sunesis. J.S. and T.H. are employed by Adaptive Biotechnologies. N.J. has received research funding from Pharmacyclics, Abbvie, Genentech, BMS, Pfizer, ADC Therapeutics, Incyte, Celgene, AstraZeneca, Servier, Verastem, Cellectis, and Adaptive Biotechnologies and serves on the advisory board or receives honoraria from Pharmacyclics, Abbvie, Verastem, Novartis, ADC Therapeutics, Pfizer, Servier, Novimmune, Adaptive Biotechnologies, Janssen, and AstraZeneca. M.J.K. serves as a consultant or as an advisory board member for Celgene and Roche. W.G.W. serves as advisor/consultant for Genzyme Corporation and has contracted research from GSK/Novartis, Abbvie, Genentech, Karyopharm, Pharmacyclics, Acerta Pharmaceuticals, Gilead Sciences, Juno Therapeutics, KITA Pharma, Sunesis, Miragen, Oncternal Therapeutics, Inc, Cyclacel, Loxo Oncology, Inc, Janssen Oncology, and Xencor. The remaining authors declare no competing financial interests.
Correspondence: William G. Wierda, Department of Leukemia, 1515 Holcombe Blvd, Unit 428, Houston, TX 77030; e-mail: wwierda@mdanderson.org.
