

TO THE EDITOR:
B1 cells were first described in 1983 as a rare B-lymphocyte subpopulation that spontaneously secreted immunoglobulin M (IgM) and appeared to be distinguished from B2 cells.1 The functional properties, phenotype, and ontogeny of B1 cells differ from those of B2 cells.2 In mice, B1 cells emerge independently of hematopoietic stem cells (HSCs) during early embryonic development3,4 and are then produced by HSCs or HSC-derived progenitors in the fetal liver and in neonatal and adult bone marrow,5 whereas B2 cells are generated from HSCs. In contrast to murine B1 cells, the characteristics of human B1 cells had not been well understood. In 2011, it was reported that human B1 cells have the phenotype CD20+CD27+CD43+CD70−.6 However, these cells were later found to include CD20+CD38hi precursors to plasmablasts or preplasmablasts.7,8 Consequently, CD20+CD27+CD43+CD38lo/int is currently regarded as a more accurate phenotype of human B1 cells.8 B1 cells are detected in adult human peripheral blood (PB) at a frequency of between 1% and 9% of B cells.6,9,10 However, the developmental origin of human B1 cells remains elusive.
To elucidate whether human B1 cells are derived from adult HSCs, we used a unique characteristic of patients with paroxysmal nocturnal hemoglobinuria (PNH), a clonal disorder of HSCs caused by somatic mutations in PIGA that encodes the protein essential for glycophosphatidylinositol (GPI)-anchor biosynthesis.11-13 Importantly, the PIGA-mutated HSCs retain their multilineage differentiation capacity, and these mutations can be exploited to identify cells derived from adult HSCs. Because PIGA mutations abolish cell-surface GPI-anchored proteins (GPI-APs), we separated the mutated cells by the absence of GPI-APs.14
We enrolled 6 patients with a median time from PNH diagnosis of 10 years (range, 3-28 years; Table 1). PB samples were obtained from these PNH patients (who gave written informed consent) and stored at the Mie University Biobank Research Center. The study design was approved by the Independent Ethics Committee for Human Research at Mie University Graduate School of Medicine and was conducted in accordance with the Declaration of Helsinki. At the time of the first or second sampling, 3 patients were being treated with eculizumab alone, 1 with eculizumab and cyclosporin A, 1 with metenolone and red blood cell transfusion, and 1 with cyclosporin A alone.12,15 Isolated PB cells were stained with fluorochrome-conjugated monoclonal antibodies (supplemental Table 1, available on the Blood Web site). Because fluorescent-labeled inactive toxin aerolysin (FLAER; Cedarlane, Burlington, ON, Canada) specifically and strongly binds to all cell-surface GPI-APs, FLAER was used to detect GPI-AP–deficient cells. Samples were analyzed and sorted into each cell population. Genomic DNA was extracted from sorted cells. The exons of the PIGA-coding region were amplified by polymerase chain reaction (PCR), and the products were sequenced. Allelic frequencies of PIGA mutations of genomic DNA from patients PNH01 and PNH02 were estimated by digital PCR (supplemental Table 2). Genomic DNA of PNH01 was amplified using PCR primers covering the 2 mutation sites and was used for sequencing. Further details of the experimental procedures are provided in the supplemental Materials and methods.
Characteristics of PNH patients
| Patient | Sex | Sampling time point | Age at sampling, y | Time after diagnosis, y | WBC, ×109/L | Hb, g/dL | Platelets, ×109/L | LDH, IU/L* | Treatment at sampling |
|---|---|---|---|---|---|---|---|---|---|
| PNH01 | Female | First | 44 | 20 | 2.4 | 9.3 | 101 | 274 | Eculizumab |
| Second† | 46 | 22 | 5.3 | 9.6 | 142 | 192 | Eculizumab | ||
| PNH02 | Female | First | 54 | 28 | 3.8 | 11.9 | 194 | 195 | Eculizumab |
| Second‡ | 57 | 31 | 3.3 | 11.5 | 119 | 205 | Eculizumab | ||
| PNH03 | Female | First | 83 | 15 | 1.6 | 10.4 | 107 | 208 | Eculizumab |
| Second§ | 86 | 18 | 1.5 | 9.8 | 111 | 215 | Eculizumab | ||
| PNH04 | Female | First | 63 | 3 | 6.3 | 7.1 | 41 | 168 | Cyclosporin A; eculizumab |
| PNH05 | Female | First | 49 | 5 | 3.7 | 6.8 | 180 | 1898 | Metenolone; RBC transfusion |
| PNH06 | Female | First | 28 | 3 | 5.5 | 10.6 | 191 | 670 | Cyclosporin A |
Hb, hemoglobin; LDH, lactate dehydrogenase; RBC, red blood cell; WBC, white blood cell.
Normal range, 110 to 225 IU/L.
After 24 months from first sampling.
After 29 months from first sampling.
After 35 months from first sampling.
Granulocytes and monocytes were identified by CD45 and side scatter, and confirmed to be CD11bhi and CD33hi, respectively. B-cell subpopulations were defined as follows: B1 cells, CD19+CD20+CD27+CD43+CD38lo/int; naive B cells, CD19+CD20+CD27−CD43−CD38lo/int; and memory B cells, CD19+CD20+CD27+CD43−CD38lo/int (Figure 1A). T cells and natural killer (NK) cells were identified as CD3+CD19−CD33− and CD3−CD19−CD33−CD56+, respectively. GPI-AP–deficient cells were identified as being FLAER− cells (Figure 1B).16 The proportion of FLAER− PNH cells in each cell population varied among the first samples taken from all 6 patients, consistent with previous reports.17-19 Granulocytes and monocytes had the highest proportions of FLAER− cells in all 6 patients (ranges, 68.5% to 100% and 75.3% to 100%, respectively; Figure 1C; supplemental Table 3). The absolute number of B1 cells varied among the samples and ranged from 2.17 × 10⁶/L to 14.52 × 10⁶/L (Figure 1D; supplemental Table 4). All 6 samples analyzed contained PNH phenotype cells in the B1 cell fraction (ranges, 3.79% to 8.39% and 0.11 × 10⁶/L to 0.80 × 10⁶/L; Figure 1C,E; supplemental Tables 3 and 4). Potential explanations for the low proportion of FLAER− B1 cells are not obvious. Approximately 50% of FLAER− B1 cells from patients PNH02 and PNH03 expressed IgM and IgD (supplemental Figure 1), compatible with the proposal by Rothstein et al.20 These data indicate that a population of B1 cells is derived from PIGA-mutated HSCs. The frequency of B1 cells did not differ significantly between FLAER− and FLAER+ cells in the CD19+CD20+CD38lo/int cell population (supplemental Figure 2). It seems unlikely that GPI-AP deficiency could influence the development of B1 cells. The second analyses in patients PNH01, PNH02, and PNH03 at the 24-, 29-, and 35-month intervals, respectively, again showed variability in the proportion of FLAER− cells in each cell population (Figure 1C,E; supplemental Table 3). Whereas a certain amount of FLAER− naive B cells was observed in all samples (range, 2.73% to 50.8%), the fraction of FLAER− memory B cells was extremely small (range, 0.04% to 1.96%). It is possible that GPI-AP deficiency might affect the formation and/or maintenance of memory B cells. Another possibility is that nearly all FLAER− memory B cells are generated before the onset of PNH and have a long lifespan.
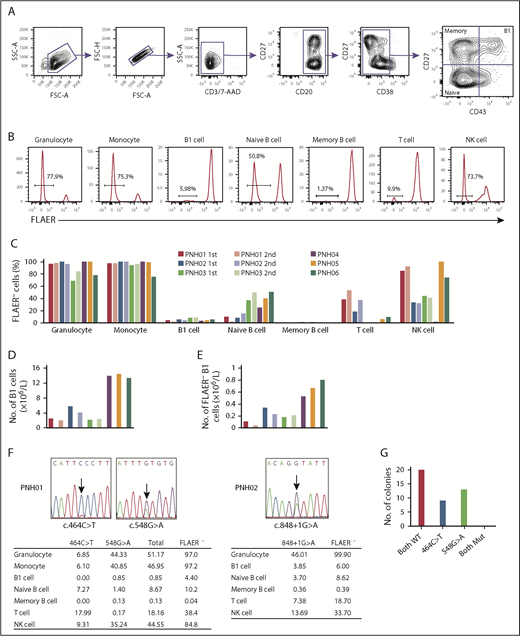
GPI-AP deficiency and PIGA mutations in each cell population of PB from PNH patients. (A) Gating strategy to analyze and sort B1 cells and other B-lineage cells from PNH patients. CD19 cells were enriched using microbeads and gated as shown. Doublets were excluded based on forward scatter (FSC) profiles, and dead cells and T cells were excluded by gating 7-aminoactinomycin D–negative (7-AAD−) and CD3− cells, respectively. B-cell subsets were defined as: B1 cells, CD19+CD20+CD27+CD43+CD38lo/int; naive B cells, CD19+CD20+CD27−CD43−CD38lo/int; and memory B cells, CD19+CD20+CD27+CD43−CD38lo/int. (B) Representative histograms of FLAER staining in granulocytes, monocytes, B1 cells, naive B cells, memory B cells, T cells, and natural killer (NK) cells from PNH06. Percentages indicate FLAER− cells. (C) Percentages of FLAER− cells in the indicated PB-cell populations in the first and second samples from the 6 PNH patients. Second samples were obtained from PNH01, PNH02, and PNH03. (D) Absolute numbers of B1 cells. The absolute numbers of B1 cells were calculated by multiplying the number of CD19+ cells by the percentage of B1 cells in CD19+ cells (supplemental Table 4). (E) Absolute numbers of FLAER− B1 cells. The absolute numbers of FLAER− B1 cells were calculated by multiplying the number of B1 cells by the percentage of FLAER− B1 cells (supplemental Table 4). (F) Sanger sequences of the PIGA gene indicating the 2 mutations in PNH01 and 1 mutation in PNH02. The tables below show the percentages of the PIGA-mutated allele frequencies in each cell population measured by digital PCR. (G) Results of sequencing of bacterial colonies transfected with plasmids carrying genomic DNA from PNH01. FSC-A, FSC–area; FSC-H, FSC–height; Mut, mutated; SSC-A, side scatter–area; WT, wild type.
GPI-AP deficiency and PIGA mutations in each cell population of PB from PNH patients. (A) Gating strategy to analyze and sort B1 cells and other B-lineage cells from PNH patients. CD19 cells were enriched using microbeads and gated as shown. Doublets were excluded based on forward scatter (FSC) profiles, and dead cells and T cells were excluded by gating 7-aminoactinomycin D–negative (7-AAD−) and CD3− cells, respectively. B-cell subsets were defined as: B1 cells, CD19+CD20+CD27+CD43+CD38lo/int; naive B cells, CD19+CD20+CD27−CD43−CD38lo/int; and memory B cells, CD19+CD20+CD27+CD43−CD38lo/int. (B) Representative histograms of FLAER staining in granulocytes, monocytes, B1 cells, naive B cells, memory B cells, T cells, and natural killer (NK) cells from PNH06. Percentages indicate FLAER− cells. (C) Percentages of FLAER− cells in the indicated PB-cell populations in the first and second samples from the 6 PNH patients. Second samples were obtained from PNH01, PNH02, and PNH03. (D) Absolute numbers of B1 cells. The absolute numbers of B1 cells were calculated by multiplying the number of CD19+ cells by the percentage of B1 cells in CD19+ cells (supplemental Table 4). (E) Absolute numbers of FLAER− B1 cells. The absolute numbers of FLAER− B1 cells were calculated by multiplying the number of B1 cells by the percentage of FLAER− B1 cells (supplemental Table 4). (F) Sanger sequences of the PIGA gene indicating the 2 mutations in PNH01 and 1 mutation in PNH02. The tables below show the percentages of the PIGA-mutated allele frequencies in each cell population measured by digital PCR. (G) Results of sequencing of bacterial colonies transfected with plasmids carrying genomic DNA from PNH01. FSC-A, FSC–area; FSC-H, FSC–height; Mut, mutated; SSC-A, side scatter–area; WT, wild type.
Two PIGA mutations (c.464C>T and c.548G>A) were identified in PNH01 (Figure 1F). Follow-up bacterial cloning analysis demonstrated that the mutations were not present in the same clones (Figure 1G). A single PIGA mutation (c.848+1G>A) was identified in PNH02 (Figure 1F). We sorted each leukocyte subpopulation and measured the mutated allelic frequency by digital PCR with mutation-specific TaqMan probes. Because patients PNH01 and PNH02 were both female, 1 of the 2 X chromosomes, where the PIGA gene is located, is inactivated and a PIGA mutation in 1 allele renders cells negative for FLAER. This fact is compatible with our finding that the percentage of cells with PIGA gene mutations in each cell population was approximately one-half that of the FLAER− cells detected by flow cytometry (Figure 1F). Notably, the same mutations detected in B1 cells were also observed in other cell lineages.
Two experimental strategies have been used to examine the origin of B1 cells, namely xenotransplantation and gene-labeling assays. Quách et al recently reported that HSCs from adult human bone marrow and human cord blood produce B1 cells after transplantation into immunodeficient mice.21 However, it is possible that a small amount of B1 cells or their progenitors was included among the transplanted cells. In the second approach, Sawai et al designed an HSC-selective inducible lineage-tracing technique in mice and found that <5% of B1 cells were labeled, compared with >50% of conventional B2 cells.22 Because a comparable experiment cannot be conducted in humans, we took advantage of the naturally occurring clonal mutations present in PNH patients, which allowed us to analyze unmanipulated PB cells. Using such a strategy, Corat et al reported the existence of a long-lived, adaptive NK-cell population.23
The present study shows that a population of B1 cells in PNH patients is deficient for GPI-APs and carries PIGA mutation(s). These results offer the possibility that a small, but distinct, proportion of B1 cells may be derived from adult HSCs, although they were obtained from an investigation conducted in diseased patients.
For original data, please contact n-kata@clin.medic.mieu.ac.jp.
The online version of this article contains a data supplement.
Acknowledgments
The authors thank all clinicians who contributed materials, particularly A. Sawaki (Yokkaichi Municipal Hospital), T. Yamaguchi (Suzuka Chuo General Hospital), and Y. Uemura (Saiseikai Matsusaka General Hospital). The authors acknowledge the Mie University Biobank Research Center for sample preservation and the Mie University Center for Molecular Biology and Genetics for technical assistance. The authors thank Anne M. O’Rourke, Mitchell Arico, and Michelle Kahmeyer-Gabbe from Edanz Group (www.edanzediting.com/ac) for editing a draft of this manuscript.
This work was supported by the Japan Society for the Promotion of Science Grants-in-Aid for Scientific Research (KAKENHI grant numbers 17K099230, 16K093070, and 17K099490).
Authorship
Contribution: Y.K., H.M., and N.K. designed the study; Y.K. performed the experiments, analyzed the data, and created the figures; Y.K., H.M., I.T., K.O., and M.M. analyzed the data; Y.K and H.M. wrote the manuscript; N.K. reviewed and edited the manuscript; and all authors approved the final version of the manuscript.
Conflict-of-interest disclosure: The authors declare no competing financial interests.
Correspondence: Naoyuki Katayama, Department of Hematology and Oncology, Mie University Graduate School of Medicine, 2-174 Edobashi, Tsu, Mie 514-8507, Japan; e-mail: n-kata@clin.medic.mie-u.ac.jp.

This feature is available to Subscribers Only
Sign In or Create an Account Close Modal