

Key Points
Cryptic insertions of immunoglobulin light-chain enhancers are associated with CCND2 and CCND3 overexpression in cyclin D1− MCLs.
Most cyclin D1− MCLs had CCND2 or CCND3 rearrangements whereas a small subset show upregulation of CCNE1 and CCNE2.

Abstract
Mantle cell lymphoma (MCL) is characterized by the t(11;14)(q13;q32) translocation resulting in overexpression of cyclin D1. However, a small subset of cyclin D1− MCL has been recognized, and approximately one-half of them harbor CCND2 translocations while the primary event in cyclin D1−/D2− MCL remains elusive. To identify other potential mechanisms driving MCL pathogenesis, we investigated 56 cyclin D1−/SOX11+ MCL by fluorescence in situ hybridization (FISH), whole-genome/exome sequencing, and gene-expression and copy-number arrays. FISH with break-apart probes identified CCND2 rearrangements in 39 cases (70%) but not CCND3 rearrangements. We analyzed 3 of these negative cases by whole-genome/exome sequencing and identified IGK (n = 2) and IGL (n = 1) enhancer hijackings near CCND3 that were associated with cyclin D3 overexpression. By specific FISH probes, including the IGK enhancer region, we detected 10 additional cryptic IGK juxtapositions to CCND3 (6 cases) and CCND2 (4 cases) in MCL that overexpressed, respectively, these cyclins. A minor subset of 4 cyclin D1− MCL cases lacked cyclin D rearrangements and showed upregulation of CCNE1 and CCNE2. These cases had blastoid morphology, high genomic complexity, and CDKN2A and RB1 deletions. Both genomic and gene-expression profiles of cyclin D1− MCL cases were indistinguishable from cyclin D1+ MCL. In conclusion, virtually all cyclin D1− MCLs carry CCND2/CCND3 rearrangements with immunoglobulin genes, including a novel IGK/L enhancer hijacking mechanism. A subset of cyclin D1−/D2−/D3− MCL with aggressive features has cyclin E dysregulation. Specific FISH probes may allow the molecular identification and diagnosis of cyclin D1− MCL.
Introduction
Mantle cell lymphoma (MCL) is a mature B-cell malignancy genetically characterized by the primary translocation t(11;14)(q13;q32) found in the vast majority of cases.1-3 This translocation juxtaposes the CCND1 gene to an enhancer of the immunoglobulin heavy-chain gene (IGH) leading to constitutive cyclin D1 upregulation. Nevertheless, a small subset of MCL lacks cyclin D1 overexpression and the t(11;14) (cyclin D1− MCL).4-10 These cases have similar morphology, phenotype, gene-expression profile, genomic alterations, and clinical behavior as conventional cyclin D1+ MCL.5,11,12 SOX11 is a transcriptional factor constantly overexpressed in most MCLs independent of the expression of cyclin D1 and, therefore, it is a useful marker to recognize cyclin D1− MCL cases.11
Interestingly, the first 6 cyclin D1− MCLs identified in the Lymphoma/Leukemia Molecular Profiling Project showed overexpression of cyclin D2 or cyclin D3, but evidence of chromosomal rearrangements affecting these loci was not found by fluorescence in situ hybridization (FISH) using break-apart probes.4 However, different reports have detected occasional cyclin D1− MCL cases with high levels of cyclin D2 due to chromosomal translocations with immunoglobulin genes, that is, t(2;12)(p11;p13) [IGK/CCND2],6,8 t(12;22)(p13;q21) [CCND2/IGL],7 and a t(12;14)(p13;q32) [CCND2/IGH].9 In the largest series of cases analyzed, we identified 55% cases (22 of 40) with CCND2 rearrangement, preferentially with immunoglobulin light chains (68%), but CCND3 rearrangement was not identified in the remaining cases using standard break-apart probes.5 So far, only 1 single MCL case with CCND3/IGH rearrangement has been reported.8
Overall, the potential role of CCND2 and CCND3 translocations as alternative pathogenic mechanisms to CCND1 rearrangement in cyclin D1− MCL is not yet fully understood because not all reports of rearrangements were coupled with expression studies of the rearranged cyclins or with SOX11 expression. To clarify the genetic mechanisms behind cyclin D1− MCL, we performed an integrative analysis including a complete FISH panel, next-generation sequencing (NGS), and gene-expression and copy-number arrays, in a large series of well-characterized cyclin D1− MCL.
Methods
Patients and samples
A total of 56 cyclin D1− MCL cases (28 partially investigated in previous studies)4,5 were included in the current project based on (i) morphology and phenotype consistent with MCL (CD5+ and CD23−), (ii) absence of cyclin D1 expression and t(11;14)(q13;q32), and (iii) SOX11 expression. The main clinicopathological and molecular features of the patients are described in Table 1. DNA/RNA extraction was performed from formalin-fixed and paraffin-embedded (FFPE) tissue blocks in 52 samples, fresh-frozen material in 7 samples, and Carnoy-fixed cells in 2 samples. The study was approved by the institutional review board of the Hospital Clinic of Barcelona.
Clinicopathological and molecular features of the 56 cyclin D1−MCLs
| Parameter | Total, n = 56 | Cyclin D2+, n = 43 | Cyclin D3+, n = 9 | Cyclin E+, n = 4 | P |
|---|---|---|---|---|---|
| Median age, y | 65 | 66 | 60 | 75 | .161 |
| Ratio male/female | 2.4/1 | 3.2/1 | 2/1 | 0/1 | .029* |
| Growth pattern (%) | 1 | ||||
| Nodular and/or diffuse | 50/52 (96) | 40/42 (95) | 6/6 (100) | 4/4 (100) | |
| Mantle zone | 2/52 (4) | 2/42 (5) | 0/6 (0) | 0/4 (0) | |
| Morphology (%) | .029* | ||||
| Classical | 43 (81) | 34/40 (85) | 8/9 (89) | 1/4 (25) | |
| Blastoid | 10 (19) | 6/40 (15) | 1/9 (11) | 3/4 (75) | |
| Expression (%) | |||||
| SOX11+ | 56 (100) | 43/43 (100) | 9/9 (100) | 4/4 (100) | 1 |
| CD5+ | 54/55 (98) | 43/43 (100) | 7/8 (88) | 4/4 (100) | .218 |
| CD23− | 47/47 (100) | 36/36 (100) | 7/7 (100) | 4/4 (100) | 1 |
| CD10− | 39/39 (100) | 31/31 (100) | 4/4 (100) | 4/4 (100) | 1 |
| Ig λ light-chain restriction | 20/25 (80) | 15/19 (79) | 3/3 (100) | 2/3 (67) | 1 |
| Ki67 (≥30%) | 24/42 (57) | 18/33 (55) | 2/5 (40) | 4/4 (100) | .153 |
| Median expression (qPCR) | |||||
| CCND2 | 17.0 | 124.8 | 7.0 | 4.8 | <.001* |
| CCND3 | 2.0 | 1.8 | 18.9 | 2.6 | <.001* |
| CCNE1 | 1.0 | 1.1 | 0.9 | 7.6 | .009* |
| CCNE2 | 0.8 | 0.8 | 0.6 | 3.8 | .077 |
| Molecular | |||||
| Median CNA per case | 10 | 9 | 9 | 17 | .098 |
| Chromothripsis (%) | 10/42 (24) | 6/29 (21) | 3/9 (33) | 1/4 (25) | .847 |
| −17p13/TP53 (%) | 8/42 (19) | 8/29 (28) | 0/9 (0) | 0/4 (0) | .144 |
| −11q22/ATM (%) | 14/42 (33) | 9/29 (31) | 5/9 (55) | 0/4 (0) | .140 |
| −9p21/CDKN2A (%) | 20/42 (48) | 14/29 (48) | 2/9 (22) | 4/4 (100) | .033* |
| −13q14/RB1 (%) | 17/42 (40) | 9/29 (31) | 4/9 (44) | 4/4 (100) | .030* |
| +18q (%) | 15/42 (36) | 8/29 (28) | 3/9 (33) | 4/4 (100) | .025* |
| +3q (%) | 23/42 (55) | 18/29 (62) | 3/9 (33) | 2/4 (50) | .378 |
| −1p (%) | 16/42 (38) | 10/29 (34) | 6/9 (67) | 0/4 (0) | .049* |
| Clinical data (%) | |||||
| Treated at diagnosis† | 38/41 (93) | 27/29 (93) | 7/8 (88) | 4/4 (100) | .589 |
| High-dose therapy | 2/41 (5) | 2/29 (7) | — | — | |
| Immunochemotherapy | 25/41 (61) | 18/29 (62) | 3/8 (38) | 4/4 (100) | |
| Other | 11/41 (27) | 7/29 (24) | 4/8 (50) | — | |
| Observation | 3/41 (7) | 2/29 (7) | 1/8 (13) | — | |
| 3-y overall survival, % (95% CI) | 68 (54-86) | 59 (42-83) | 100 (100-100) | 75 (43-100) | .424 |
—, no cases; CI, confidence interval; Ig, immunoglobulin.
P < .05 was considered significant. P values were calculated using the Fisher’s exact and Kruskal-Wallis tests for categorical or continuous variables between the 3 groups, respectively.
High-dose therapy includes cytarabine-based immunochemotherapy; immunochemotherapy includes rituximab plus cyclophosphamide, doxorubicin, vincristine, and prednisone (R-CHOP) and R-CHOP–like regimens; and other includes low-dose therapy (alkylating agents alone or in combination) and radiotherapy.
Cytogenetic analyses
FISH analyses were performed on FFPE tissue sections or fixed cells from cytogenetic cultures. The FISH panel used to interrogate breaks and juxtapositions of the loci CCND2, CCND3, CCNE1, CCNE2, IGH, IGL, and IGK including both commercial and bacterial artificial chromosome (BAC)-labeled probes is detailed in supplemental Table 1 (available on the Blood Web site). The extraction and labeling of BAC and P1-derived artificial chromosome DNA, preparation of slides, and hybridization were performed according to standard procedures.13 Each clone was first tested individually by hybridization on normal metaphases. Hybridizations were analyzed using standard fluorescence microscopes (Nikon Eclipse 50i or Zeiss) equipped with appropriate filter sets. Acquisition and processing of digital images were performed using the ISIS FISH Imaging System (MetaSystems, Altlussheim, Germany). For the detection of IGK cryptic insertions, 2 overlapping BAC clones covering the IGK enhancer region were selected, labeled, and hybridized together with CCND2-, CCND3-, CCNE1-, or CCNE2-specific probes with different fluorochromes. Negative tissue controls for these FISH experiments included 1 reactive lymph node, 4 chronic lymphocytic leukemias (CLLs), 6 diffuse large B-cell lymphomas (DLBCLs), 1 follicular lymphoma, and 1 splenic marginal zone lymphoma (SMZL). To verify CCNE2 gain, we used simultaneously CCNE2 (8q22) and chr8 centromeric probes. Conventional cytogenetics was performed on G-banded chromosomes and results were described according to An International System for Human Cytogenomic Nomenclature (ISCN).14
NGS analyses
Somatic structural variants (SVs) were analyzed by different NGS approaches in 5 MCL cases: long-insert-size (7-10 kb), mate-pair whole genome sequencing (MP-WGS) of 4 tumors and 10 normal unmatched DNA; paired-end whole-genome sequencing (WGS) of tumor and matched normal sample of 1 patient; and whole-exome sequencing (WES) in 3 tumors (supplemental Figure 1; supplemental Table 2).15,16 Libraries were constructed according to standard protocols (Illumina), and sequencing was performed with an Illumina HiSeq 2000 instrument.15 Reads were mapped to the hg19 human reference genome using the Burrows-Wheeler aligner (BWA-MEM version 0.7.5a-r405). Polymerase chain reaction (PCR) duplicates were removed using the MarkDuplicates algorithm from Picard tools. SVs were analyzed using different pipelines: (i) BWA with the “samse” option was used for MP-WGS analysis in combination with custom scripts to detect interchromosomal translocations supported by at least 4 reads, followed by visual inspection (ID3, ID6, ID73, and ID76), (ii) Smufin17 and Lumpy18 were used to detect SVs in the WGS of case ID73, and (iii) custom scripts were used to analyze/confirm potential interchromosomal SVs in the WES data (ID3, ID5, and ID6). We excluded SVs in repetitive or ambiguously aligned regions in the MP-WGS analysis. Due to the lack of germline DNA for most samples, SVs present both in 2 or more of the 4 MP-WGS and 1 or more of 10 normal samples or present in dbVar were removed as potential germline variants/artifacts. In case ID73, copy-number alterations (CNAs) from WGS were analyzed using FREEC19 and ASCAT algorithms, whereas single-nucleotide variants and indels were analyzed using 3 different pipelines: Smufin,17 Sidrón,20 and Mutect2,21 and annotated by Annovar. Verification of breakpoints (supplemental Table 3) and mutations was performed by Sanger sequencing.
Gene-expression and copy-number analyses
Total RNA from 14 cyclin D1− MCLs and 7 cyclin D1+ MCLs was extracted from FFPE tissue biopsies, processed using SensationPlus FFPE Amplification and the 3′ IVT Labeling Kit, and hybridized on GeneChip Human Genome U133 Plus 2.0 arrays (Thermo Fisher Scientific, Waltham, MA). Arrays were washed and stained using GeneChip Fluidics Station 450 (Thermo Fisher Scientific) and GeneChip Scanner. Limma22 was used to detect differentially expressed probe sets, and P values were adjusted by the Benjamini-Hochberg method. In 38 cyclin D1− MCLs, 4 CLLs, and 16 normal samples, gene-expression levels of CCND2, CCND3, CCNE1, and CCNE2 were investigated by quantitative PCR (qPCR) as previously described,5 using GUSB as endogenous control and Universal Human Reference RNA as a calibrator (supplemental Tables 2 and 4). qPCR for CCNE1 and CCNE2 was also analyzed in 3 blastoid MCLs, 6 DLBCLs, and 7 SMZLs. Cyclin E1 protein expression was analyzed by immunohistochemistry (antibody clone sc-247, dilution 1/100; Santa Cruz Biotechnology) in 12 cyclin D1− MCLs, 1 CLL, 2 SMZLs, and in control tissues (testis as positive control and tonsil and reactive lymph node as negative controls). CNAs were evaluated in 42 cyclin D1− cases (47 samples) with different approaches including: CGH-array Agilent 1M (Agilent, Santa Clara, CA), and single-nucleotide polymorphism (SNP) arrays 500K, SNP6.0, or Oncoscan CNV (Thermo Fisher Scientific) (supplemental Table 2). CNA analysis was performed using Nexus Biodiscovery version 9.0 software (Biodiscovery, Hawthorne, CA) as previously described.5,16 All cases were visually inspected by at least 2 independent observers.
Results
Identification of cryptic rearrangements of IGK and IGL enhancer regions and cyclin D genes in cyclin D1− MCL
To understand the molecular alterations present in cyclin D1− MCL cases, we initially performed FISH analysis using CCND2, IGH, IGK, and IGL break-apart probes in 56 cyclin D1− MCLs and identified 39 cases (70%) with CCND2 rearrangements (cyclin D2+ MCL), preferentially involving light chains IGK (55%) and IGL (13%) (supplemental Figure 1). The remaining 17 patients (30%) without CCND2 rearrangements were analyzed using a CCND3 break-apart FISH probe but none of them showed rearrangements. Detailed FISH results of all cases are listed in supplemental Table 5.
To investigate the presence of potential rearrangements that might have been undetectable by standard FISH approaches, we performed MP-WGS in 2 cases that were negative for FISH rearrangements of CCND2 and CCND3 (ID3 and ID6). We detected several somatic interchromosomal SVs (4 in ID3 and 6 in ID6) (Figure 1A; supplemental Table 6). Strikingly, both cases showed a similar rearrangement involving IGK in chromosome 2 and CCND3 in chromosome 6, which consisted of a small insertion (26.6 kb for ID3 and 27.3 kb for ID6) including the IGK enhancer. Virtually the entire IGK enhancer (26.4 kb), as defined by chromatin states in normal mature B cells,23 was integrated upstream of the CCND3 gene (8.4 kb upstream in case ID6 and 65 kb in case ID3). The allelic fraction of the alterations was ∼41% to 44%, suggesting that they were present in virtually all tumor cells. We confirmed these cryptic insertions by Sanger sequencing in both cases and we could identify the breakpoint at single-nucleotide resolution (Figure 1B). This insertion was also observed by WES in case ID6. In addition, we validated these findings by FISH in case ID3 using a new combination of fusion probes, 1 covering the CCND3 gene and the other including the enhancer of IGK (IGK-enh) (Figure 1C). Additionally, WES analysis of case ID5 (also negative for FISH with CCND3 break-apart probe) revealed a similar cryptic insertion of the IGL enhancer region in chromosome 22 near 3′ of the CCND3 gene, which was further verified by Sanger sequencing (Figure 1B). Interestingly, those 3 cases (ID3, ID5, and ID6) in which we identified the cryptic IGK/L enhancer and CCND3 rearrangement (enhancer hijacking) were initially reported to have cyclin D3 overexpression by microarray-expression analysis,4 highlighting the functional impact of the cryptic rearrangement at the messenger RNA (mRNA) level, and the potential utility of cyclin D2/D3 expression to help to identify these tumors with cryptic rearrangements in the absence of conventional translocation of the cyclins.
![Figure 1. Cryptic insertions of immunoglobulin light-chain enhancer regions near the CCND3 gene in 3 cyclin D1−MCL. (A) Circos plots with interchromosomal SVs detected by MP-WGS (black lines) and CNA detected by copy-number arrays (blue for gains and red for losses) in cases ID6 and ID3. The rearrangement between chr2 (IGK-enh) and chr6 (CCND3) in both cases is indicated with a discontinuous line. (B) Schematic representation of the 6p region around the CCND3 locus showing the location of the cryptic insertion of the IGK-enh (chr2) close to 5′ of the CCND3 gene in cases ID6 and ID3 (the length of the inserted fragments is indicated), and the location of the cryptic insertion of the IGL enhancer (chr22) near 3′ of the CCND3 gene in case ID5. The breakpoints were detected by MP-WGS (cases ID3 and ID6), and WES (case ID5), and further verified and refined to base pair resolution by Sanger sequencing in the 3 cases. There were 1-, 2-, and 3-bp homology at the breakpoint junctions, respectively. (C) Verification of the cryptic IGK/CCND3 insertion by FISH in case ID3 using the fusion probe IGK-enh (labeled in green) with CCND3 (labeled in red). FISH analysis shows 2 red and 2 green signals in normal cells and the yellow arrows highlight cells with 1 red and 1 small green signal juxtaposed, indicating the presence of the IGK insertion. Magnifications of cells with the rearrangement are shown at the right side (4′,6-diamidino-2-phenylindole [DAPI] stain; original magnification ×100). *Breakpoints estimated from MP-WGS data. enh, enhancer.](https://ash.silverchair-cdn.com/ash/content_public/journal/blood/133/9/10.1182_blood-2018-07-862151/4/m_blood862151f1.png?Expires=1769150031&Signature=QOZrhaiVrWZOl9az7FJfyTnCB0QGiRjfW70pa7kv4WCEbzAUlbPY-s04C6DjFhUenP~NEu7xM0vJdhPaIfgrWEQ23G6DFXyuRsdX8e9PUU1pVbUEXFbLePkfXWYYsTw92YoaUKE7K92QgFTcIdzP7jyPwtLtvd7qRid~JIqmKeS3-Bz1kf7kepChTN7f3EOzL3ml2OKJp7gh0oQrsDernKZJMy8D-ynwUVjHRz8MjaIoc7HRUyGwjrYYNaTWPsojd19OcqmZ2b6mdwsO93r1UqAUV-ONZFB4Lk3RbqBzBSx9UZXuPCMQmiBbQBYMeqlpjzGg4bm1FcU5EwP45bxdbQ__&Key-Pair-Id=APKAIE5G5CRDK6RD3PGA)
Cryptic insertions of immunoglobulin light-chain enhancer regions near the CCND3 gene in 3 cyclin D1−MCL. (A) Circos plots with interchromosomal SVs detected by MP-WGS (black lines) and CNA detected by copy-number arrays (blue for gains and red for losses) in cases ID6 and ID3. The rearrangement between chr2 (IGK-enh) and chr6 (CCND3) in both cases is indicated with a discontinuous line. (B) Schematic representation of the 6p region around the CCND3 locus showing the location of the cryptic insertion of the IGK-enh (chr2) close to 5′ of the CCND3 gene in cases ID6 and ID3 (the length of the inserted fragments is indicated), and the location of the cryptic insertion of the IGL enhancer (chr22) near 3′ of the CCND3 gene in case ID5. The breakpoints were detected by MP-WGS (cases ID3 and ID6), and WES (case ID5), and further verified and refined to base pair resolution by Sanger sequencing in the 3 cases. There were 1-, 2-, and 3-bp homology at the breakpoint junctions, respectively. (C) Verification of the cryptic IGK/CCND3 insertion by FISH in case ID3 using the fusion probe IGK-enh (labeled in green) with CCND3 (labeled in red). FISH analysis shows 2 red and 2 green signals in normal cells and the yellow arrows highlight cells with 1 red and 1 small green signal juxtaposed, indicating the presence of the IGK insertion. Magnifications of cells with the rearrangement are shown at the right side (4′,6-diamidino-2-phenylindole [DAPI] stain; original magnification ×100). *Breakpoints estimated from MP-WGS data. enh, enhancer.
Cryptic insertions of immunoglobulin light-chain enhancer regions near the CCND3 gene in 3 cyclin D1−MCL. (A) Circos plots with interchromosomal SVs detected by MP-WGS (black lines) and CNA detected by copy-number arrays (blue for gains and red for losses) in cases ID6 and ID3. The rearrangement between chr2 (IGK-enh) and chr6 (CCND3) in both cases is indicated with a discontinuous line. (B) Schematic representation of the 6p region around the CCND3 locus showing the location of the cryptic insertion of the IGK-enh (chr2) close to 5′ of the CCND3 gene in cases ID6 and ID3 (the length of the inserted fragments is indicated), and the location of the cryptic insertion of the IGL enhancer (chr22) near 3′ of the CCND3 gene in case ID5. The breakpoints were detected by MP-WGS (cases ID3 and ID6), and WES (case ID5), and further verified and refined to base pair resolution by Sanger sequencing in the 3 cases. There were 1-, 2-, and 3-bp homology at the breakpoint junctions, respectively. (C) Verification of the cryptic IGK/CCND3 insertion by FISH in case ID3 using the fusion probe IGK-enh (labeled in green) with CCND3 (labeled in red). FISH analysis shows 2 red and 2 green signals in normal cells and the yellow arrows highlight cells with 1 red and 1 small green signal juxtaposed, indicating the presence of the IGK insertion. Magnifications of cells with the rearrangement are shown at the right side (4′,6-diamidino-2-phenylindole [DAPI] stain; original magnification ×100). *Breakpoints estimated from MP-WGS data. enh, enhancer.
In addition, we performed MP-WGS of case ID76, positive for the IGK/CCND2 rearrangement by FISH and also by karyotype. We detected 23 interchromosomal SVs, including 2 that confirmed the IGK/CCND2 reciprocal translocation. Interestingly, the MP-WGS coupled with SNP6.0 array data allowed for refinement of several alterations of the karyotype (Figure 2; supplemental Table 6).
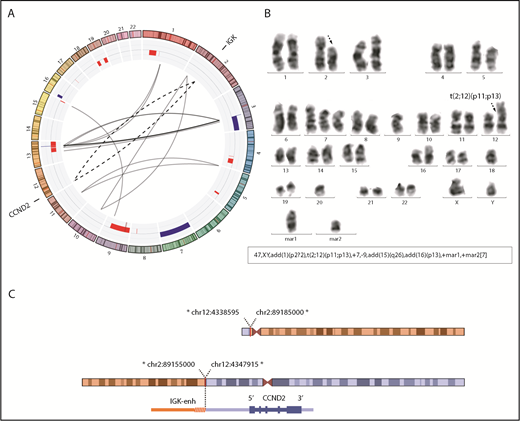
Conventional CCND2 rearrangement in a cyclin D2+ MCL. (A) Circos plot with interchromosomal SVs detected by MP-WGS (black lines) and CNA detected by copy-number arrays (blue for gains and red for losses) in case ID76. The conventional IGK/CCND2 reciprocal translocation is indicated with 2 discontinuous lines for both derivative chromosomes. Among other SV, 12 clustered rearrangements were found between chromosomes 3 and 13 (at both regions of high copy gain). (B) A representative metaphase and the karyotype with the IGK/CCND2 rearrangement (black discontinuous arrows) and other numerical and structural aberrations concordant with the results of MP-WGS and copy-number array: trisomy 7; loss of chromosome 9; and 2 marker chromosomes consistent with some of the rearranged chromosomes. (C) Schematic representation of the derivative chromosomes resulting from the translocation and zoomed image of CCND2 locus. *All breakpoints were estimated from MP-WGS analysis (chr2 in orange, containing the IGK enhancer and chr12 in blue containing the CCND2 gene).
Conventional CCND2 rearrangement in a cyclin D2+ MCL. (A) Circos plot with interchromosomal SVs detected by MP-WGS (black lines) and CNA detected by copy-number arrays (blue for gains and red for losses) in case ID76. The conventional IGK/CCND2 reciprocal translocation is indicated with 2 discontinuous lines for both derivative chromosomes. Among other SV, 12 clustered rearrangements were found between chromosomes 3 and 13 (at both regions of high copy gain). (B) A representative metaphase and the karyotype with the IGK/CCND2 rearrangement (black discontinuous arrows) and other numerical and structural aberrations concordant with the results of MP-WGS and copy-number array: trisomy 7; loss of chromosome 9; and 2 marker chromosomes consistent with some of the rearranged chromosomes. (C) Schematic representation of the derivative chromosomes resulting from the translocation and zoomed image of CCND2 locus. *All breakpoints were estimated from MP-WGS analysis (chr2 in orange, containing the IGK enhancer and chr12 in blue containing the CCND2 gene).
Identification of additional cryptic IGK/CCND3 and IGK/CCND2 by FISH
The finding of this enhancer-hijacking phenomenon in cyclin D1− MCL associated with CCND3 overexpression prompted us to explore the expression of all cyclins of the G1 phase of the cell cycle (CCND2, CCND3, CCNE1, and CCNE2) in cyclin D1− MCL, CLL, and nonneoplastic samples (reactive lymph nodes and tonsils) by qPCR. As expected, all CCND2-rearranged cases tested (n = 24) (cyclin D2+ MCL) showed elevated levels of CCND2 (median CCND2 expression = 127.5) compared with nonrearranged CCND2 MCL cases (median, 7.0) (P < .001) (Figure 3). Interestingly, among the 14 cases tested without CCND2 or CCND3 rearrangements, 6 cases overexpressed CCND3 (median 18.9), 4 cases overexpressed CCND2 (median 66.2), and the remaining 4 cases overexpressed concomitantly CCNE1 along with CCNE2 (median, 7.6 and 3.8, respectively) (Table 1; Figure 3; supplemental Figure 1).
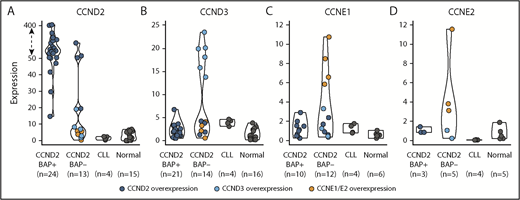
Expression of G1-phase cyclins by qPCR. The expression of (A) CCND2, (B) CCND3, (C) CCNE1, and (D) CCNE2 was represented according to 4 categories: MCL positive or negative for the CCND2 break-apart FISH test (CCND2 BAP+ and CCND2 BAP−, respectively), CLL, and nonneoplastic lymphoid samples (normal). Colored dots highlight cases with overexpression of CCND2 (dark blue), CCND3 (light blue), CCNE1/CCNE2 (orange). The overexpression cutoff values were calculated as the mean plus 3 standard deviations in nonrearranged cases: 15.1 for CCND2, 6.2 for CCND3, 3 for CCNE1, and 2.4 for CCNE2. The y-axis of the CCND2 graph has been transformed for the expression values above 50 (dashed arrow).
Expression of G1-phase cyclins by qPCR. The expression of (A) CCND2, (B) CCND3, (C) CCNE1, and (D) CCNE2 was represented according to 4 categories: MCL positive or negative for the CCND2 break-apart FISH test (CCND2 BAP+ and CCND2 BAP−, respectively), CLL, and nonneoplastic lymphoid samples (normal). Colored dots highlight cases with overexpression of CCND2 (dark blue), CCND3 (light blue), CCNE1/CCNE2 (orange). The overexpression cutoff values were calculated as the mean plus 3 standard deviations in nonrearranged cases: 15.1 for CCND2, 6.2 for CCND3, 3 for CCNE1, and 2.4 for CCNE2. The y-axis of the CCND2 graph has been transformed for the expression values above 50 (dashed arrow).
Given the high levels of CCND3 in these additional 6 cyclin D1− MCL cases, we explored the presence of similar cryptic IGK and CCND3 juxtapositions by FISH using the IGK-enh and CCND3 fusion probe. We detected fusion IGK/CCND3 signals in all 6 cases (supplemental Figure 2A; supplemental Table 5), but not in any of the 9 control samples tested. The presence of these cryptic immunoglobulin insertions near the CCND3 gene leading to CCND3 overexpression prompted us to hypothesize that the remaining 4 cases with high levels of CCND2 expression (and negative for CCND2 breaks using break-apart FISH probes) could present similar cryptic aberrations. Thus, we performed FISH using IGK-enh and CCND2 probes and we could detect the juxtaposition of both signals in all 4 cases (supplemental Figure 2B-C; supplemental Table 5), but not in the 9 controls tested. Together, these data show that 13 of the 17 (76%) MCLs negative for CCND2/D3 rearrangements using break-apart probes had IGK/L enhancer hijacking into either CCND3 (9 cases) or CCND2 (4 cases).
Absence of detectable primary genetic events in a small subset of cyclin D1− MCL
After the identification of the cryptic IGK enhancer rearrangements with CCND3 and CCND2 in MCLs negative for the CCND2/D3 break-apart by FISH, only 4 of the 56 cyclin D1− MCLs remained without an identified primary genetic event. All 4 cases overexpressed concomitantly CCNE1 and CCNE2 mRNA but not the remaining cyclin D genes. We performed cyclin E1 immunohistochemistry and the 3 cases tested (ID26, ID73, and ID77) were strongly positive in most of the cells (>65%) (Figure 4A) as compared with only 1 of 9 cyclin D2+ or cyclin D3+ MCLs, 1 of 3 B-cell lymphomas (a SMZL sample), and none of the 2 nonmalignant lymphoid tissues tested. These findings confirmed the cyclin E1 overexpression also at the protein level in these cases. We also compared the CCNE1/E2 mRNA expression in 3 cyclin D1+ blastoid MCLs, 6 DLBCLs, and 7 SMZLs. CCNE1/E2 levels were high in the 4 cyclin E+ MCLs but were negative or undetectable in the other cases (supplemental Figure 3). To determine whether the CCNE overexpression could be due to a genomic rearrangement, we performed FISH using a break-apart probe and the IGK enhancer with CCNE1 or CCNE2 probes in 3 cases but all were negative. Furthermore, these cases showed no evidence of IGK, IGL, and IGH rearrangement by FISH (supplemental Table 5).
![Figure 4. Comprehensive genetic characterization of an MCL−for CCND1, CCND2, and CCND3 (ID73). (A) Tumor cells from the skin lesion had a blastoid morphology (hematoxylin and eosin [H-E] stain; original magnification ×40), nuclear positivity for SOX11 (×40), and cyclin E1 (×40). (B) Circos plot representing, from inner to outer circles: SVs detected by WGS (black lines for interchromosomal and red for intrachromosomal rearrangements) or detected only by MP-WGS (gray lines); CNAs are represented in blue (gains and high copy gains) and red (losses and homozygous losses) palettes. In the outer circle are the genes altered by mutations (green), genes disrupted by SVs (black), genes affected by homozygous deletions (red), and the CCNE2 gene with high-level gain (dark blue). No rearrangements of any cyclin or immunoglobulin genes could be detected. There were 2 dense clusters of interchromosomal rearrangements: (i) 1 between chromosomes 3 and 6, at the regions of copy-number loss; and (ii) between chromosomes 8 and 18 at the regions of high copy gain. The gain of chromosome 19 and the loss of chromosome 22 were also supported as a reciprocal rearrangement by MP-WGS. The tumor purity of the case inferred by ASCAT was 78.2% and the ploidy 2.13 (diploid). (C) Chromosome 8 profile showing a partial 8q high-level gain (including the CCNE2 gene locus, indicated by the red line) by 2 different techniques; SNP6.0 copy-number arrays (top) and WGS analysis (bottom). (D) FISH with a locus-specific CCNE2 probe (green) and a centromeric chromosome 8 probe (orange) confirming that most tumors cells had at least 2 extra copies of the CCNE2 gene. Magnifications of 3 regions with the gain were shown at the right side (DAPI stain; original magnification ×100).](https://ash.silverchair-cdn.com/ash/content_public/journal/blood/133/9/10.1182_blood-2018-07-862151/4/m_blood862151f4.png?Expires=1769150031&Signature=OtOV8Dj1bsB~dNCRRc-05kAZ-KSMhbM9BcwVba7Qyrn4DQT-I8iroEVVz0ssbZnaK8PTZ22q8VPFOkOnI7R-ajMVd6yjzB6gl4zadCJEIiNtDTbF6RHFpRe3VOuKMxn5zFV4xlV6YB~KXUCIj9Rwu~vCrdTiZo7kTOTMj0JpiOITGnXFhW1oExj4VEBdY1uqTfhsZIBWWUfsjk4MwaPce6FM6SUhJDkDvqK11VxAOXyB-AnmyA00~Xw1tFhehmbceXaFzqdGvi~TdXA8b3ffHunKd5t~fsILzY4D9xyIEjkYV5DrFz25sarhfu-7Yn3K693ITFNOyDSQ2iJnQVHt6g__&Key-Pair-Id=APKAIE5G5CRDK6RD3PGA)
Comprehensive genetic characterization of an MCL−for CCND1, CCND2, and CCND3 (ID73). (A) Tumor cells from the skin lesion had a blastoid morphology (hematoxylin and eosin [H-E] stain; original magnification ×40), nuclear positivity for SOX11 (×40), and cyclin E1 (×40). (B) Circos plot representing, from inner to outer circles: SVs detected by WGS (black lines for interchromosomal and red for intrachromosomal rearrangements) or detected only by MP-WGS (gray lines); CNAs are represented in blue (gains and high copy gains) and red (losses and homozygous losses) palettes. In the outer circle are the genes altered by mutations (green), genes disrupted by SVs (black), genes affected by homozygous deletions (red), and the CCNE2 gene with high-level gain (dark blue). No rearrangements of any cyclin or immunoglobulin genes could be detected. There were 2 dense clusters of interchromosomal rearrangements: (i) 1 between chromosomes 3 and 6, at the regions of copy-number loss; and (ii) between chromosomes 8 and 18 at the regions of high copy gain. The gain of chromosome 19 and the loss of chromosome 22 were also supported as a reciprocal rearrangement by MP-WGS. The tumor purity of the case inferred by ASCAT was 78.2% and the ploidy 2.13 (diploid). (C) Chromosome 8 profile showing a partial 8q high-level gain (including the CCNE2 gene locus, indicated by the red line) by 2 different techniques; SNP6.0 copy-number arrays (top) and WGS analysis (bottom). (D) FISH with a locus-specific CCNE2 probe (green) and a centromeric chromosome 8 probe (orange) confirming that most tumors cells had at least 2 extra copies of the CCNE2 gene. Magnifications of 3 regions with the gain were shown at the right side (DAPI stain; original magnification ×100).
Comprehensive genetic characterization of an MCL−for CCND1, CCND2, and CCND3 (ID73). (A) Tumor cells from the skin lesion had a blastoid morphology (hematoxylin and eosin [H-E] stain; original magnification ×40), nuclear positivity for SOX11 (×40), and cyclin E1 (×40). (B) Circos plot representing, from inner to outer circles: SVs detected by WGS (black lines for interchromosomal and red for intrachromosomal rearrangements) or detected only by MP-WGS (gray lines); CNAs are represented in blue (gains and high copy gains) and red (losses and homozygous losses) palettes. In the outer circle are the genes altered by mutations (green), genes disrupted by SVs (black), genes affected by homozygous deletions (red), and the CCNE2 gene with high-level gain (dark blue). No rearrangements of any cyclin or immunoglobulin genes could be detected. There were 2 dense clusters of interchromosomal rearrangements: (i) 1 between chromosomes 3 and 6, at the regions of copy-number loss; and (ii) between chromosomes 8 and 18 at the regions of high copy gain. The gain of chromosome 19 and the loss of chromosome 22 were also supported as a reciprocal rearrangement by MP-WGS. The tumor purity of the case inferred by ASCAT was 78.2% and the ploidy 2.13 (diploid). (C) Chromosome 8 profile showing a partial 8q high-level gain (including the CCNE2 gene locus, indicated by the red line) by 2 different techniques; SNP6.0 copy-number arrays (top) and WGS analysis (bottom). (D) FISH with a locus-specific CCNE2 probe (green) and a centromeric chromosome 8 probe (orange) confirming that most tumors cells had at least 2 extra copies of the CCNE2 gene. Magnifications of 3 regions with the gain were shown at the right side (DAPI stain; original magnification ×100).
We then performed MP-WGS (tumor) and WGS (tumor and normal) of the remaining case with CCNE1/E2 overexpression (case ID73) (Figure 4B; supplemental Table 7). We could not find any genetic rearrangement involving immunoglobulin, cyclin D, or cyclin E genes. Of note, we detected a 8q21.2-q23 high-level gain (∼6 copies estimated by WGS), which included the CCNE2 locus and was confirmed by FISH (Figure 4C-D), and 2 homozygous deletions, 1 truncating RB1 at 13q14 and 1 affecting CDKN2A at 9p21. We also detected 32 intrachromosomal and 35 interchromosomal rearrangements, 12 of them only detected by MP-WGS. Finally, we analyzed the genes truncated by SVs and found disruption of 50 genes, including cancer-associated genes such as NBN, BCL2L11 (BIM), and ARID1B among others. We detected 31 somatic protein-coding mutations by WGS analysis, none of them previously reported in MCL samples (Figure 4B; supplemental Table 8).16,24
Global expression, genomic profiles, and overall survival in cyclin D1− MCL
We compared the global gene-expression profile of 14 cyclin D1− MCLs and 7 cyclin D1+ MCLs. The unsupervised clustering analysis did not segregate these cases into different clusters. Moreover, principal component analysis showed that the main source of variability (45%) was not related to the absence of cyclin D1 expression. CCND1 was the only significant differentially expressed gene (adjusted P = 2.3 × 10⁻¹¹), and besides overexpression of CCND2 (10 cases), CCND3 (1 case), or concomitant CCNE1/CCNE2 (2 cases), no other overexpressed genes were found (supplemental Figure 4).
We compared the global profile of CNA of 42 cyclin D1− MCLs with 116 previously published cyclin D1+/SOX11+ MCLs12,16,25 and the profiles were indistinguishable. Similar to cyclin D1+ MCL, cyclin D1− MCL had a high complex profile (median 10 CNAs per case), and frequent deletions of 9p21/CDKN2A (48%), 11q22/ATM (33%), and 17p13/TP53 (19%) (Table 1; Figure 5; supplemental Figure 5A; supplemental Table 9). No statistical differences were found between cyclin D2+ (n = 29) vs cyclin D3+ (n = 9) MCL subgroups (supplemental Figure 5B). Interestingly, all 4 cases with CCNE1/E2 overexpression showed alterations in cell cycle and apoptosis-related genes, such as focal homozygous deletions of 9p21 (CDKN2A), 13q14 deletions (RB1), and large high-copy gains of 18q (BCL2). These 4 cases also had a higher number of CNAs (median, 17 CNAs per case) than cyclin D2+ or cyclin D3+ MCLs (median 9 CNA/case) (Table 1). We also analyzed the CNAs of 2 different tumor samples of the same patient in 5 cases (1 synchronous and 4 sequential) and they showed both common and unique alterations, suggesting the presence of genetically heterogeneous subpopulations and clonal evolution in each case (supplemental Figure 5C).
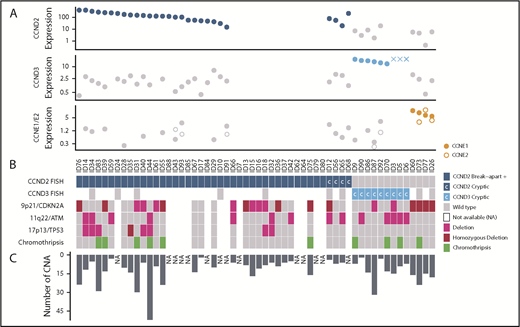
Global genetic landscape of the 56 cyclin D1−MCL. Each MCL case is represented in a column and several specific molecular analysis in different rows. From top to bottom: (A) 3 plots showing cyclin-expression levels detected by qPCR (and by gene-expression arrays in 3 cases, indicated with “X”); (B) FISH results using break-apart or specific IGK-enh and CCND2 or CCND3 probes to detect cryptic rearrangements (rearranged cases in dark and light blue, respectively, and cryptic rearrangements are indicated with “C”); deletions of 9p21, 11q22, and 17p13 by copy-number arrays (deletion in pink, homozygous deletion in bordeaux); and presence of chromothripsis (green). (C) The bar graph indicates the number of CNAs detected in each case. NA, not available.
Global genetic landscape of the 56 cyclin D1−MCL. Each MCL case is represented in a column and several specific molecular analysis in different rows. From top to bottom: (A) 3 plots showing cyclin-expression levels detected by qPCR (and by gene-expression arrays in 3 cases, indicated with “X”); (B) FISH results using break-apart or specific IGK-enh and CCND2 or CCND3 probes to detect cryptic rearrangements (rearranged cases in dark and light blue, respectively, and cryptic rearrangements are indicated with “C”); deletions of 9p21, 11q22, and 17p13 by copy-number arrays (deletion in pink, homozygous deletion in bordeaux); and presence of chromothripsis (green). (C) The bar graph indicates the number of CNAs detected in each case. NA, not available.
The cyclin D1− MCL patients had overall survival similar to cyclin D1+/SOX11+ MCL (supplemental Figure 6A).26 It is noteworthy that although the 3-year overall survival was higher in patients with cyclin D3+ than in patients with cyclin D2+ or cyclin E+ (100%, 59%, and 75%, respectively), these differences were not statistically significant (Table 1; supplemental Figure 6B).
Discussion
MCL is a well-characterized lymphoid neoplasm with the t(11;14) leading to cyclin D1 overexpression as the primary genetic event. However, a particular subset of cases with the same histology and phenotype but lacking cyclin D1 expression has been recognized.1 We previously reported chromosomal translocations of the CCND2 locus with immunoglobulin genes in approximately one-half of these cases and emphasized the value of this approach for the recognition of a proportion of cyclin D1− MCL.5 Nevertheless, the primary rearrangement in the remaining cases could not be established. We document here a deep comprehensive analysis of the largest series of cyclin D1− MCL cases ever reported, integrating molecular and genetic data with NGS technologies, which allowed us to unveil for the first time selective cryptic insertions of IGK/L enhancer regions (enhancer hijacking) into cyclin D genes in the majority of the cases that lacked a CCND2 conventional rearrangement.
Our integrative study found that 16% of cyclin D1− MCLs had CCND3 rearrangements, all of them consisting of a cryptic insertion of the IGK/L enhancer that was associated with CCND3 overexpression and may be considered an alternative molecular mechanism to CCND1 or CCND2 primary translocations. Interestingly, a CCND3/IGH translocation has been previously reported in 1 MCL,8 1 low-grade B-cell lymphoma, 3 splenic lymphomas, and 7 aggressive B-cell lymphomas.27-30 Notably, in all of these cases, the CCND3 rearrangement was with IGH and detectable by conventional cytogenetics. Intriguingly, some of these cases expressed CD5, and had blastoid morphology and unmutated IGHV with splenic and leukemic involvement. Although SOX11 expression was not studied, these features suggest that at least some of these cases could correspond to MCL. In multiple myeloma, 15% to 25% cases have CCND1/IGH rearrangement or CCND1 gain/amplification coupled with CCND1 overexpression, 3% to 5% have CCND3/IGH rearrangement associated with CCND3 overexpression, whereas CCND2 overexpression has been detected in a subset of 5% cases without apparent genomic alterations.31,32 Interestingly, no CCND3 rearrangement with IGK has been previously detected in human lymphomas, but the application of RNA-sequencing analyses of a canine DLBCL showed the presence of an IGK/CCND3 rearrangement associated with overexpression of CCND3.33
In our series, a large proportion of cyclin D1− MCL had conventional CCND2 rearrangements (70%), a higher frequency than previously reported (55%).5 We have now identified an additional subset of 7% cases with cryptic IGK/CCND2. Interestingly, CCND2 is preferentially rearranged with immunoglobulin light-chain genes instead of IGH, IGK being more frequent than IGL (83% and 17%). Similarly, 8 CCND3 rearrangements were with IGK, only 1 with IGL, and none with IGH. Of note, both CCND2 and CCND3 chromosomal breaks occur in a large region (including the 5′ or 3′ of CCND3) whereas the IGK breaks occur in a restricted region that contained the enhancer element.
One of the most remarkable findings in our study was the restricted small insertion of the IGK/L enhancer close to the CCND2/D3 genes associated with their respective overexpression, a finding not previously detected in lymphoid neoplasms. We could resolve the breakpoints at single-nucleotide resolution identifying 1 to 3 identical nucleotides on both sides of the breakpoints. These special enhancer rearrangements seem to parallel the mechanism of enhancer hijacking activating known oncogenes recently identified in solid tumors and some lymphoid neoplasms. In solid tumors, recurrent SVs bring together a distal active enhancer to an oncogene promoting its expression. This mechanism has been identified for MYC and MYCN in high-risk pediatric neuroblastoma34 ; TERT in neuroblastoma35 ; PRDM636 ; GFI1, GFI1B, and DDX3137,38 in medulloblastoma; and IGF2 in colorectal cancer.39 MYC rearrangements with superenhancers from nonimmunoglobulin genes (ie, NSMCE2, TXNDC5, FAM46C, FOXO3, PRDM1) have been frequently found in multiple myeloma.40 In addition to translocations, lymphoid neoplasms may have other small-scale SVs involving active enhancers such as amplifications of enhancer regions close to oncogenes or selective deletions and inversions that reposition candidate enhancer elements in the vicinity of oncogenes.41,42 All of these findings emphasize that SVs targeting active enhancer regions may be a mechanism of activating oncogenes more prevalent than initially thought and present across different cancer types. It would be interesting to explore whether the “immunoglobulin enhancer insertions” also affect other oncogenes such as MYC, BCL2, or CCND1 and functionally confirm the effect of these insertions on gene overexpression in B-cell lymphomas with high mRNA or protein expression but not carrying the canonical translocations.
In the present study, we demonstrated that 93% of cyclin D1− MCLs have CCND2 or CCND3 rearrangements. However, a small number of cases (n = 4), representing 7% of cyclin D1− MCLs, lacked a genetic alteration and overexpression of these cyclins, despite having the morphology and phenotype of MCL. In this minority of cases, we observed overexpression of CCNE1 and CCNE2 but without a primary structural rearrangement. The expression levels of these cyclins, although significantly higher than in other MCL and controls, were relatively moderate, not suggestive of being triggered by a translocation. In addition, all 4 cases showed concomitantly similar levels of both CCNE1 and CCNE2 genes, located in different chromosomes. The mechanism/s leading to their concomitant upregulation in these cases are unclear. Only one of the cases had a high-copy gain of CCNE2 gene (at 8q22.1) but no concomitant gain of CCNE1 (at 19q12), and these 2 genomic regions were not gained/amplified in the remaining 3 cases. A potential explanation could be that these cases may have an upstream common dysregulation mechanism. In contrast to cyclin D genes, the rearrangement of CCNE1 in B-cell neoplasms is exceptionally rare with only a single reported case of DLBCL with IGH/CCNE1 rearrangement and cyclin E1 protein overexpression.43 Another feature of the 4 cyclin E+ MCLs was a high genomic complexity, which is in line with previously reported CCNE1 dysregulation (by locus amplification and/or overexpression) in solid tumors, associated with chromosome instability and aggressive behavior,44-47 and worse prognosis in DLBCL.48 The lack of overexpression of classic cyclin Ds in these 4 cases may make their classification as MCL debatable. The main differential diagnosis may be DLBCL with CCNE overexpression.48 However, SOX11 expression has only been detected in 1 of 339 DLBCLs investigated in 5 previous studies.49-53 Therefore, the very rare expression of SOX11 in DLBCL and the common expression of SOX11 in MCL together with the classic or blastoid MCL morphology, CD5 expression, and the aggressive clinical course in our cases favor the closer relationship of these CCNE+ cases with MCL rather than DLBCL. Further studies are needed to confirm the most appropriate taxonomy of these uncommon cases.
Overall, we show that cyclin D1− and cyclin D1+ MCL share a common expression and genomic profile as well as clinical outcome.26,54 Our results highlight that CCND2, CCND3, and possibly also CCNE1/E2, may be bona fide alternative alterations to CCND1 in MCL pathogenesis, which, together with SOX11 overexpression, may represent the main initial hits in MCL.55 These findings may also have diagnostic implications. The identification of CCND2/D3 translocations with immunoglobulin genes in virtually all cyclin D1− MCLs confirms that the morphology and phenotype combined with SOX11 positivity are appropriate to recognize these tumors. The study of CCND2/D3 translocations described here may be useful in the differential diagnosis of tumors with blastoid or pleomorphic morphology because lymphoblastic lymphomas may express SOX11.11,49 The finding of these translocations or very high CCND2/D3/E1/E2 mRNA levels would favor the diagnosis of MCL. CCNE1/E2 overexpression was associated with blastoid morphology, high genomic complexity, high proliferation, and short survival, consistent with the role of these cyclins as potent oncogenes.44
In conclusion, using an integrative molecular and genetic analysis, we have identified immunoglobulin light-chain enhancer hijacking next to CCND2 or CCND3 genes in 23% of cyclin D1− MCLs. We also recognized a small subset of aggressive cyclin D1− MCLs carrying cyclin E dysregulation. In addition to the pathogenic significance of these findings, the approach used here may be useful for the diagnosis of these tumors.
The sequencing, expression, and copy-number array data reported in this article have been deposited in the European Genome-Phenome Archive (EGA; http://www.ebi.ac.uk/ega/), which is hosted at the European Bioinformatics Institute (EBI; accession number EGAS00001003060). Copy-number arrays of the cases included in Salaverria et al5 have been previously deposited in the Gene Expression Omnibus database (accession number GSE42854).
The online version of this article contains a data supplement.
The publication costs of this article were defrayed in part by page charge payment. Therefore, and solely to indicate this fact, this article is hereby marked “advertisement” in accordance with 18 USC section 1734.
Acknowledgments
The authors thank the Hematopathology Collection for sample procurement; Silvia Martín, Noelia García, Candida Gómez, Cristina Capdevila, and Maria Rodríguez-Rivera for excellent technical assistance; the Molecular Cytogenetic Platform of IMIM, Hospital del Mar (Barcelona) for providing BAC clones; the support of the technical staff of the Molecular Cytogenetic laboratories of the Institutes of Human Genetics in Kiel and Ulm; and Montserrat Puiggros from the Barcelona Supercomputing Center for support in WGS analysis. The authors also thank the contributors of individual cases: Iwona Wlodarska (Leuven, Belgium), Philippe Gaulard (Creteil, France), Wendy Erber (Crawley, Australia), Pilar Forcada (Terrassa, Spain), Grevelyn Sosa Rotundo (Madrid, Spain), Alejandra Carvajal (San Jose, Costa Rica), Camille Gonzalez (New York, NY), Nhora Silva Perez (Cali, Colombia), Lluís Rodríguez (Vic, Spain). The arrays were performed at qGenomics (www.qgenomics.com), CeGen (PTI3/0001, ISCIII-SGEFI/FEDER), and the IDIBAPS Genomics core facility. This work was developed at the Centro Esther Koplowitz (CEK), Barcelona, Spain.
This work was supported by research funding from Fondo de Investigaciones Sanitarias, Instituto de Salud Carlos III PI14/00571 and PI17/01061 (S. Beà); Fundació La Marató de TV3-Càncer/2013410 (S. Beà); Fundació Crèdit Andorrà, Ministerio de Economía y Competitividad, SAF2015-64885-R (E.C.); SAF2017-87811-R (X.S.P.) from Plan Nacional de I+D+I, Generalitat de Catalunya Suport Grups de Recerca 2017-SGR-709 (S. Beà); 2017-SGR-1142 (E.C.); and the European Regional Development Fund Una Manera de fer Europa, CERCA Programme/Generalitat de Catalunya. Personal staff (Miriam Prieto and Noelia García) are supported by Acció Instrumental d’Incorporació de Científics i Tecnòlegs PERIS 2016 (SLT002/16/00347 and SLT002/16/00336 from Generalitat de Catalunya).
E.C. is an academia researcher of the Institució Catalana de Recerca i Estudis Avançats of the Generalitat de Catalunya.
Authorship
Contribution: E.C. and S. Beà designed the study; D.M.-G., R.V.-M., J.G.-A., D.T., S. Beltran, C.L.-O., X.S.P., and S. Beà analyzed and interpreted NGS data; A.N., M.P., R.W., G.R., S. Bens, B.E., D.C., R.S., and S. Beà performed and interpreted cytogenetic analysis; D.M.-G., A.N., M.P., I.S., and S. Beà performed and interpreted molecular studies; G.C. performed statistical analyses; I.R.-C., G.R., L.d.L., A.R., J.A.F., E.D.H., K.F., J.D., D.W., D.d.J., F.C., S.J.O., S.H.S., B.G.-F., L.V., E.M., G.O., L.Q.-M., E.S.J., and E.C. reviewed and collected IHC and pathological data; D.M.-G., A.N., E.C., and S. Beà wrote the manuscript; S. Beà directed and supervised the research; and all authors approved the final manuscript.
Conflict-of-interest disclosure: E.C. has received research funding from Gilead Sciences; has been a consultant for Takeda, Celgene, and Gilead; and is an author in a Lymphoma and Leukemia Molecular Profiling Project (LLMPP) patent “Method for selecting and treating lymphoma types” PCT/US14/64161. The remaining authors declare no competing financial interests.
Correspondence: Sílvia Beà, Institut d’Investigacions Biomèdiques August Pi i Sunyer (IDIBAPS), Rosselló 149-153, 08036 Barcelona, Spain; e-mail: sbea@clinic.cat.

This feature is available to Subscribers Only
Sign In or Create an Account Close Modal