

Key Points
Endoglin deletion in HSCs impairs quiescence, as shown by significant engraftment defect in tertiary and quaternary transplanted recipients.
Endoglin-mediated HSC defect is due to decreased phosphorylation of canonical and noncanonical TGF-β downstream effectors.

Abstract
Transforming growth factor β (TGF-β) is well known for its important function in hematopoietic stem cell (HSC) quiescence. However, the molecular mechanism underlining this function remains obscure. Endoglin (Eng), a type III receptor for the TGF-β superfamily, has been shown to selectively mark long-term HSCs; however, its necessity in adult HSCs is unknown due to embryonic lethality. Using conditional deletion of Eng combined with serial transplantation, we show that this TGF-β receptor is critical to maintain the HSC pool. Transplantation of Eng-deleted whole bone marrow or purified HSCs into lethally irradiated mice results in a profound engraftment defect in tertiary and quaternary recipients. Cell cycle analysis of primary grafts revealed decreased frequency of HSCs in G0, suggesting that lack of Eng impairs reentry of HSCs to quiescence. Using cytometry by time of flight (CyTOF) to evaluate the activity of signaling pathways in individual HSCs, we find that Eng is required within the Lin−Sca+Kit+–CD48− CD150+ fraction for canonical and noncanonical TGF-β signaling, as indicated by decreased phosphorylation of SMAD2/3 and the p38 MAPK-activated protein kinase 2, respectively. These findings support an essential role for Eng in positively modulating TGF-β signaling to ensure maintenance of HSC quiescence.
Introduction
Long-term hematopoietic stem cells (LT-HSCs) are responsible for lifelong blood production. Under normal conditions, the majority of bone marrow LT-HSCs are in a quiescent state that is characterized by slow cell cycling or G0 phase,1,2 dividing only ∼5 times per lifespan.3 However, during stress conditions, such as bone marrow (BM) transplantation or chemotherapy, LT-HSCs exit the quiescent state and proliferate to provide new blood cells and to replenish the hematopoietic stem cell (HSC) pool.3,4 Despite significant progress, the mechanisms that regulate HSC activation and their self-renewal are still not entirely understood.
Several studies have indicated that transforming growth factor β (TGF-β) is a critical regulator of HSC quiescence.5-9 However, the molecular mechanism remains unclear, because ablation studies of TGF-β receptors or downstream signaling gave conflicting results. Upon binding of TGF-β to the TGF-β type II receptor (TβRII), TβRI, also known as activin receptor-like kinase 5, is recruited and phosphorylated, activating downstream effectors SMAD2/3, which subsequently form a complex with SMAD4. The activated SMAD complex is translocated into the nucleus and, together with other nuclear cofactors, regulates the transcription of target genes.10 Whereas conditional ablation of TβRI and SMAD2/3 in adult BM resulted in no defect in HSC self-renewal or regenerative capacity,11,12 deletion of TβRII led to impaired HSC function and reduced levels of phosphorylated (p)SMAD2/3.6 Likewise, inducible deletion of SMAD4 led to impaired HSC self-renewal and reconstitution.13
TGF-β, as well as other ligands of the TGF-β superfamily, including BMP, also signals through the TGF-βIII receptor endoglin (Eng; or CD105). Eng is primarily known for its expression in endothelial cells, as well as its key role in vascular development and angiogenesis,14-16 but its significance goes beyond the endothelial lineage. We have reported an important function for Eng in cell fate specification and early hematopoiesis, where this receptor is required for proper yolk sac hematopoiesis.17,18 Analysis of embryonic day (E)8.5 to E9.5 Eng-deficient embryos shows severely reduced erythropoiesis, and hematopoietic progenitor activity in wild-type embryos is restricted to Eng+ cells.17 Because of the early lethality at E10.5 due to cardiovascular abnormalities,14,15 the role of Eng in hematopoiesis beyond the YS stage has not been determined. Nevertheless, we and other investigators have observed that this receptor is expressed in the HSC of every hematopoietic site, including the aorta–gonad–mesonephros,19,20 the fetal liver,21 and the adult BM.22 In BM, Eng has been shown to selectively mark the LT-HSCs in mice22,23 and humans;24-26 however, it remains unknown whether this receptor is required for HSC function.
Through serial transplantation studies, we show that in vivo conditional deletion of Eng impairs HSC self-renewal, leading to exhaustion of the HSC pool. This is accompanied by decreased phosphorylation of SMAD2/3 and MAPK-activated protein kinase 2 (MAPKAPK2), key canonical and noncanonical TGF-β downstream effectors, respectively. Our results reiterate the importance of TGF-β signaling for HSC self-renewal and quiescence and reveal a critical function for the Eng receptor in positively modulating the activation of key molecular effectors of HSC quiescence.
Materials and methods
Mice
Eng floxed mice were kindly provided by Helen Arthur (Newcastle University).27 Mx1-Cre, C57BL/6-CD45.1, and C57BL/6-CD45.2 mice were purchased from The Jackson Laboratory. We interbred to generate a congenic C57BL/6 line homozygous for CD45.1 and Engfl and heterozygous for Mx1-Cre. To induce Eng deletion, 3-week-old Engfl/Δ;Mx1-Cre+ and control mice, consisting of Engfl/wt;Mx1-Cre+ or Engfl/Δ;Mx1-Cre− mice, were injected intraperitoneally with 5 doses (250 µg) of polyinosinic-polycytidylic acid sodium salt (pIpC; Sigma) every other day for 10 days (Figure 1A). All experiments were approved by the University of Minnesota Institutional Animal Care and Use Committee.

Characterization of Eng cKO mice. (A) Scheme for pIpC treatment. To induce Eng deletion, Engfl/Δ;Mx1-Cre+ mice (blue) and control mice (red), Engfl/wt;Mx1-Cre+ or Engfl/Δ;Mx1-Cre−, were injected intraperitoneally with 5 doses of pIpC (250 µg) every other day for 10 days. (B-D) Eng deletion in HSCs. BM from pIpC-treated control mice (left panels) and Engfl/Δ;Mx1-Cre+ mice (right panels) were analyzed by fluorescence-activated cell sorting (FACS) 2 weeks after the last pIpC injection. (B) Representative gating strategy for the LSKCD48−CD150+ HSC fraction are showed in the top 3 rows. Control LSKCD48−CD150+ HSCs are homogenously positive for Eng (bottom left panel), whereas HSCs from pIpC-treated Engfl/Δ;Mx1-Cre+ mice have significantly reduced levels of this receptor (bottom right panel). Representative histogram plots (C) and respective quantification (D) confirm Eng deletion in HSCs from pIpC-treated Engfl/Δ;Mx1-Cre+ mice, whereas HSCs from controls express Eng at very high levels. (D) Box plot whiskers represent minimum and maximum values for each cohort (n = 5 per group). (E-G) Blood counts. Time course analyses of white blood cells (WBC) (E), red blood cells (RBC) (F), and platelets (PLT) (G) in pIpC-treated Engfl/Δ;Mx1-Cre+ mice and control mice. Error bars represent standard error of the mean for each cohort (n = 8 per group). (H) Survival curve shows that Eng deletion does not affect the survival rate of pIpC-treated Engfl/Δ;Mx1-Cre+ mice compared with controls. A total of 14 mice was analyzed (7 for each group). Mice were followed for a total of 30 weeks. ***P < .001.
Characterization of Eng cKO mice. (A) Scheme for pIpC treatment. To induce Eng deletion, Engfl/Δ;Mx1-Cre+ mice (blue) and control mice (red), Engfl/wt;Mx1-Cre+ or Engfl/Δ;Mx1-Cre−, were injected intraperitoneally with 5 doses of pIpC (250 µg) every other day for 10 days. (B-D) Eng deletion in HSCs. BM from pIpC-treated control mice (left panels) and Engfl/Δ;Mx1-Cre+ mice (right panels) were analyzed by fluorescence-activated cell sorting (FACS) 2 weeks after the last pIpC injection. (B) Representative gating strategy for the LSKCD48−CD150+ HSC fraction are showed in the top 3 rows. Control LSKCD48−CD150+ HSCs are homogenously positive for Eng (bottom left panel), whereas HSCs from pIpC-treated Engfl/Δ;Mx1-Cre+ mice have significantly reduced levels of this receptor (bottom right panel). Representative histogram plots (C) and respective quantification (D) confirm Eng deletion in HSCs from pIpC-treated Engfl/Δ;Mx1-Cre+ mice, whereas HSCs from controls express Eng at very high levels. (D) Box plot whiskers represent minimum and maximum values for each cohort (n = 5 per group). (E-G) Blood counts. Time course analyses of white blood cells (WBC) (E), red blood cells (RBC) (F), and platelets (PLT) (G) in pIpC-treated Engfl/Δ;Mx1-Cre+ mice and control mice. Error bars represent standard error of the mean for each cohort (n = 8 per group). (H) Survival curve shows that Eng deletion does not affect the survival rate of pIpC-treated Engfl/Δ;Mx1-Cre+ mice compared with controls. A total of 14 mice was analyzed (7 for each group). Mice were followed for a total of 30 weeks. ***P < .001.
Cell sorting and transplantation assays
Transplantation strategies are outlined in Figures 2A and 3A, and the antibody combination is provided in supplemental Table 1 (available on the Blood Web site). For HSC isolation (Lin−Sca−1+c-Kit+[LSK]CD48−CD41−CD150+ cell fraction), we used a Lineage Cell Depletion Kit (Miltenyi Biotec), followed by cell sorting. Prior to purification or transplantation, BM cells were incubated with RBC Lysis Buffer (BioLegend) to eliminate red blood cells. For transplantation assays, 5 × 10⁵ total BM cells or 100 sorted HSCs were isolated from pIpC-treated Engfl/Δ;Mx1-Cre+ mice and control mice (all on CD45.2 background) and transplanted IV into 8- to 12-week-old recipient mice (C57BL/6-CD45.1) that had been lethally irradiated (9.5 Gy split in 2 doses, 2-3 hours apart). Competitor cells consisted of 200 000 total CD45.1 BM cells. Flow cytometry analyses and sorting were performed using a BD FACSAria II cytometer and analyzed using FlowJo version 7.6.5 software or Cytobank software (www.cytobank.org).

Serial transplantation reveals Eng as an important regulator of HSC quiescence. (A) Outline of transplantation experiments. Total BM cells (5 × 10⁵ cells) from pIpC-treated Engfl/Δ;Mx1-Cre+ or control mice (all CD45.2 background) were injected into lethally irradiated CD45.1 recipient mice. Competitor cells consisted of 2 × 10⁵ total CD45.1 BM cells. For subsequent serial transplantation, 1 × 10⁶ total BM cells were injected into lethally irradiated CD45.1 recipients. (B) Percentage of CD45.2 chimerism in primary recipients at 6 and 16 weeks posttransplantation (short term and long term, respectively) shows no differences in mice injected with Eng-deleted BM or control BM. Box plot whiskers represent minimum and maximum values for each cohort (n = 8-10 per group). (C) Contribution of CD45.2+ donor cells to several blood lineages: macrophages (Mac-1), granulocytes (Gr-1), B lymphocytes (CD19), and T lymphocytes (CD3). Error bars indicate standard error of the mean for each cohort. (D-E) BM analysis of primary recipients. (D) Frequency of total HSCs in the BM of transplanted mice. Box plot whiskers represent minimum and maximum values for each cohort (n = 5 per group). (E) Percentage of donor contribution to several cell fractions within the BM, including LSK cells, HSCs (LSKCD150+CD48−), and multipotent progenitor cells (MPP; LSKCD150−CD48−). Total BM is shown as reference. Box plot whiskers represent minimum and maximum values for each cohort (n = 5 per group). (F) Serial transplantation data. Percentage of CD45.2 chimerism in secondary to quaternary recipients (left to right) at 6 and 16 weeks posttransplantation reveals defective hematopoietic reconstitution in tertiary and quaternary recipient mice. Box plot whiskers represent minimum and maximum values for each cohort. (G-H) Cell cycle analysis. (G) Representative fluorescence-activated cell sorting plots of BM LSK CD48− CD150+ HSCs isolated from primary recipient animals that had been transplanted with pIpC-treated Engfl/Δ;Mx1-Cre+ mice or control mice (in blue and red, respectively), analyzed in combination with Ki67 (proliferation) and propidium iodide (PI; for DNA content) 6 months posttransplantation. (H) Quantification of cell cycle analysis. Error bars represent standard error of the mean. *P < .05 **P < .01, ***P < .001.
Serial transplantation reveals Eng as an important regulator of HSC quiescence. (A) Outline of transplantation experiments. Total BM cells (5 × 10⁵ cells) from pIpC-treated Engfl/Δ;Mx1-Cre+ or control mice (all CD45.2 background) were injected into lethally irradiated CD45.1 recipient mice. Competitor cells consisted of 2 × 10⁵ total CD45.1 BM cells. For subsequent serial transplantation, 1 × 10⁶ total BM cells were injected into lethally irradiated CD45.1 recipients. (B) Percentage of CD45.2 chimerism in primary recipients at 6 and 16 weeks posttransplantation (short term and long term, respectively) shows no differences in mice injected with Eng-deleted BM or control BM. Box plot whiskers represent minimum and maximum values for each cohort (n = 8-10 per group). (C) Contribution of CD45.2+ donor cells to several blood lineages: macrophages (Mac-1), granulocytes (Gr-1), B lymphocytes (CD19), and T lymphocytes (CD3). Error bars indicate standard error of the mean for each cohort. (D-E) BM analysis of primary recipients. (D) Frequency of total HSCs in the BM of transplanted mice. Box plot whiskers represent minimum and maximum values for each cohort (n = 5 per group). (E) Percentage of donor contribution to several cell fractions within the BM, including LSK cells, HSCs (LSKCD150+CD48−), and multipotent progenitor cells (MPP; LSKCD150−CD48−). Total BM is shown as reference. Box plot whiskers represent minimum and maximum values for each cohort (n = 5 per group). (F) Serial transplantation data. Percentage of CD45.2 chimerism in secondary to quaternary recipients (left to right) at 6 and 16 weeks posttransplantation reveals defective hematopoietic reconstitution in tertiary and quaternary recipient mice. Box plot whiskers represent minimum and maximum values for each cohort. (G-H) Cell cycle analysis. (G) Representative fluorescence-activated cell sorting plots of BM LSK CD48− CD150+ HSCs isolated from primary recipient animals that had been transplanted with pIpC-treated Engfl/Δ;Mx1-Cre+ mice or control mice (in blue and red, respectively), analyzed in combination with Ki67 (proliferation) and propidium iodide (PI; for DNA content) 6 months posttransplantation. (H) Quantification of cell cycle analysis. Error bars represent standard error of the mean. *P < .05 **P < .01, ***P < .001.
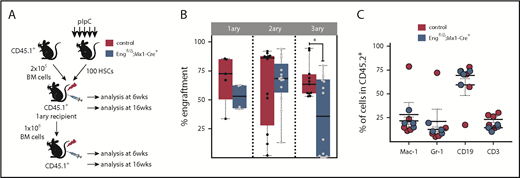
Hematopoietic defect is cell autonomous. (A) Outline of transplantation experiments. A total of 100 purified HSCs from pIpC-treated Engfl/Δ;Mx1-Cre+ mice (blue) or control mice (red) was injected into lethally irradiated CD45.1 recipient mice, along with 2 × 10⁵ CD45.1 total BM competitor cells. For subsequent serial transplantation, 1 × 10⁶ total pooled BM cells were injected into lethally irradiated CD45.1 recipients. (B) Percentage of CD45.2 chimerism in primary to tertiary recipients (left to right) at 6 and 16 weeks following HSC transplantation confirm defective hematopoietic reconstitution in tertiary recipient mice. Box plot whiskers represent minimum and maximum values for each cohort. (C) Contribution of CD45.2+ donor cells to macrophages, granulocytes, B lymphocytes, and T lymphocytes. Error bars indicate standard error of the mean for each cohort. *P < .05.
Hematopoietic defect is cell autonomous. (A) Outline of transplantation experiments. A total of 100 purified HSCs from pIpC-treated Engfl/Δ;Mx1-Cre+ mice (blue) or control mice (red) was injected into lethally irradiated CD45.1 recipient mice, along with 2 × 10⁵ CD45.1 total BM competitor cells. For subsequent serial transplantation, 1 × 10⁶ total pooled BM cells were injected into lethally irradiated CD45.1 recipients. (B) Percentage of CD45.2 chimerism in primary to tertiary recipients (left to right) at 6 and 16 weeks following HSC transplantation confirm defective hematopoietic reconstitution in tertiary recipient mice. Box plot whiskers represent minimum and maximum values for each cohort. (C) Contribution of CD45.2+ donor cells to macrophages, granulocytes, B lymphocytes, and T lymphocytes. Error bars indicate standard error of the mean for each cohort. *P < .05.
Peripheral blood analysis
Peripheral blood from the facial vein was collected into EDTA-containing tubes and analyzed on a Hemavet 950 (Drew Scientific) for blood counts or processed for flow cytometry. For staining, cells were lysed with RBC Lysis Buffer (BioLegend) for 5 minutes at room temperature and stained with antibodies against CD45.2 and CD45.1 to assess engraftment levels, as well as antibodies against the lineage markers Mac-1 (macrophage), Gr-1 (granulocytes), CD3e (T cells), and CD19 (B cells) to determine donor contribution among different lineages (supplemental Table 1).
Cell cycle analysis
BM cells were incubated for 30 minutes on ice with biotinylated antibodies against lineage markers (CD5, CD45R, CD11b, Gr1, 7/4, Ter119; Miltenyi Biotec), followed by further incubation with anti-mouse CD16/32 antibody (eBioscience). Cells were stained with streptavidin-phycoerythrin or fluorescein isothiocyanate and antibodies to c-Kit, Sca-1, CD41, CD48, CD150, and CD45.2 (supplemental Table 1) for 30 minutes. Cells were washed twice with phosphate-buffered saline (PBS)–bovine serum albumin (BSA), incubated in 250 µL of BD Cytofix/Cytoperm Fixation and Permeabilization Solution (according to the manufacturer’s instructions), and stained for Ki67 (30 minutes on ice). Next, cells were incubated for 15 minutes at 37°C in 50 µg/mL propidium iodide (Thermo Fisher) solution containing 0.1 mg/mL RNase A, washed with PBS-BSA, and analyzed within 30 minutes using a BD FACSAria II cytometer.
5-Fluorouracil injections
C57BL/6-CD45.1 mice were transplanted with 106 total BM cells from Engfl/Δ;Mx1-Cre+ or Engfl/wt;Mx1-Cre+ mice (donors were not treated with pIpC). Five weeks later, recipient mice were injected with 5 doses of pIpC, as described (Figure 1A). Three months from transplantation, when chimerism was established (>95%), mice were subjected to 3 injections of 5-fluorouracil (5-FU; 150 mg/kg each), 4 to 12 weeks apart. Mice were monitored weekly for blood counts.
Antibody metal conjugation
Antibodies were conjugated to metal isotopes using the X8 Antibody Labeling Kit (Fluidigm). Conjugation was performed according to the manufacturer’s instructions. At the end of the conjugation, antibody concentration was quantified using a NanoDrop spectrophotometer (Thermo Scientific), diluted to 200 µg/mL in Antibody Stabilizer (Boca Scientific) supplemented with 0.01% sodium azide, and stored at 4°C.
Mass cytometry (CyTOF)
BM cells were evaluated by cytometry by time of flight (CyTOF), as previously described.28 Briefly, freshly isolated BM cells, collected as described above, were fixed with 1.5% paraformaldehyde (Fisher Scientific) for 10 minutes at room temperature. After 2 washes, cells were resuspended in cell staining media (CSM; low-barium PBS + 0.5% BSA) and stored at −80°C. After all samples had been collected, cocktails containing surface and intracellular antibodies were prepared (as indicated in supplemental Table 2), and 10 × 106 cells from each sample were transferred to cluster tubes and incubated with surface antibodies (total volume, 200 µL) for 30 minutes at room temperature. After rinsing with CSM buffer, cells were permeabilized with 0.5 mL of cold methanol for 10 minutes on ice and washed twice with CSM (spin at 600g for 5 minutes after adding the buffer). Cells were then incubated with intracellular antibody cocktail for 30 minutes at room temperature and rinsed with CSM. Cells were resuspended in a buffer containing low-barium PBS, 0.25 µL of Cell-ID Intercalator (Fluidigm), and 1.5% paraformaldehyde. Samples were stored at 4°C until acquired using a CyTOF 2 instrument (Fluidigm). Just before analysis, cells were washed once with CSM and twice with double-distilled water. Cells were resuspended in double-distilled water containing EQ calibration beads (Fluidigm; 139La/151Eu/153Eu/165Ho/175Lu). Throughout the process, cells were kept on ice and acquired at ≈300 cells per second.
Processing of CyTOF data and SPADE analysis
Data were normalized using bead normalization,29 followed by manual gating using Cytobank software (www.cytobank.org). Manual gating was based on 191Ir/193Ir DNA content to exclude debris/doublets,28 cParp negative (nonapoptotic) cells, and Lin− (Gr-1, TCRb, Mac-1, Nk1.1, B220) cells. The remaining cells were gated on CD45.2+ and c-Kit+ and used for further analysis. Following the gating strategy, c-Kit+ cells from each animal were subject to spanning-tree progression analysis of density-normalized events (SPADE) analysis30 using Cytobank. SPADE trees were constructed using default settings, with a target number of nodes of 40 clusters and downsample of 5%. Nine “core” markers were used as clustering channels: CD41, CD16/32, CD34, CD48, Sca-1, c-Kit, CD150, CD135, and CD127. The nodes were annotated based on these same markers.
Heat maps
Cells within the HSC and megakaryocyte-erythrocyte progenitor (MEP) SPADE nodes were exported as FCS files, and single-cell expression of each marker (Eng, pSMAD, pMK2) was arcsinh transformed (factor = 5). The median expression of arcsinh-transformed intensity of each marker was calculated for each population (HSC and MEP) of each individual animal in the group (control and conditional knockout [cKO] Eng mice). Arcsinh ratio was then obtained by subtracting the median arcsinh-transformed value from the column’s maximum value (row = individual mouse). Heat maps were created in R (https://www.r-project.org/) using the following packages: reshape2, readxl, pheatmap, and RColorBrewer. The raw median expression of pSMAD2/3 and pMAPKAPK2 for each population was used to calculate statistical significances between the 2 groups (control vs cKO Eng) using the multiple t test with Holm-Sidak correction (P < .05) in GraphPad.
Statistics
Statistical analysis was determined with the 1-tailed unpaired Student t test using the Holm-Sidak method, with P values < .05 considered significant.
Results
To determine the function of Eng in the adult hematopoietic compartment, we generated an Engfl/Δ;Mx1-Cre+ (cKO Eng) mouse model. Following pIpC injection (Figure 1A), we confirmed Eng depletion in the HSC fraction of cKO Eng mice, whereas HSCs from control mice expressed high levels of Eng (Figure 1B-D). Blood cell counts were monitored for 70 days after the last pIpC injection, and no differences were detected between control mice and cKO Eng mice (Figure 1E-G). Moreover, we observed no effect on the survival of cKO Eng mice for up to 30 weeks postdeletion (Figure 1H). These results indicate that lack of Eng does not affect hematopoiesis under steady-state conditions.
To specifically assess whether Eng is important for HSC function, we transplanted BM cells from pIpC-treated cKO Eng mice and control mice (Figure 2A). Peripheral blood analysis of primary recipient mice revealed that lack of Eng had no impact on overall engraftment (Figure 2B) or lineage reconstitution (Figure 2C). BM assessment showed no differences in the frequency of HSCs (Figure 2D) or in the ability of cKO Eng–transplanted cells to contribute to LSK, HSC, and multipotent progenitor cell fractions (Figure 2E). BM cellularity and the number of HSCs also were not disturbed by the lack of Eng in primary recipients (supplemental Figure 1A). Similar results were found in the spleen of transplanted mice (data not shown). Therefore, these results suggest that the lack of Eng does not impair homing, survival, or the multilineage reconstitution ability of HSCs.
To determine the self-renewal of Eng-deleted HSCs, we performed serial transplantation studies by injecting BM cells from primary engrafted mice, which contained significant donor chimerism (average 75%; Figure 2B, right), into secondary recipients. No competitor cells were injected into secondary or subsequent transplantations. Although no differences were observed in secondary grafts, subsequent tertiary and quaternary transplantations revealed significant loss of engraftment potential in the Eng-deleted group (Figure 2F, P < .0005 and P < .01, respectively). Because the repopulation potential of Eng-deleted BM decreased progressively with each transplantation compared with wild-type BM, these data suggest that lack of Eng impairs HSC self-renewal under stress conditions. Next, we analyzed the cell cycle status of donor-derived HSCs in primary recipients. As shown in Figure 2G-H, the percentage of cycling HSCs (S/G2/M phase) was increased in mice lacking Eng compared with controls (18.7% vs 5.7%; P < .05), whereas the frequency of HSCs in the G0 phase was reduced (68.8% vs 85.0%; P < .01). These results suggest that lack of Eng may impair reentry of HSCs to quiescence. We also investigated whether the lack of Eng would result in an impaired hematopoietic regenerative response to the antineoplastic agent 5-FU. Mice were subjected to 3 doses of 5-FU over 20 weeks. Throughout the study, we observed no differences in blood counts between cKO Eng mice and control mice (supplemental Figure 2). These findings are consistent with the premise that the most primitive noncycling HSCs within the BM HSC pool may be preserved from the 5-FU treatment.31 Nevertheless, because HSC response to TGF-β has been reported to be spatiotemporally sensitive,5 more studies would be required to completely rule out a lack of Eng involvement in HSC response following chemotherapy-induced stress.
To confirm whether the effect in engraftment is cell autonomous, we performed transplantation studies with 100 purified HSCs isolated from pIpC-treated cKO Eng mice and control mice (Figure 3A). As observed with whole BM (Figure 2), peripheral blood analysis of primary recipients showed no significant differences in engraftment (Figure 3B, left) or lineage reconstitution (Figure 3C) between cKO mice and control mice. We then proceeded with serial transplantation, in which 106 BM cells from each primary recipient (that had been previously transplanted with 100 HSCs) were injected into 2 to 4 secondary recipients (for a total of 12 and 13 mice for control and cKO, respectively). Again, no engraftment differences were found in secondary recipients (Figure 3B, middle). However, consistently, as we reached tertiary transplantation (5 secondary recipients representing average CD45.2 were selected and transplanted into 2 or 3 tertiary recipients each), clear defective engraftment was observed in cKO Eng mice (Figure 3B, right). Taken together, these findings support the premise that Eng mediates HSC quiescence/self-renewal through a cell-autonomous mechanism.
To understand how the loss of Eng affects intracellular signaling in HSCs, we performed CyTOF mass cytometry, which uses a next-generation single-cell proteomics platform. Metal-conjugated antibodies against 9 “core” hematopoietic surface markers (supplemental Table 2) were used to generate SPADE tree plots of the Lin−c-Kit+ population. As shown in Figure 4A-B, these 9 “core” surface markers were used to assign each cell cluster. As expected, we detected high expression of Eng in HSCs from control mice (Figure 4C, left panel) but not in the respective cell fractions from cKO Eng mice (Figure 4C, right panel). We observed a similar pattern in MEPs, whose Eng positivity has been described previously.23,32 Our results show significant reduction in pSMAD2/3 levels distinctively in HSCs and MEPs (Figure 4D-E) from cKO Eng mice. Importantly, we also found decreased phosphorylation of the p38 pMAPKAPK2 (or pMK2) (Figure 4D-E), suggesting that Eng is required for canonical and noncanonical TGF-β signaling within these hematopoietic cell fractions.
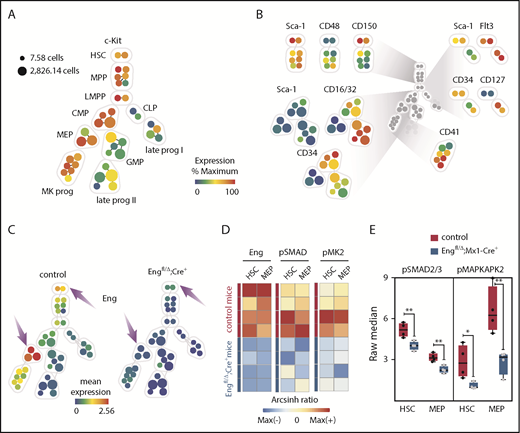
CyTOF analysis reveals HSC defect is due to reduced canonical and noncanonical TGF-β signaling. (A-C) CyTOF analysis. (A) Representative SPADE tree of c-Kit+ cells (gated on nonapoptotic live Lin−c-Kit+ cells) from BM cells from 1 representative control mouse. Each node in the tree represents 1 cluster of phenotypically similar cells, whereas node size corresponds to the number of cells. Nodes are colored according to the mean expression of the indicated marker in that particular node. A core of 9 markers was used to generate the SPADE trees, as well as to assign clusters to specific cell fractions. c-Kit expression in all nodes is shown. (B) Expression of the 9 markers used for cluster classification. (C) Mean expression of Eng in cKO Eng mice (right tree) and control mice (left tree) shows that Eng is highly expressed in HSC and MEP fractions from control mice (arrows) but not in the respective cell fractions from mice transplanted with cells lacking Eng (arrows) (n = 4 per group). (D-E) Expression levels of pSMAD2/3 and pMAPKAPK2 (or pMK2), the canonical and noncanonical downstream effectors of TGF-β, respectively, in cKO Eng mice and control mice reveal reduced activation of the TGF-β signaling pathway in the absence of Eng. (D) Heat map shows Eng, pSMAD2/3, and pMK2 arcsinh ratios for HSCs and MEPs from control mice and cKO Eng mice. Each row represents an individual animal (n = 4 per group). Raw expression was arcsinh transformed and fold change was calculated to the column’s maximum value (arcsinh ratio). (E) Quantification of raw expression for pSMAD2/3 and pMK2 in HSCs and MEPs from control mice (red) and cKO Eng mice (blue). Box plot whiskers represent minimum and maximum values for each cohort. *P < .05, **P < .005.
CyTOF analysis reveals HSC defect is due to reduced canonical and noncanonical TGF-β signaling. (A-C) CyTOF analysis. (A) Representative SPADE tree of c-Kit+ cells (gated on nonapoptotic live Lin−c-Kit+ cells) from BM cells from 1 representative control mouse. Each node in the tree represents 1 cluster of phenotypically similar cells, whereas node size corresponds to the number of cells. Nodes are colored according to the mean expression of the indicated marker in that particular node. A core of 9 markers was used to generate the SPADE trees, as well as to assign clusters to specific cell fractions. c-Kit expression in all nodes is shown. (B) Expression of the 9 markers used for cluster classification. (C) Mean expression of Eng in cKO Eng mice (right tree) and control mice (left tree) shows that Eng is highly expressed in HSC and MEP fractions from control mice (arrows) but not in the respective cell fractions from mice transplanted with cells lacking Eng (arrows) (n = 4 per group). (D-E) Expression levels of pSMAD2/3 and pMAPKAPK2 (or pMK2), the canonical and noncanonical downstream effectors of TGF-β, respectively, in cKO Eng mice and control mice reveal reduced activation of the TGF-β signaling pathway in the absence of Eng. (D) Heat map shows Eng, pSMAD2/3, and pMK2 arcsinh ratios for HSCs and MEPs from control mice and cKO Eng mice. Each row represents an individual animal (n = 4 per group). Raw expression was arcsinh transformed and fold change was calculated to the column’s maximum value (arcsinh ratio). (E) Quantification of raw expression for pSMAD2/3 and pMK2 in HSCs and MEPs from control mice (red) and cKO Eng mice (blue). Box plot whiskers represent minimum and maximum values for each cohort. *P < .05, **P < .005.
Discussion
Eng, a coreceptor for various members of the TGF-β superfamily, is primarily known for its essential role in endothelial cells, where it modulates TGF-β–dependent responses by balancing activating and inhibitory signals.33 However, Eng expression is not restricted to the endothelial lineage. This receptor is expressed in hematopoietic tissues throughout development and in the postnatal stage. Eng is essential for early hematopoietic lineage specification, as evidenced by the significantly impaired primitive hematopoiesis in Eng-deficient yolk sacs17,18 and in early hematopoietic progenitors differentiated in vitro from Eng-knockout embryonic stem cells.34-37 Although Eng has been described as an LT-HSC marker, a role for this receptor in adult hematopoiesis has been questioned, in particular, because ex vivo studies in which Eng was knocked down or overexpressed in BM HSCs did not show differences in 5-FU response or hematopoietic engraftment.32 However, that study did not assess hematopoietic response beyond primary transplantation. Therefore, our findings are actually in agreement, because a phenotype was revealed only upon serial BM transplantation, thus providing strong evidence that Eng is critical for maintenance of the HSC pool.
Although several studies have shown that TGF-β is a physiological regulator of HSC quiescence through signaling of the SMAD2/3 pathway,6,38 noncanonical pathways may also be critically involved.39 For instance, activation of the p38 MAPK cascade has been suggested to mediate the inhibitory effect of TGF-β on hematopoiesis,40 and the downstream effector of p38, MAPKAPK2, was found to be an important regulator of HSC self-renewal.41 Our CyTOF data revealed that Eng plays a critical role in controlling TGF-β–mediated HSC quiescence by positively modulating canonical and noncanonical downstream effectors of the TGF-β signaling pathway. These results provide novel information on the mechanism that connects 2 important signaling pathways downstream of TGF-β, in which Eng is a central key to control HSC function (Figure 5).
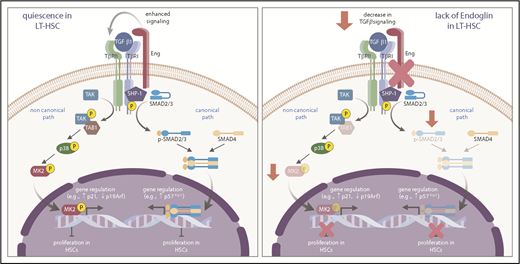
Proposed model for the function of Eng in HSC quiescence. During transplantation-induced stress (left panel), Eng enhances TGF-β signaling in HSCs, resulting in activation of canonical (SMADs) and noncanonical (TAK1/p38/MK2) pathways, which ultimately leads to regulation of genes that control the cell cycle, and inhibition of the proliferation of HSCs, which ultimately promotes the HSC return to quiescence. However, lack of Eng (right panel) results in decreased signaling of canonical and noncanonical TGF-β pathways, resulting in enhanced proliferation of HSCs and impaired HSC quiescence.
Proposed model for the function of Eng in HSC quiescence. During transplantation-induced stress (left panel), Eng enhances TGF-β signaling in HSCs, resulting in activation of canonical (SMADs) and noncanonical (TAK1/p38/MK2) pathways, which ultimately leads to regulation of genes that control the cell cycle, and inhibition of the proliferation of HSCs, which ultimately promotes the HSC return to quiescence. However, lack of Eng (right panel) results in decreased signaling of canonical and noncanonical TGF-β pathways, resulting in enhanced proliferation of HSCs and impaired HSC quiescence.
It has been shown that TGF-β has a differential proliferative effect on distinct HSC subtypes, arresting the cell cycle of lymphoid-biased HSCs but inducing proliferation of myeloid-biased HSCs.42 Although the mechanisms underlying this dual response are largely unknown, one reasonable explanation is that differential expression of TGF-β receptors among various cell types could differentially regulate SMAD and noncanonical pathways, resulting in opposing responses. Our results support this premise, because we found Eng to be almost exclusively expressed on LT-HSCs and MEPs, cell types in which this receptor controls SMAD2/3 and MK2 pathways. Thus, Eng may represent an important key regulator of TGF-β–induced HSC quiescence.
Moreover, TGF-β also induces the terminal differentiation of committed erythroid progenitors, while inhibiting the proliferation of early progenitors.43 The proposed mechanism behind this dual effect is due to the fact that, in erythroid cells, the transcription intermediary factor 1 γ competes with SMAD4 to bind to SMAD2/3, inducing erythroid differentiation in response to TGF-β, whereas SMAD4/SMAD2/3 mediates antiproliferative responses.44 Interestingly, p38 MAPK has also been shown to promote erythroid differentiation.45 Because Eng has been previously demonstrated to inhibit the proliferation of erythroid progenitors while increasing the differentiation of committed progenitors,32 our data also provide important mechanistic insight into the regulation of SMAD2/3 and p38/MK2 signaling during erythropoiesis.
It has been shown that TGF-β signaling is crucial for HSC return to quiescence during BM recovery from stress, but it appears to be redundant during homeostasis.5 In that study, the investigators demonstrated that brief TGF-β blockage after chemotherapy prolonged HSC cycling, delayed their reentry into the G0 phase, and provided a competitive advantage to these cells. Because the effect of TGF-β blockade was observed in all hematopoietic lineages, it was suggested that approaches interfering with the TGF-β signaling pathway could represent an effective way of enhancing BM regeneration. Here, we demonstrated that lack of Eng critically impairs the return of HSCs to quiescence after transplantation-induced stress through canonical and noncanonical TGF-β pathways (Figure 5). Thus, it is plausible to hypothesize that the use of a monoclonal antibody to Eng could also potentially promote the expansion of engraftable LT-HSCs by prolonging their cycling; however, specific studies would need to be performed to determine whether this is the case, and if so, the spatiotemporal window during which to modulate the downstream effectors of Eng. Taken together, our findings provide novel information on the mechanism that connects 2 important signaling pathways downstream of TGF-β, in which Eng is a central key to control HSC function.
The online version of this article contains a data supplement.
The publication costs of this article were defrayed in part by page charge payment. Therefore, and solely to indicate this fact, this article is hereby marked “advertisement” in accordance with 18 USC section 1734.
Acknowledgments
The authors thank Helen Arthur for the Eng floxed mice.
This work was supported by National Institutes of Health (NIH), National Heart, Lung, and Blood Institute (NHLBI) grants R01-HL085840 and U01-HL100407, and NIH, National Institute of Arthritis and Musculoskeletal and Skin Diseases grants R01-AR055299 and R01-AR071439 (R.C.R.P.), and NIH, NHLBI grant T32HL007062 (J.B.). J.B. is the recipient of a Hartwell Foundation Fellowship.
Authorship
Contribution: L.B. designed the study, performed experiments, analyzed the data, and wrote the manuscript; V.K.P.O. performed experiments, analyzed the data, and contributed to the writing of the manuscript; J.B. performed experiments and contributed to the writing of the manuscript; S.C.B. contributed to the experimental design of CyTOF studies and the interpretation of results; and R.C.R.P. supervised the overall project, designed experiments, analyzed the data, and wrote the manuscript.
Conflict-of-interest disclosure: The authors declare no competing financial interests.
Correspondence: Rita C. R. Perlingeiro, Lillehei Heart Institute, University of Minnesota, 4-128 CCRB, 2231 6th St SE, Minneapolis, MN 55455; e-mail: perli032@umn.edu.

This feature is available to Subscribers Only
Sign In or Create an Account Close Modal