

Key Points
Asrij interacts with COP9 signalosome subunit CSN5 to prevent MDM2-mediated p53 degradation and maintains mouse bone marrow HSC quiescence.
Asrij is a novel regulator of wild-type p53 stability in HSCs and could help design targeted therapies for myeloproliferative disease.

Abstract
Inactivation of the tumor suppressor p53 is essential for unrestrained growth of cancers. However, only 11% of hematological malignancies have mutant p53. Mechanisms that cause wild-type p53 dysfunction and promote leukemia are inadequately deciphered. The stem cell protein Asrij/OCIAD1 is misexpressed in several human hematological malignancies and implicated in the p53 pathway and DNA damage response. However, Asrij function in vertebrate hematopoiesis remains unknown. We generated the first asrij null (knockout [KO]) mice and show that they are viable and fertile with no gross abnormalities. However, by 6 months, they exhibit increased peripheral blood cell counts, splenomegaly, and an expansion of bone marrow hematopoietic stem cells (HSCs) with higher myeloid output. HSCs lacking Asrij are less quiescent and more proliferative with higher repopulation potential as observed from serial transplantation studies. However, stressing KO mice with sublethal γ irradiation or multiple injections of 5-fluorouracil results in reduced survival and rapid depletion of hematopoietic stem/progenitor cells (HSPCs) by driving them into proliferative exhaustion. Molecular and biochemical analyses revealed increased polyubiquitinated protein levels, Akt/STAT5 activation and COP9 signalosome subunit 5 (CSN5)-mediated p53 ubiquitination, and degradation in KO HSPCs. Further, we show that Asrij sequesters CSN5 via its conserved OCIA domain, thereby preventing p53 degradation. In agreement, Nutlin-3 treatment of KO mice restored p53 levels and reduced high HSPC frequencies. Thus, we provide a new mouse model resembling myeloproliferative disease and identify a posttranslational regulator of wild-type p53 essential for maintaining HSC quiescence that could be a potential target for pharmacological intervention.
Introduction
Bone marrow (BM) hematopoietic stem cells (HSCs) self-renew and can differentiate to all blood lineages to replenish the blood system after immune challenge, radiation, or chemotherapy.1,2 The BM hematopoietic niche is a specialized microenvironment that houses HSCs and plays important roles in regulating their quiescence, self-renewal, and fate specification.3 At the apex of the hematopoietic hierarchy is a pool of dormant HSCs4 whose fundamental property is quiescence. The interplay of several cell-intrinsic (transcription factors, signal transducers, epigenetic regulators) and cell-extrinsic (niche-induced) factors maintains quiescence and protects the HSC pool from premature exhaustion.5,6 Stringent control of HSC proliferation and differentiation maintains steady-state hematopoiesis.7 Despite considerable progress, molecular processes that regulate HSC quiescence are incompletely characterized. Hence, identification of novel regulators of HSCs is crucial.
The tumor suppressor p53 is expressed at high levels in HSCs8 and maintains self-renewal and quiescence by regulating the activity of various downstream targets such as p21, gfi1, and necdin.9 Approximately, 50% of human sporadic cancers have inactivating mutations and deletions in TP53.10 However, this is uncommon in hematological malignancies,11,12 occurring in only 8% of acute myeloid leukemia (AML) cases.13 According to the European Leukemia Net Classification, nonmutational wild-type p53 (wtp53) dysfunction is found in nearly all AML subsets.14 Although p53 function in regulation of HSC quiescence, fate, and behavior is well-characterized, relatively little is known about events leading to nonmutational wtp53 dysfunction.14 Stability and activity of p53 are determined primarily by its posttranslational modifications, such as ubiquitination, phosphorylation, and acetylation.15 Hence, a deeper understanding of posttranscriptional regulation of p53 in hematopoiesis is essential.
The tumor invasion/progression protein, Asrij/OCIAD1, is mutated16,17 or shows altered expression in several blood disorders18 (http://servers.binf.ku.dk/bloodspot/?gene=OCIAD1&dataset=all_mile), contains p53-binding sites19 and is implicated in DNA damage signaling.20 Hence, we chose to study its role in mammalian hematopoiesis.
Asrij/OCIAD1, a member of the Ovarian Carcinoma Immunoreactive Antigen (OCIA) domain family,21 was first identified as a gene expressed in mouse embryonic stem (ES) cells and the developing blood vasculature.22 Asrij maintains mouse ES cell pluripotency.23 In Drosophila hematopoiesis, Asrij maintains the niche and negatively regulates blood progenitor differentiation.24 Interestingly, mouse and Drosophila Asrij are true homologs as mouse Asrij can maintain the stem cell state in Drosophila owing to the conserved activity of its N-terminal OCIA domain.23 To elucidate the role of Asrij in vertebrates, we generated the first asrij null mutant mice by Cre-loxP–mediated deletion and analyzed the consequences of asrij depletion. We show that loss of Asrij leads to defective BM hematopoiesis with increased accumulation of polyubiquitinated proteins, increased activation of Akt/STAT5, and reduced stability of wtp53, resulting in HSC expansion and a myeloproliferative disorder. Our findings demonstrate that Asrij is essential for maintaining HSC quiescence.
Methods
Generation and validation of asrij KO mice
C57BL6/J was used as the wild-type strain. Exon 6 of the asrij locus (chromosome 5: 22886700-22887300) was floxed by homologous recombination using a targeting vector in TT2 mouse ES cells. Recombinants selected by G418 resistance and genomic analyses with Southern hybridization were microinjected into ICR (Cd-1) 8-cell stage embryos. Resulting chimeras were crossed to C57BL/6N to obtain germ-line transmitted recombinant progeny. Heterozygous recombinant mice (asrijflox/+) were bred to homozygosity and crossed with CMV-Cre+25 mice for ubiquitous deletion of asrij or to Vav-iCre+26 for deletion in the hematopoietic system. Heterozygotes (asrijflox/+;CMV-Cre+) were bred to generate asrij knockout (KO) mice (see supplemental Methods, available on the Blood Web site).
Statistical analysis and quantification
Means ± standard errors of the mean were plotted as graphs using SigmaPlot11.0. Statistical comparison of complete blood cell counts of mice belonging to different age-matched groups and mice treated with 5-fluorouracil (5-FU) was done using repeated measures analysis of variance (ANOVA) in STATISTICA 7. Statistical comparisons for cell percentages or absolute cell counts, colony number or diameter, spleen weights, transcript, and protein expression levels were done using ANOVA: single factor using Analysis ToolPak in Microsoft Excel 2007. Survival analysis of mice was done using Kaplan-Meier test in SPSS. Statistically significant differences were indicated by *P < .05, **P < .01, and ***P < .001.
Results
Asrij is expressed in BM hematopoietic populations
Asrij expression is primarily restricted to the hematopoietic system in Drosophila.24 Hence, we investigated it in the mouse hematopoietic system. Data mining of the mouse RNA-Seq expression database (http://blood.stemcells.cam.ac.uk/single_cell_atlas.html#data)27 showed high asrij expression in long-term HSCs (LT-HSCs) and progenitor subpopulations (supplemental Figure 1A). Expression profiling of wild-type BM revealed that asrij transcript is highly expressed in LT-HSCs, short-term HSCs (ST-HSCs), and multipotent progenitors (MPPs) as compared with unfractionated BM (supplemental Figure 1B). Flow cytometry analysis showed Asrij expression in about 75.3 ± 5.2% of the BM (supplemental Figure 1C), which included LT-HSCs (46.8 ± 2.84% of Lineage−/low Sca1+ c-Kit+ [LSK]-CD150+ CD48−) (Figure 1A), HSPCs (98.2 ± 0.9% of LSK), and myeloid (92.4 ± 2.3% of CD11b+) and lymphoid (76.8 ± 5.4% of CD19+) lineages (supplemental Figure 1C). In HSPCs, Asrij localized to cytoplasmic puncta positive for endosomal markers Rab4, Rab5, and Rab11 and mitochondrial marker CoxIV (Figure 1B). This suggested a possible role for Asrij in HSCs.


asrij KO mice develop a myeloproliferative disorder. (A) Flow cytometric detection of Asrij expression in LT-HSCs (LSK CD150+CD48−). Percentage of LT-HSCs positive for Asrij is detailed in the histogram overlay. Mean fluorescent intensity values for “FMO control” = 232 and “Asrij stained” = 506 (n = 3 wild-type mice). (B) HSCs (LSK CD150+) were immunostained with antibodies against Asrij (green), various endosome (Rab4, Rab5, Rab11), and mitochondrial (CoxIV) markers (red) and DAPI to mark nuclei (blue). Insets show magnified view of the boxed region. Graphs indicate extent of colocalization in a single confocal plane. Bar represents 2 µm (n = 30 cells from 3 wild-type mice). (C) Schematic showing strategy for generation of floxed allele of asrij at exon 6. Black rectangles, exons; blue triangles, loxP sites; light blue triangles, frt sites; lime green rectangles, neomycin cassette; 5′ probe and 3′ probe, probes for Southern blotting; black arrows, genotyping primers (Arj_F1, Arj_F2, and Arj_R1). (D-P) Floxed and KO cells were analyzed in all cases and are indicated in red and light green, respectively. (D) Graphs show change in PB cell counts (red blood cells, WBCs, and platelets) of floxed (red circles) and KO (green triangles) mice from 2 to 12 months of age. Statistically significant differences determined using repeated measures ANOVA are indicated (n = 10 mice per genotype). (E) Representative flow cytometry plots to show the frequency of Lin− cells, LKs, and LSKs at 6 months of age (n = 7 mice per genotype). (F) Graphs showing frequency of LKs and LSKs within BM and their absolute number per femur and tibia (n = 7 mice per genotype). (G) Flow cytometric analysis of the frequencies of LT-HSCs, ST-HSCs, and MPPs at 6 months of age, identified using SLAM markers CD150/CD48 (n = 7 mice per genotype). (H-I) Graphs showing frequency of LT-HSCs, ST-HSCs, MPP2, and MPP3 within LSK and their absolute number per femur and tibia (n = 7 mice per genotype). (J) Flow cytometric analysis of CMPs, GMPs, and MEPs at 6 months of age (n = 3 mice per genotype). (K-L) Graphs showing frequency of CMPs, GMPs, MEPs and common lymphoid progenitors within BM and their absolute number per femur and tibia (n = 3 mice per genotype). (M) Graph representing frequency of BM CD11b+ and CD19+ subpopulations at 6 months of age (n = 3 mice per genotype). (F,H,I,K,L,M) Statistically significant differences for determined using ANOVA: single factor analysis are indicated. (N) Hematoxylin and eosin staining of BM sections from 2-month-old mice. Right panels show magnified view of the boxed area. Arrow points to osteolytic lesions in KO bone (n = 3 mice per genotype). Bar represents 1 mm. (O) Graph showing change in spleen weight across different age groups. Representative spleen images are shown above the respective age groups. Bar represents 0.5 cm or 1 cm, as indicated (n > 7 mice per genotype). Bars denote standard error of mean. *P < .05, **P < .01, ***P < .001. LK, LIN−c-Kit+Sca-1−; LSK, LIN−c-Kit+Sca-1+.
asrij KO mice develop a myeloproliferative disorder. (A) Flow cytometric detection of Asrij expression in LT-HSCs (LSK CD150+CD48−). Percentage of LT-HSCs positive for Asrij is detailed in the histogram overlay. Mean fluorescent intensity values for “FMO control” = 232 and “Asrij stained” = 506 (n = 3 wild-type mice). (B) HSCs (LSK CD150+) were immunostained with antibodies against Asrij (green), various endosome (Rab4, Rab5, Rab11), and mitochondrial (CoxIV) markers (red) and DAPI to mark nuclei (blue). Insets show magnified view of the boxed region. Graphs indicate extent of colocalization in a single confocal plane. Bar represents 2 µm (n = 30 cells from 3 wild-type mice). (C) Schematic showing strategy for generation of floxed allele of asrij at exon 6. Black rectangles, exons; blue triangles, loxP sites; light blue triangles, frt sites; lime green rectangles, neomycin cassette; 5′ probe and 3′ probe, probes for Southern blotting; black arrows, genotyping primers (Arj_F1, Arj_F2, and Arj_R1). (D-P) Floxed and KO cells were analyzed in all cases and are indicated in red and light green, respectively. (D) Graphs show change in PB cell counts (red blood cells, WBCs, and platelets) of floxed (red circles) and KO (green triangles) mice from 2 to 12 months of age. Statistically significant differences determined using repeated measures ANOVA are indicated (n = 10 mice per genotype). (E) Representative flow cytometry plots to show the frequency of Lin− cells, LKs, and LSKs at 6 months of age (n = 7 mice per genotype). (F) Graphs showing frequency of LKs and LSKs within BM and their absolute number per femur and tibia (n = 7 mice per genotype). (G) Flow cytometric analysis of the frequencies of LT-HSCs, ST-HSCs, and MPPs at 6 months of age, identified using SLAM markers CD150/CD48 (n = 7 mice per genotype). (H-I) Graphs showing frequency of LT-HSCs, ST-HSCs, MPP2, and MPP3 within LSK and their absolute number per femur and tibia (n = 7 mice per genotype). (J) Flow cytometric analysis of CMPs, GMPs, and MEPs at 6 months of age (n = 3 mice per genotype). (K-L) Graphs showing frequency of CMPs, GMPs, MEPs and common lymphoid progenitors within BM and their absolute number per femur and tibia (n = 3 mice per genotype). (M) Graph representing frequency of BM CD11b+ and CD19+ subpopulations at 6 months of age (n = 3 mice per genotype). (F,H,I,K,L,M) Statistically significant differences for determined using ANOVA: single factor analysis are indicated. (N) Hematoxylin and eosin staining of BM sections from 2-month-old mice. Right panels show magnified view of the boxed area. Arrow points to osteolytic lesions in KO bone (n = 3 mice per genotype). Bar represents 1 mm. (O) Graph showing change in spleen weight across different age groups. Representative spleen images are shown above the respective age groups. Bar represents 0.5 cm or 1 cm, as indicated (n > 7 mice per genotype). Bars denote standard error of mean. *P < .05, **P < .01, ***P < .001. LK, LIN−c-Kit+Sca-1−; LSK, LIN−c-Kit+Sca-1+.
asrij KO mice develop a myeloproliferative disorder
In Drosophila, Asrij maintains postembryonic blood progenitors and suppresses their differentiation.24 Hence, we generated asrij floxed mice (see “Methods”; Figure 1C; supplemental Figure 1D) to investigate the consequences of asrij deletion (supplemental Figure 1E-I) on steady-state hematopoiesis. Mice lacking a single copy of asrij (asrij+/−; supplemental Figure 2A) expressed much reduced levels of Asrij compared with control (supplemental Figure 1B-C) and showed a modest increase in red blood cells and platelets only from 6 months of age, with no significant difference in HSPC frequencies or spleen sizes (supplemental Figure 2D-F). However, deletion of both alleles of asrij (asrij−/−; KO) caused significantly increased peripheral blood (PB) cell counts in young mice (2-4 months), with a progressive increase in counts with age (Figure 1D). Flow cytometry showed increased percentages of neutrophils and granulocytes (Gr1+), monocytes, and macrophages (CD11b+), and reduced percentages of B-cells (CD19+) and T cells (CD3+) in 6-month-old KO mice (supplemental Figure 3A). KO mice had significantly increased BM cellularity at 2 and 6 months of age compared with controls (supplemental Figure 3B). Compared with control, KO mice showed significantly increased percentages and absolute numbers of myeloid-enriched progenitor population (Lin− c-Kit+), HSPCs, LT-HSCs (LSK-CD150+CD48−), ST-HSCs (LSK-CD150-CD48−), and MPP2s (LSK-CD150+CD48+), whereas MPP3s (LSK-CD150−CD48+) were fewer (Figure 1E-I). Similar results were obtained using the CD34/Flk2 marker combination (supplemental Figure 3C-D), confirming that Asrij depletion results in an expansion of HSC pools.
Percentages and absolute numbers of granulocyte-macrophage progenitors (GMPs) in the Lin− c-Kit+ subpopulation as well as the CD11b+ myeloid fraction were significantly increased in KO mice (Figure 1J-M), whereas common lymphoid progenitors and CD19+ lymphoid fraction were significantly reduced (Figure 1K-M). In agreement with the HSC expansion and increased myeloid differentiation observed, immunoblotting showed increased activation of critical downstream signaling molecules such as Akt (S473) and STAT5 (Y694) in KO HSPCs (supplemental Figure 3E-F).28 Bone histology showed myeloid infiltration of cells into femurs of 2-month-old KO mice (Figure 1N). KO mice also developed splenomegaly (Figure 1O) and had enlarged splenic follicles and infiltration in other tissues such as liver and kidney by 12 months of age (supplemental Figure 3G). Moreover, KO mice showed reduced lifespan and are more prone to developing kyphosis (supplemental Figure 4; supplemental Results). Taken together, Asrij depletion causes aberrant HSC expansion and a myeloproliferative disorder.
Asrij regulates HSC quiescence and proliferation
To identify how Asrij maintains the stem cell compartment, we examined the cell-cycle status of KO HSPCs and HSCs. Hoescht 33342/Pyronin-Y staining showed that KO HSPCs including LT-HSCs, ST-HSCs, and MPPs had significantly reduced cells in G0, as compared with control subpopulations (Figure 2A). Ki-67/7-aminoactinomycin D (7-AAD) staining confirmed the increased proliferative potential of KO HSPCs and HSCs (Figure 2B). This was additionally confirmed by in vitro OP9 coculture experiments with LSK-CD34−/+ subpopulations, which showed that KO HSPCs formed larger colonies that were also greater in number compared with control (Figure 2C). In addition, significantly increased HSPC percentages were observed in spleen and PB of KO mice (Figure 2D). In a methylcellulose colony-forming unit (CFU) assay, BM cells and splenocytes from 6-month-old mice showed a significant increase in the colony frequencies and sizes of CFU-GMs (granulocyte/macrophage), whereas burst-forming unit erythroid, and CFU-granulocyte/erythroid/macrophage/megakaryocyte colonies were comparable to control (Figure 2E-F). These data support an intrinsic role for Asrij in regulating HSC quiescence and proliferation.

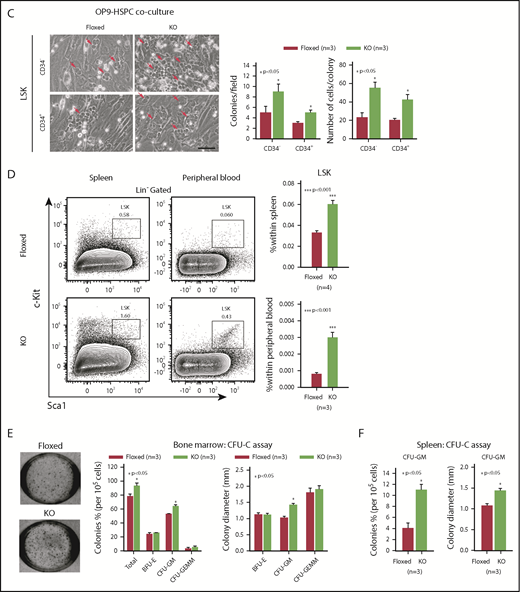
Asrij depletion significantly reduces quiescence and increases proliferation of HSCs. Floxed and KO cells were analyzed in all cases and are indicated in red and light green, respectively. (A) Representative Hoescht 33342/Pyronin-Y flow cytometric plots and graphs showing the cell-cycle distribution of HSPCs, LT-HSCs, ST-HSCs, and MPPs (n = 3 mice per genotype). (B) Cell proliferation analysis using Ki-67/7-AAD staining of HSPCs, LT-HSCs, ST-HSCs, and MPPs (n = 3 mice per genotype). (C) Representative images of OP9-HSPC cocultures showing colonies (red arrows) formed by HSPC (LSK-CD34− and LSK-CD34+) subpopulations. Bar represents 50 µm. Graphs quantify number of colonies formed and number of cells/colony (n = 3 mice per genotype). (D) Flow cytometric analysis and quantification of the HSPC frequencies in spleen and PB (n = 4 mice per genotype). CFU-C assay to test the differentiation potential of (E) BM cells and (F) splenocytes harvested from 6-mo-old mice under erythromyeloid promoting conditions (n = 3 mice per genotype). (E) Graphs show relative distribution of total, BFU-E, CFU-GM, and CFU-granulocyte/erythroid/macrophage/megakaryocyte colonies scored based on their morphology and colony diameter. (F) Graphs show colony percentage and colony diameter of CFU-GMs formed by splenocytes. Statistically significant differences identified using ANOVA: single factor analysis are indicated. Error bars denote standard error of mean. *P < .05 and **P < .01.
Asrij depletion significantly reduces quiescence and increases proliferation of HSCs. Floxed and KO cells were analyzed in all cases and are indicated in red and light green, respectively. (A) Representative Hoescht 33342/Pyronin-Y flow cytometric plots and graphs showing the cell-cycle distribution of HSPCs, LT-HSCs, ST-HSCs, and MPPs (n = 3 mice per genotype). (B) Cell proliferation analysis using Ki-67/7-AAD staining of HSPCs, LT-HSCs, ST-HSCs, and MPPs (n = 3 mice per genotype). (C) Representative images of OP9-HSPC cocultures showing colonies (red arrows) formed by HSPC (LSK-CD34− and LSK-CD34+) subpopulations. Bar represents 50 µm. Graphs quantify number of colonies formed and number of cells/colony (n = 3 mice per genotype). (D) Flow cytometric analysis and quantification of the HSPC frequencies in spleen and PB (n = 4 mice per genotype). CFU-C assay to test the differentiation potential of (E) BM cells and (F) splenocytes harvested from 6-mo-old mice under erythromyeloid promoting conditions (n = 3 mice per genotype). (E) Graphs show relative distribution of total, BFU-E, CFU-GM, and CFU-granulocyte/erythroid/macrophage/megakaryocyte colonies scored based on their morphology and colony diameter. (F) Graphs show colony percentage and colony diameter of CFU-GMs formed by splenocytes. Statistically significant differences identified using ANOVA: single factor analysis are indicated. Error bars denote standard error of mean. *P < .05 and **P < .01.
Asrij contributes to the repopulation ability of HSCs and aids in recovery from hematopoietic stress
Aberrant hematopoietic phenotypes in KO mice could be due to defects in HSCs or in the BM microenvironment that provides the stem cell niche. To evaluate whether KO BM could reconstitute the hematopoietic system of lethally irradiated mice, we performed serial noncompetitive BM transplantation (BMT) (see “Methods”; Figure 3A). Transplanted recipients were assessed for donor contribution to confirm successful engraftment of CD45.2+ cells. Primary transplants injected with KO BM showed significantly increased white blood cells (WBCs) and platelets, had significant HSPC expansion and also showed splenomegaly (Figure 3B-D), reminiscent of the hematopoietic phenotypes observed in KO mice. Similarly, secondary transplants injected with KO BM also developed phenotypes similar to the primary transplants (Figure 3E-G). Thus, compared with control, KO BM cells have a higher in vivo reconstitution ability and the KO phenotypes are transplantable. Further, to assess the contribution of the BM microenvironment to the KO hematopoietic phenotype, we performed reciprocal BMT (see “Methods”; supplemental Figure 5A). KO mice injected with CD45.1+ BM did not show any difference in PB counts, HSPC frequencies, or spleen weights as compared with floxed mice that were similarly injected (supplemental Figure 5B-D). This indicates that absence of Asrij in the BM microenvironment does not affect the repopulation ability of wild-type HSPCs and that the KO niche can support hematopoiesis. Conversely, similar to ubiquitous KO, hematopoietic-specific deletion of asrij (asrijflox/flox; Vav-iCre+ [asrijCKO]) leads to increased PB cell counts and HSPC frequencies, confirming that Asrij expression in hematopoietic lineages is essential for regulating hematopoiesis (supplemental Figure 6A-F).

Asrij depletion results in increased repopulation ability and affects hematopoietic recovery from stress. Floxed and KO cells were compared in all cases and are indicated in red and light green, respectively. (A) Schematic representation of the transplantation study. A total of 5 × 10⁶ BM cells harvested from 6-month-old (CD45.2+) asrij floxed or KO mice were injected into lethally irradiated (9.5 Gy) 2-month-old CD45.1 mice. These CD45.1 mice (primary transplants) were analyzed for PB cell counts at monthly intervals. Four months after transplantation, 1 × 10⁶ BM cells harvested from the primary transplants were injected into another set of lethally irradiated (9.5 Gy) CD45.1 recipients (secondary transplants), which were similarly analyzed. (B-G) Outcome of serial BMT assayed by analysis of (B,E) PB cell counts (n = 10 mice per genotype) at monthly intervals after transplant, (C,F) HSPC frequencies (n = 3 mice per genotype), and (D,G) spleen weights (n = 3 mice per genotype) at 4 months posttransplant. Mice that received KO BM had significantly increased WBC and platelet counts, HSPC frequencies and spleen weights than those that received asrij floxed BM. (D,G) Bar represents 1 cm. Statistically significant differences for PB cell counts, identified using repeated measures ANOVA, and for HSPC frequencies and spleen weights, identified using ANOVA: single factor analysis, are indicated. (H) Kaplan-Meier survival analysis of 2-month-old mice stressed with sublethal dosage of γ irradiation (6.5 Gy, n = 10 mice per genotype). ***P < .001, generalized Wilcoxon test. (I) PB cell count analysis after irradiation (n = 10 mice per genotype). (J) Flow cytometric analysis and quantification of HSPC frequencies after irradiation (n = 3 mice per genotype). (K) Representative Ki-67/7-AAD flow cytometric plots and quantification showing the cell-cycle distribution of HSCs after irradiation (n = 3 mice per genotype). (L) Kaplan-Meier survival analysis of 2-month-old mice stressed with 5-FU, weekly, for 3 weeks (150 mg/kg of mouse body weight, n = 10 mice per genotype). *P < .05, generalized Wilcoxon test. (M) PB cell count analysis after 5-FU treatment shows significantly reduced WBCs in KO mice as compared with floxed controls (n = 10 mice per genotype). Statistically significant differences for (I-K) identified using ANOVA: single factor analysis and for (M) identified using repeated measures ANOVA are indicated. Black arrow, time of stress administration to mice. Error bars denote standard error of mean. *P < .05, **P < .01, and ***P < .001.
Asrij depletion results in increased repopulation ability and affects hematopoietic recovery from stress. Floxed and KO cells were compared in all cases and are indicated in red and light green, respectively. (A) Schematic representation of the transplantation study. A total of 5 × 10⁶ BM cells harvested from 6-month-old (CD45.2+) asrij floxed or KO mice were injected into lethally irradiated (9.5 Gy) 2-month-old CD45.1 mice. These CD45.1 mice (primary transplants) were analyzed for PB cell counts at monthly intervals. Four months after transplantation, 1 × 10⁶ BM cells harvested from the primary transplants were injected into another set of lethally irradiated (9.5 Gy) CD45.1 recipients (secondary transplants), which were similarly analyzed. (B-G) Outcome of serial BMT assayed by analysis of (B,E) PB cell counts (n = 10 mice per genotype) at monthly intervals after transplant, (C,F) HSPC frequencies (n = 3 mice per genotype), and (D,G) spleen weights (n = 3 mice per genotype) at 4 months posttransplant. Mice that received KO BM had significantly increased WBC and platelet counts, HSPC frequencies and spleen weights than those that received asrij floxed BM. (D,G) Bar represents 1 cm. Statistically significant differences for PB cell counts, identified using repeated measures ANOVA, and for HSPC frequencies and spleen weights, identified using ANOVA: single factor analysis, are indicated. (H) Kaplan-Meier survival analysis of 2-month-old mice stressed with sublethal dosage of γ irradiation (6.5 Gy, n = 10 mice per genotype). ***P < .001, generalized Wilcoxon test. (I) PB cell count analysis after irradiation (n = 10 mice per genotype). (J) Flow cytometric analysis and quantification of HSPC frequencies after irradiation (n = 3 mice per genotype). (K) Representative Ki-67/7-AAD flow cytometric plots and quantification showing the cell-cycle distribution of HSCs after irradiation (n = 3 mice per genotype). (L) Kaplan-Meier survival analysis of 2-month-old mice stressed with 5-FU, weekly, for 3 weeks (150 mg/kg of mouse body weight, n = 10 mice per genotype). *P < .05, generalized Wilcoxon test. (M) PB cell count analysis after 5-FU treatment shows significantly reduced WBCs in KO mice as compared with floxed controls (n = 10 mice per genotype). Statistically significant differences for (I-K) identified using ANOVA: single factor analysis and for (M) identified using repeated measures ANOVA are indicated. Black arrow, time of stress administration to mice. Error bars denote standard error of mean. *P < .05, **P < .01, and ***P < .001.
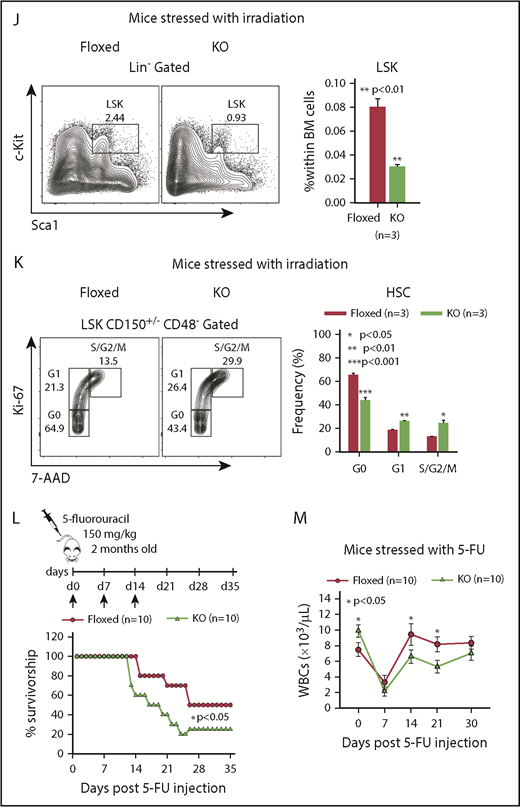
The reduced quiescence of KO HSCs suggested that KO mice may be more susceptible to stress. To test the contribution of Asrij to stress-induced hematopoiesis, we exposed control and KO mice to radiation and chemically induced stress. Although all control mice subjected to a sublethal dose (6.5 Gy) of γ irradiation survived beyond 25 days, similarly irradiated KO mice showed significantly reduced survival with ∼50% of the mice succumbing to radiation within 15 days (Figure 3H). Both control and KO mice showed distinct leukopenia and erythropenia phenotypes, 7 days postirradiation, with KO mice showing significantly lower PB cell counts (Figure 3I). Consistent with this observation, 12 days postirradiation, KO BM had significantly reduced HSPC percentages (Figure 3J). Ki-67/7-AAD staining 12 days postirradiation showed significantly increased percentage of KO HSCs in the S/G2/M phases (Figure 3K), compared with control, indicating increased radiation-induced proliferation drives KO HSPCs toward premature exhaustion.
Chemical stress was achieved by injecting 5-FU, a cell cycle–specific cytotoxic agent that preferentially targets proliferating HSPCs. Mice repeatedly injected with 150 mg/kg of 5-FU, weekly, for a period of 3 weeks, were assayed for survival and PB cell counts. KO mice showed significantly increased lethality and reduced WBCs (Figure 3L-M) when compared with similarly treated controls, indicating that Asrij deletion sensitizes mice to hematopoietic ablation. Taken together, our analysis shows that Asrij is essential for mediating hematopoietic recovery after exposure to stress.
Increased p53 degradation and DNA damage in asrij KO HSPCs
Tumor suppressors play important roles in maintaining hematopoiesis under both normal and stress conditions.9,29-33 Because Asrij downregulation is linked to p53 and DNA damage pathways34 and KO mice have an HSPC expansion phenotype, similar to Trp53 null mice,35-38 we checked the status of p53 and DNA damage in KO mice. The Trp53 exon sequence showed no mutation, including the cancer-associated mutation hotspots (codons 245, 248, and 273; data not shown) and transcript level was unchanged (Figure 4A). However, in KO HSPCs, p53 protein levels were significantly reduced suggesting that Asrij regulates p53 posttranscriptionally (Figure 4B). Further, expression of pro-apoptotic p53 targets puma and noxa was significantly reduced, whereas p21, bcl2, gga1, gfi1, and necdin were unaltered (Figure 4C). In agreement with this, KO LT-HSCs and ST-HSCs showed significantly reduced percentages of early (Annexin V+/7-AAD−) and late (Annexin V+/7-AAD+) apoptotic cells compared with control (Figure 4D-F). Importantly, KO HSPCs showed reduced apoptosis compared with control, both in vivo and ex vivo after short-term culture (Figure 4G). p53 also orchestrates a variety of DNA damage responses.39 Immunoblotting analysis showed higher ϒH2AX levels in KO HSPCs, suggesting increased accumulation of DNA damage upon Asrij depletion (Figure 4H).
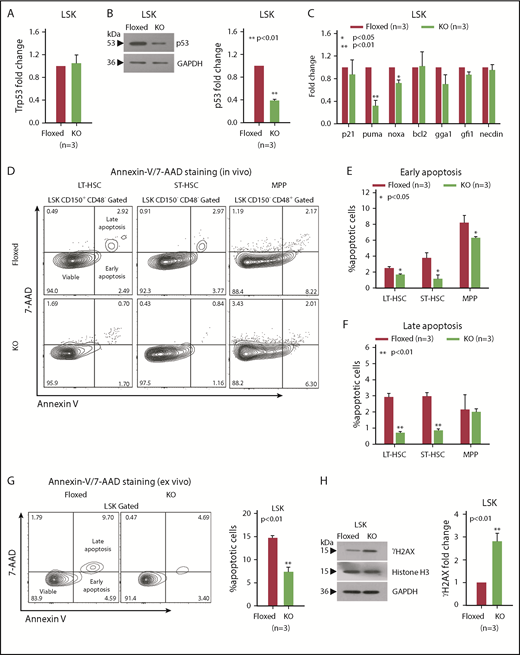
asrij KO HSPCs have reduced p53 protein levels and increased DNA damage. Floxed and KO cells from 2-month-old mice were compared in all cases (unless mentioned otherwise) and are indicated in red and light green, respectively. (A) RT-qPCR analysis for p53 transcript levels and (B) immunoblot analysis for p53 protein levels in HSPCs. (C) RT-qPCR analysis for p21, puma, noxa, bcl2, gga1, gfi1, and necdin transcript levels in HSPCs. (D-G) Representative Annexin V/7-AAD flow cytometry plots and graphs showing significantly reduced percentages of early and late apoptotic cells in 6-month-old KO HSPCs compared with floxed controls, both in vivo and ex vivo after short-term culture. (H) Immunoblot analysis for ϒH2AX protein levels to assess DNA damage in HSPCs. Histone H3 and GAPDH: loading controls. (A-H) n = 3 mice per genotype for each experiment. Statistically significant differences in transcript and protein levels were determined using ANOVA: single factor analysis. Error bars denote standard error of mean. *P < .05 and **P < .01. GAPDH, glyceraldehyde-3-phosphate dehydrogenase; RT-qPCR, reverse transcription quantitative polymerase chain reaction.
asrij KO HSPCs have reduced p53 protein levels and increased DNA damage. Floxed and KO cells from 2-month-old mice were compared in all cases (unless mentioned otherwise) and are indicated in red and light green, respectively. (A) RT-qPCR analysis for p53 transcript levels and (B) immunoblot analysis for p53 protein levels in HSPCs. (C) RT-qPCR analysis for p21, puma, noxa, bcl2, gga1, gfi1, and necdin transcript levels in HSPCs. (D-G) Representative Annexin V/7-AAD flow cytometry plots and graphs showing significantly reduced percentages of early and late apoptotic cells in 6-month-old KO HSPCs compared with floxed controls, both in vivo and ex vivo after short-term culture. (H) Immunoblot analysis for ϒH2AX protein levels to assess DNA damage in HSPCs. Histone H3 and GAPDH: loading controls. (A-H) n = 3 mice per genotype for each experiment. Statistically significant differences in transcript and protein levels were determined using ANOVA: single factor analysis. Error bars denote standard error of mean. *P < .05 and **P < .01. GAPDH, glyceraldehyde-3-phosphate dehydrogenase; RT-qPCR, reverse transcription quantitative polymerase chain reaction.
The ubiquitin-proteasome system plays critical roles in regulating the levels and activity of p53.40,41 Hence, reduced p53 in KO HSPCs could be due to aberrant ubiquitination resulting in increased p53 degradation. Immunostaining revealed increased accumulation of polyubiquitinated proteins in KO BM cells suggesting this machinery is deregulated in the absence of Asrij (Figure 5A). Immunopulldown followed by immunoblotting showed increased levels of ubiquitinated-wtp53 in KO BM as compared with control, indicating increased p53 degradation (Figure 5B). Thus, Asrij depletion results in reduced p53 levels and increased DNA damage in HSPCs.
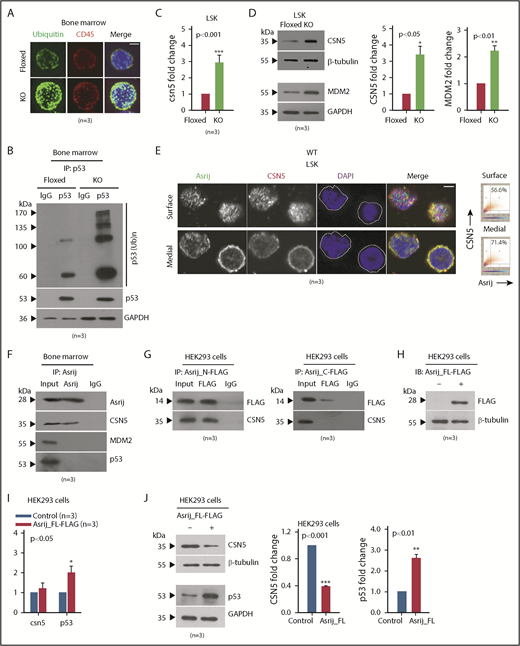
Asrij interacts with and regulates CSN5 to maintain p53 levels in the BM. (A-D) Floxed and KO cells from 2-month-old mice were compared in all cases and are indicated in red and light green, respectively. (A) Immunostaining shows increased accumulation of polyubiquitinated proteins in KO BM cells compared with floxed controls (n = 30 cells from 3 mice per genotype). Maximum intensity projection of confocal microscopy images. (B) IP of endogenous p53 from whole BM shows increased levels of polyubiquitinated p53 in KO compared with asrij floxed. (C) RT-qPCR analysis for csn5 transcript levels in HSPCs (n = 3 mice per genotype). (D) Immunoblot analysis and quantification of CSN5 and MDM2 levels in HSPCs (n = 3 mice per genotype). (E) Surface and medial confocal planes of the same cell showing localization of Asrij (green) and CSN5 (red) in HSPCs (n = 30 cells from 3 mice per genotype). White dotted line marks the cell boundary. Plots show percent colocalization in surface and medial planes. (F) IP of endogenous Asrij in BM lysates from 2-month-old mice shows interaction with CSN5 but not with MDM2 or p53. (G-J) Lysates from HEK293 cells expressing FLAG-tagged Asrij constructs. (G) Asrij N- and C-terminal fragments were subjected to FLAG IP and probed for interaction with CSN5. At least 2 independent IP experiments were performed with similar results. (H-J) Asrij_FL-FLAG expressing cells (H) validated for FLAG expression by immunoblotting (n = 3), and for CSN5, MDM2, and p53 (I) transcript (J) and protein expression, as indicated. (A,E) Nuclei stained with DAPI (blue) and bars represent 2 µm. Statistically significant differences in transcript and protein levels determined using ANOVA: single factor analysis are indicated. Error bars denote standard error of mean. *P < .05, **P < .01 and ***P < .001. IP, immunoprecipitation.
Asrij interacts with and regulates CSN5 to maintain p53 levels in the BM. (A-D) Floxed and KO cells from 2-month-old mice were compared in all cases and are indicated in red and light green, respectively. (A) Immunostaining shows increased accumulation of polyubiquitinated proteins in KO BM cells compared with floxed controls (n = 30 cells from 3 mice per genotype). Maximum intensity projection of confocal microscopy images. (B) IP of endogenous p53 from whole BM shows increased levels of polyubiquitinated p53 in KO compared with asrij floxed. (C) RT-qPCR analysis for csn5 transcript levels in HSPCs (n = 3 mice per genotype). (D) Immunoblot analysis and quantification of CSN5 and MDM2 levels in HSPCs (n = 3 mice per genotype). (E) Surface and medial confocal planes of the same cell showing localization of Asrij (green) and CSN5 (red) in HSPCs (n = 30 cells from 3 mice per genotype). White dotted line marks the cell boundary. Plots show percent colocalization in surface and medial planes. (F) IP of endogenous Asrij in BM lysates from 2-month-old mice shows interaction with CSN5 but not with MDM2 or p53. (G-J) Lysates from HEK293 cells expressing FLAG-tagged Asrij constructs. (G) Asrij N- and C-terminal fragments were subjected to FLAG IP and probed for interaction with CSN5. At least 2 independent IP experiments were performed with similar results. (H-J) Asrij_FL-FLAG expressing cells (H) validated for FLAG expression by immunoblotting (n = 3), and for CSN5, MDM2, and p53 (I) transcript (J) and protein expression, as indicated. (A,E) Nuclei stained with DAPI (blue) and bars represent 2 µm. Statistically significant differences in transcript and protein levels determined using ANOVA: single factor analysis are indicated. Error bars denote standard error of mean. *P < .05, **P < .01 and ***P < .001. IP, immunoprecipitation.
Asrij interacts with CSN5 and negatively regulates its levels in HSPCs
To probe further into the mechanism that drives HSPC expansion phenotype in asrij KO mice, we looked for other mouse models with similar phenotypes of aberrant hematopoiesis. Transgenic mice that overexpress the COP9 signalosome (CSN) component CSN5 were also reported to develop an HSPC expansion phenotype at ∼6 months age.42 CSN5 is the fifth subunit of the COP9 signalosome, an evolutionary conserved protein complex that regulates the fate of the ubiquitin-proteasome pathway.43-45 Importantly, CSN5 is a negative regulator of p53.46 Because KO HSPCs had reduced wild-type p53 protein levels, we checked the status of CSN5 and found a significant upregulation in its transcript and protein expression (Figure 5C-D). Immunoblotting of asrijCKO BM revealed a similar perturbation of the CSN5-p53 signaling axis (supplemental Figure 7A-C). CSN5 stabilizes MDM2, the E3-ubiquitin ligase that ubiquitinates p53 and marks it for degradation.47 Consistent with the finding that tumors with reduced p53 have overexpression of MDM2/MDMX, a major mechanism promoting inactivation of wtp53,48 KO HSPCs had increased levels of MDM2 (Figure 5D). Thus, Asrij is essential for controlling levels of the CSN5-MDM2 axis to maintain p53 levels.
Similar to mouse fibroblasts,49 in HSPCs, CSN5 localizes to the nucleus as well as the cytoplasm (Figure 5E). Analysis of multiple confocal planes showed significantly increased colocalization of Asrij and CSN5 in the cytoplasm as compared with the nucleus (4′-6-diamidino-2-phenylindole [DAPI] stained) (Figure 5E). To explore the possibility of a more direct connection between Asrij and CSN5/MDM2/p53, we performed immunopulldown of endogenous Asrij in wild-type BM cells and found interaction with CSN5 but not with MDM2 or p53 (Figure 5F). The N-terminal OCIA domain of Asrij interacts with several proteins including STAT3 and ARF1 and is necessary and sufficient for Asrij function.14,23,50 To identify the region of Asrij that mediates interaction with CSN5, we performed immunoprecipitation on human embryonic kidney 293 (HEK293) cells expressing FLAG-tagged mouse Asrij N-terminal fragment that contains the OCIA domain (1-132 aa) or the C-terminal fragment excluding the domain (133-247 aa).23 CSN5 coimmunoprecipitated with the Asrij N-terminal, but not the C-terminal (Figure 5G). Moreover, forced expression of FLAG-tagged full-length Asrij in HEK293 cells (Figure 5H) did not alter csn5 transcript levels; however, p53 transcript levels were significantly increased (Figure 5I). Additionally, CSN5 protein levels were significantly reduced and p53 protein levels increased, suggesting that ectopic expression of Asrij could rescue wtp53 proteolysis (Figure 5J).
Treating asrij KO mice with Nutlin-3 rescues the HSPC expansion phenotype
To confirm that reduced p53 activation or stability contributes to loss of quiescence of KO HSCs, we pharmacologically inhibited p53 degradation and looked for reversal of the HSPC expansion phenotype observed in KO mice. Nutlin-3, a small molecule antagonist of MDM2, inhibits p53-MDM2 interaction, thereby activating p53 signaling in cancer cells.51 Mice were injected intraperitoneally with 20 mg/kg of Nutlin-3 and assayed for p53 protein levels and HSPC frequencies 24 hours postinjection (Figure 6A). Immunoblotting showed that Nutlin-3 restored p53 levels in KO HSPCs to near control levels (Figure 6B). Further, the increased HSPC frequencies in KO mice were also reduced to control levels (Figure 6C). Thus, restoring p53 expression in asrij KO mice rescues the HSPC expansion phenotype (Figure 6D).

Nutlin-3 treatment activates p53 and corrects the aberrant HSPC expansion of asrij KO mice. (A) Schematic showing protocol followed for Nutlin-3 treatment of mice and their subsequent analyses. Eight-month-old asrij floxed and KO mice were injected intraperitoneally with 20 mg/kg of Nutlin-3 and then analyzed for p53 activation by immunoblotting and HSPC frequencies by flow cytometry. (B) Immunoblot analysis of HSPCs shows increased wtp53 levels in Nutlin-3 treated mice compared with DMSO-treated controls in floxed and KO genotypes (n = 4 per genotype). Loading control: GAPDH. (C) Representative flow cytometry plots and graph show that Nutlin-3 reduces the increased HSPC frequencies observed in KO mice to near control levels (n = 6 per genotype). (D) Model representing mechanism of action of Asrij that regulates HSC quiescence. Blue solid line indicates protein interaction. Statistically significant differences in HSPC frequencies determined using ANOVA: single factor analysis are indicated. Error bars denote standard error of mean. *P < .05 and ***P < .001.
Nutlin-3 treatment activates p53 and corrects the aberrant HSPC expansion of asrij KO mice. (A) Schematic showing protocol followed for Nutlin-3 treatment of mice and their subsequent analyses. Eight-month-old asrij floxed and KO mice were injected intraperitoneally with 20 mg/kg of Nutlin-3 and then analyzed for p53 activation by immunoblotting and HSPC frequencies by flow cytometry. (B) Immunoblot analysis of HSPCs shows increased wtp53 levels in Nutlin-3 treated mice compared with DMSO-treated controls in floxed and KO genotypes (n = 4 per genotype). Loading control: GAPDH. (C) Representative flow cytometry plots and graph show that Nutlin-3 reduces the increased HSPC frequencies observed in KO mice to near control levels (n = 6 per genotype). (D) Model representing mechanism of action of Asrij that regulates HSC quiescence. Blue solid line indicates protein interaction. Statistically significant differences in HSPC frequencies determined using ANOVA: single factor analysis are indicated. Error bars denote standard error of mean. *P < .05 and ***P < .001.
Discussion
To ensure lifelong blood cell production, it is important that HSCs maintain the balance between self-renewal and differentiation. Most hematological malignancies are characterized by a progressive loss of this balance that eventually leads to increased HSCs and biased lineage differentiation.52 Dysregulation of tumor suppressor pathways and accumulation of DNA damage are major mechanisms that lead to aberrant hematopoiesis.53 The tumor suppressor p53 plays critical roles in HSPC maintenance.54 However, mechanisms governing its stability are incompletely understood. Our analysis of the role of Asrij in hematopoiesis revealed a novel component that regulates the p53 degradation machinery in HSPCs.
The normal roles of the OCIAD family members in vertebrates are not known though they are implicated in several pathologies. Hence, we generated a global KO mouse to study the role of Asrij in vertebrates and its hematopoietic depletion to understand its role in the blood system, given its reported role in Drosophila hematopoiesis. Interestingly, in spite of Asrij expression in several tissues, null mice showed no apparent defect in development or fertility. However, there was an increasing effect on hematopoietic tissues with age, the cumulative nature of which, suggests that it is due to perturbed blood cell homeostasis. Asrij global or hematopoietic-specific KO, both showed perturbed steady-state hematopoiesis in PB, BM, and spleen. Interestingly, heterozygous mutants developed mild phenotypes, possibly owing to reduced (<50%) Asrij expression, suggesting a dose-dependent requirement for Asrij in regulating hematopoiesis.
Both in vivo and in vitro experiments show that asrij depletion accelerates HSPC expansion and promotes differentiation into granulocyte/macrophage progenitors, inducing a myeloproliferative disorder, at least in part because of increased Akt (S473) and STAT5 (Y694) activation.55 The expanded HSPC pool retains HSC self-renewal properties as seen by the ability of KO BM to repopulate irradiated recipients in serial BMT experiments. However, the BM niche is not Asrij-dependent because reciprocal BMT shows that the mutant niche can support hematopoiesis. Taken together, these data indicate that reduced quiescence of KO HSCs is a cell-intrinsic property and not from an unsupportive microenvironment. Further, HSPCs from asrijCKO mice show similar properties, confirming its role in HSPCs. Additional studies will be required to dissect Asrij function, if any, in the BM microenvironment.
Radiation or chemical-induced stress revealed that the expanded HSPC and myeloid pools in asrij KO mice do not confer protection but reduce response to stress and lifespan. The unusual results obtained from BMT and irradiation/5-FU treatment assays could be because of differences in the nature of the stress and the niche in which KO HSCs are placed in each case. Additionally, it could also be due to the differential regulation of cell cycle of HSCs under steady state and stressed conditions. Thus, Asrij is essential for mediating recovery of the hematopoietic system to maintain homeostasis and its depletion impairs the ability for sustained hematopoiesis. Interestingly, key mediators of inflammation such as Akt, STAT5, and CSN556-58 are upregulated in KO from younger ages, before the overt cellular phenotype sets in. This suggests a role for Asrij in controlling inflammation stress that merits further investigation. The increasing severity of KO phenotypes with age and the myeloid bias is reminiscent of several human myeloproliferative neoplasms (MPNs).59 Further, this suggests that as with the csn5 and runx3 mutant mouse models,42,60 asrij KO is also an important model of late onset MPNs. However, unlike csn5 and runx3 global mutants that are not viable,60,61 asrij KO is viable and fertile, making it a more relevant and versatile model for understanding human MPNs.
Inactivating mutations and deletions in p53 are implicated in >50% of human solid tumors,62-65 but infrequently in hematological malignancies.66-70 Moreover, p53 expression is absent or reduced in human myeloid leukemia cell lines.71 Although the mechanism for p53 silencing in many such cases remains unknown, this is an important factor contributing to cancer progression.71 Our work unveils several possible mechanisms that could be causing aberrant HSC expansion, including wtp53 dysfunction. Asrij positively regulates wtp53 levels to maintain the HSPC pool. In its absence, wtp53 degradation increases, which partly contributes to the abnormal HSPC proliferation accompanied by reduced apoptosis, correlating with reduced puma and noxa expression. Additionally, the increased levels of polyubiquitinated proteins in asrij KO BM cells (suggesting impaired activity of the ubiquitin-proteasome system) and increased Akt/STAT5 activation could also be contributing to the aberrant hematopoietic phenotypes. Increased proliferation and DNA damage strongly suggest that Asrij regulates HSPCs under conditions of replicative stress. This could explain the increased susceptibility of KO mice to genotoxic and chemical stress, which are normally overcome by controlled self-renewal of quiescent HSCs and progenitor proliferation to replenish the depleted BM. Under conditions of stress, loss of Asrij leads to uncontrolled proliferation and premature stem cell exhaustion.
The asrij KO phenotypes are strikingly similar to those of CSN5 transgenic mice. Although CSN5 antagonizes Trp53 transcription,47 Trp53 transcript levels in KO HSPCs remain unaffected. Asrij interacts with CSN5 and negatively regulates its transcript and protein expression. Further, because Asrij does not interact with MDM2 or p53, it provides means for distant control of signals that regulate p53 ubiquitination and degradation.
The multifunctionality of CSN5 is often attributed to its dual subcellular localization, ability to shuttle between the nucleus and cytoplasm, and mediate cellular functions independent of the COP9 signalosome complex.18,19 Immunolocalization analysis suggests that the interaction between CSN5 and Asrij may be primarily in the cytoplasm. Our results provide new leads to investigate nonnuclear regulation by CSN5 in HSPCs. We propose that just as Asrij integrates multiple signaling pathways such as JAK/STAT,23 Notch,24 and phosphatidylinositol 3-kinase/Akt50 pathways in Drosophila hematopoiesis, it may similarly integrate multiple inputs in BM hematopoiesis. STAT5 is constitutively activated in several hematopoietic tumors55 and aberrant phosphatidylinositol 3-kinase/AKT activation is seen in most AML cases with wtp53 dysfunction via MDM2 activation.72 Increased Akt/STAT5 activation negatively regulates p53 expression.73,74 Thus, Asrij may regulate the extent of MDM2-mediated wtp53 ubiquitination and degradation in HSPCs, in multiple ways such as determining CSN5 availability or Akt/STAT5 activation. Loss of this important additional check on mediators of wtp53 degradation could be one important reason why cancers arise in the absence of p53 mutation.
Targeted activation of dysfunctional wtp53 may potentially improve treatment of hematological malignancies characterized by reduced p53 levels. Rescue of the KO HSPC expansion phenotype by Nutlin-3 treatment reinforces that Asrij functions upstream of p53 for HSPC maintenance. Further, mild phenotypes in the heterozygous KO suggest that Asrij tunes the degradation machinery in a dose-dependent manner, to regulate p53 levels posttranscriptionally. Stabilization and activation of p53 also depends on numerous factors such as cellular stress, hypoxia, and metabolic changes. Whether these factors are affected in KO HSPCs needs additional investigation.
Apart from perturbed Asrij expression, missense mutations in its OCIA domain have also been reported in patients suffering from chronic lymphocytic leukemia (residue: F45L)16 and B-cell lymphoma (residue: A119E).17 Interestingly, although Asrij has been implicated in a variety of human cancers, KO mice mostly developed a hematopoietic disorder, possibly because the relatively high turnover of BM cells makes them more susceptible to the effects of reduced p53. This may also be because Asrij lies mostly under the transcriptional control of factors such as Runx1, GATA1, Spi1/PU.1, Myc, and Fos, which have well-defined roles in hematopoiesis (http://codex.stemcells.cam.ac.uk/).75 The role of Asrij, if any, in fetal hematopoiesis or other tissue-specific stem cells remains to be tested.
In summary, asrij KO mice provide a valuable tool to unravel novel mechanisms that drive malignant transformation of HSPCs in the absence of Trp53 mutations. Patients with myelodysplastic syndromes have increased csn5 expression and reduced levels of p53 and asrij,76 which correlates with results obtained from experiments with asrij KO mice, making our findings clinically relevant. Our study supports a requirement for including p53 functional diagnostics14 to achieve precise treatment of leukemias. Pathologies characterized by wtp53 dysfunction could be treated by pharmacologically activating context-dependent upstream modulators, such as Asrij.
Please e-mail the corresponding author regarding requests for original data (see supplemental Methods for additional information.)
The online version of this article contains a data supplement.
The publication costs of this article were defrayed in part by page charge payment. Therefore, and solely to indicate this fact, this article is hereby marked “advertisement” in accordance with 18 USC section 1734.
Acknowledgments
The authors thank Asok Mukhopadhyay, National Institute of Immunology, for CD45.1 and CD45.2 mice; Abhishek Sinha for the FLAG-tagged reporter construct expressing mouse Asrij; Abhilash Lakshman for help with repeated measures ANOVA and Kaplan-Meier survival analyses; the anonymous reviewers for their careful reading and insightful comments; Bertie Gottgens for help with data analysis; JNCASR and NCBS Imaging; instrumentation and animal facilities, and Inamdar laboratory members for fruitful discussions.
This work was funded by grants from Indo-French Centre for the Promotion of Advanced Research and intramural funds from DBT-JNCASR “Life Science Research Education and Training” project. NCBS Animal Facility is partially supported by DBT National Mouse Research Resource grant (BT/PR5981/MED/31/181/2012,2013-2016).
Authorship
Contribution: M.S.I. conceived the project; M.S.I., T.A., H.K., and K.V. designed the strategy for generation of asrij knockout mice; S.S., M.S.I., T.A., H.K., T.R.D., R.Y., and V.A.B. performed research and collected data; S.S., T.R.D., and M.S.I. analyzed and interpreted data, performed statistical analysis, and prepared figures; S.S. and M.S.I. wrote the manuscript.
Conflict-of-interest disclosure: The authors declare no competing financial interests.
Correspondence: Maneesha S. Inamdar, Jawaharlal Nehru Centre for Advanced Scientific Research, Jakkur P.O., Bangalore 560064, India; e-mail: inamdar@jncasr.ac.in.

This feature is available to Subscribers Only
Sign In or Create an Account Close Modal