

Key Points
PD-L1 gene alterations, identified in ∼25% of DLBCL, are characterized by heightened measures of host immune surveillance in this disease.
PD-L1 gene alterations are associated with response to PD-1 blockade in DLBCL, making this a promising biomarker for future investigation.

Abstract
Programmed death-ligand 1 (PD-L1) expression on malignant cells is a dominant immune escape mechanism across a variety of human cancers. A unique genetic mechanism underlying PD-L1 upregulation has been uncovered in classical Hodgkin lymphoma (cHL), in which copy gains of the chromosomal region (9p24.1) containing the programmed death-1 (PD-1) ligands PD-L1 and PD-L2 are recurrently observed. While chromosome 9p24.1 copy-number alterations are ubiquitous in cHL, they also occur in diffuse large B-cell lymphoma (DLBCL), albeit with a lower incidence. Here, fluorescence in situ hybridization was used to identify DLBCLs harboring PD-L1 gene alterations, thereby enabling a characterization of the immunogenomic landscape of these lymphomas. Among 105 DLBCL cases analyzed, PD-L1 alterations were identified in 27%. PD-L1 alterations were highly enriched among non–germinal center DLBCLs and exhibited robust PD-L1 protein expression. These lymphomas were heavily infiltrated by clonally restricted T cells and frequently downregulated human leukocyte antigen expression. RNA sequencing of PD-L1–altered DLBCLs revealed upregulation of genes involved in negative T-cell regulation and NF-κB pathway activation, while whole-exome sequencing identified frequent mutations in genes involved in antigen presentation and T-cell costimulation. Many of these findings were validated in a large external data set. Interestingly, DLBCL patients with PD-L1 alterations had inferior progression-free survival following front-line chemoimmunotherapy; however, in the relapsed/refractory setting, PD-L1 alterations were associated with response to anti-PD-1 therapy. Collectively, our results indicate that PD-L1 alterations identify a unique biological subset of DLBCL in which an endogenous antilymphoma immune response has been activated, and that is associated with responsiveness to PD-1 blockade therapy.
Introduction
Diffuse large B-cell lymphoma (DLBCL) is the most common lymphoma diagnosed in the United States.1 Although a majority of patients are cured with modern chemoimmunotherapy, ∼40% will have primary-refractory or relapsed disease,2 which is difficult to eradicate and associated with high rates of early mortality.3,4 Even in the era of CD19-directed chimeric antigen receptor T-cell therapy, which is effective in this population, the reality remains that many patients are not candidates for this aggressive therapy or will benefit only briefly from it.5 New approaches are therefore needed to prevent and effectively treat relapsed disease.
Recently, enthusiasm has grown to incorporate programmed death-1 (PD-1) blockade immunotherapy for DLBCL due to its tremendous efficacy in classical Hodgkin lymphoma (cHL)6,7 and other aggressive B-cell lymphomas.8-10 However, objective response rates to anti-PD-1 therapy in unselected patients with relapsed/refractory DLBCL is modest (10% to 36%).11,12 These mixed outcomes likely reflect the heterogeneous nature of DLBCL, as demonstrated by gene expression profiling13-15 and large-scale genomic analyses,16-18 and suggest that if anti-PD-1 monotherapy is to impact the management of DLBCL, then future efforts should be focused on developing predictive biomarkers that accurately identify subsets of patients likely to benefit from this treatment approach.
In solid cancers, infiltration and local activation of T cells indicates the presence of a spontaneous antitumor immune response and enriches for the subset of patients benefitting from PD-1 blockade.19-21 This so-called T-cell–inflamed phenotype may also be a prerequisite for response to anti-PD-1 therapy in lymphoma, as exemplified by cHL, which is characterized by pronounced T-cell infiltration and exquisite sensitivity to PD-1 blockade.6,7 cHL also exhibits near-universal copy gains of the programmed death-ligand 1 (PD-L1) locus on chromosome 9p24.1, and the degree of PD-L1 amplification correlates with the depth and duration of response following anti-PD-1 therapy.22,23 These observations suggest that lymphomas with enhanced T-cell infiltration and PD-L1 copy-number alterations (CNAs) may be inherently more sensitive to PD-1 blockade. Interestingly, PD-L1 gene alterations, including CNAs and translocations, have also been reported in a subset of DLBCLs.24 Whether PD-L1 gene-altered DLBCLs are similarly characterized by enhanced host immune surveillance or are inherently more sensitive to anti-PD-1 therapy is not known, and these critical questions were addressed in the current study.
Methods
Patient samples
Formalin-fixed, paraffin-embedded (FFPE) DLBCL sections were obtained from the Institutional Review Board–approved University of Chicago Hoogland lymphoma biorepository. Each biopsy was reviewed by 2 hematopathologists (G.V. and J.P.) for diagnostic confirmation. Primary mediastinal B-cell lymphoma (PMBL), gray-zone lymphoma, and lymphoma associated with Epstein-Barr virus or HIV were excluded. Clinical information and outcome data were obtained from a corresponding electronic database. Archived tissues and response data from KEYNOTE-013 were provided by Merck. An external genomic DLBCL database was acquired through dbGaP (phs001444.v1.p1) to validate the primary cohort findings.17
Fluorescence in situ hybridization (FISH)
FISH was performed by an expert cytogeneticist (J.M.) as previously described.25 FISH probes targeted PD-L1 (CD274, Empire Genomics), centromere 9 (CEP9, Abbott), and a region centromeric to PD-L2 (RP11-610G2, Empire Genomics) to assess for PD-L1 translocations. Thirty lymphoma cells were analyzed per sample. Nuclei were considered PD-L1 amplified if the PD-L1/CEP9 ratio was ≥3:1. Nuclei with ≥3 PD-L1 signals and PD-L1/CEP9 ratios of >1:1 but <3:1 were defined as relative PD-L1 copy gain, and those with a probe ratio of 1:1 but with >2 copies of each probe were classified polysomic for chromosome 9. PD-L1 translocations were called if split signals were observed between PD-L1 and translocation probes. The frequency of lymphoma cells harboring each type of PD-L1 alteration was assessed, and cases were considered PD-L1 altered if ≥20% of lymphoma cells exhibited alterations.
Immunohistochemistry (IHC)
PD-L1 (E1L3N, Cell Signaling), CD4 (SP35, Sigma-Aldrich), CD8 (SP16, Sigma-Aldrich), HLA I (EMR8-5, Abcam), and HLA II (EPR11226, Abcam) IHCs were independently scored by 2 hematopathologists (G.V. and J.P.). PD-L1 expression was quantified using an H-score, which was the product of the average staining intensity of tumor cells (0 = absent, 1 = weak, 2 = moderate, and 3 = strong) and the percentage of lymphoma cells that stained positive for PD-L1. T-cell infiltration was determined by averaging the number of lymphocytes within 3 representative high-power fields (40× magnification). DLBCLs were classified as HLA I and II expression negative if >90% of lymphoma cells displayed absent membrane staining. DLBCLs exhibiting a 50% to 90% reduction (unequivocally reduced or absent compared with surrounding nonmalignant cells) were categorized as having reduced HLA expression. All other DLBCLs were classified as having positive HLA expression.
RNA sequencing (RNA-seq)
RNA was extracted using the AllPrep DNA/RNA FFPE kit (Qiagen). One microgram of RNA was allocated for library preparation following the deoxyuridine triphosphate strand-specific protocol, with ribosomal RNA removed using the Ribo-Zero rRNA Kit (Illumina), and 50-bp single-end reads were generated on an Illumina HiSeq 4000 platform at The University of Chicago Genomics Facility. See supplemental Methods (available on the Blood Web site) for additional details regarding RNA-seq analysis. RNA-seq data are available from the European Genome-phenome Archive (EGA) under the accession number EGAS00001003552.
Whole-exome sequencing (WES) and T-cell receptor (TCR) β-chain sequencing
Tumor DNA was isolated using the AllPrep DNA/RNA FFPE kit. Germline DNA was obtained from peripheral blood using the DNeasy Blood/Tissue kit (Qiagen). Whole-exome and untranslated regions were captured using the Agilent SureSelect All Exon V6 plus UTR kit, and 101-bp paired-end reads were generated using Illumina HiSeq2500 at Theragen Etex Bio Institute. See supplemental Methods for additional details regarding WES processing, putative somatic mutation calling, and neoantigen prediction. WES data are available from the EGA under the accession number EGAS00001003551.
Extracted DNA was also submitted to Adaptive Biotechnologies for survey-level TCR-β sequencing. Targeted amplicon libraries were prepared by multiplex polymerase chain reaction targeting all TCR-β V and J gene segments and sequenced using an Illumina HiSeq system. Data for individual TCR sequences, including V and J gene segment identification and CDR3 sequences, were analyzed using Adaptive’s ImmunoSEQ Analyzer.
Statistical analyses
Associations between categorical and continuous variables were determined by Fisher’s exact test and Mann-Whitney U test, respectively. The Kaplan-Meier method was used to estimate progression-free survival (PFS), and the log-rank test was used to assess survival differences between groups. Hazard ratios (HRs) with 95% confidence intervals were calculated using a Cox proportional-hazards model. Differences were considered significant at *P < .05, **P < .01, ***P < .001, and ****P < .0001.
Results
PD-L1 alterations are a recurring genetic phenomenon in DLBCL and are associated with high-risk features
PD-L1 FISH was performed on 105 DLBCL specimens. The nature and treatment status of each sample is provided in supplemental Table 1. A diagram depicting the DNA-binding regions of the FISH probes used is shown in Figure 1A. Of the cases examined, 77 (73%) were PD-L1 disomic, while 28 (27%) harbored PD-L1 gene alterations (Figure 1B). The 28 PD-L1 gene–altered cases were classified according to the highest-degree genetic alteration observed (amplification = translocation > relative copy gain > chromosome 9 polysomy), as most demonstrated a spectrum of PD-L1 structural variations (Figure 1B-D). Overall, 17 (16%) specimens exhibited relative PD-L1 copy gains, 7 (7%) harbored PD-L1 amplifications, 2 (2%) harbored PD-L1 translocations, and 2 (2%) were polysomic for chromosome 9 (Figure 1B). Consistent with previous observations in cHL,22 DLBCL cases exhibiting high-level PD-L1 alterations, namely amplifications and translocations, were associated with the lowest frequencies of residual PD-L1 disomic cells (Figure 1D; supplemental Figure 1).
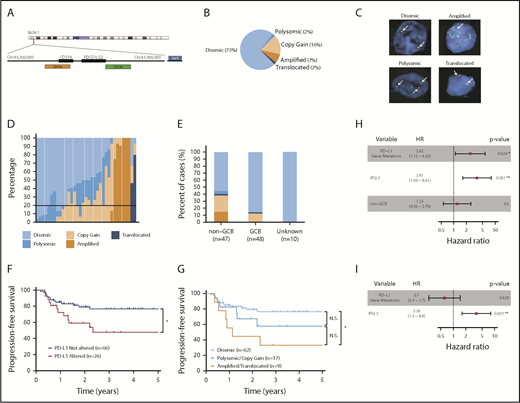
PD-L1 gene alterations are recurrently observed in DLBCL and are associated with inferior PFS to front-line chemoimmunotherapy. (A) Chromosome 9 structure. Enlarged below is the 9p24.1 region encoding PD-L1 and PD-L2. PD-L1, centromere 9, and translocation FISH probes are shown in orange, blue, and green respectively. (B) Incidence of PD-L1 alterations according to underlying mechanism. (C) Representative DLBCL cells with the indicated PD-L1 locus status as assessed by FISH. Arrows indicate signals for PD-L1 (orange) and translocation (green) probes. Split signals are seen between PD-L1 and translocation probes in the representative DLBCL with a PD-L1 translocation. (D) Waterfall plot demonstrating the frequency of lymphoma cells (30 analyzed/specimen) with the indicated PD-L1 locus status. The horizontal black line represents the minimum number of lymphoma cells required for a case to be considered PD-L1 altered (20% of cells). (E) Incidence of PD-L1 alterations by cell of origin (*P < .05, Fisher’s exact test). (F) PFS of DLBCL patients with or without PD-L1 gene alterations. (*P = .024, log-rank test). (G) PFS of DLBCL patients according to specific PD-L1 alteration (*P = .012, log-rank test). Clinical and genetic univariate (H) and multivariate (I) risk models for PFS in DLBCL.
PD-L1 gene alterations are recurrently observed in DLBCL and are associated with inferior PFS to front-line chemoimmunotherapy. (A) Chromosome 9 structure. Enlarged below is the 9p24.1 region encoding PD-L1 and PD-L2. PD-L1, centromere 9, and translocation FISH probes are shown in orange, blue, and green respectively. (B) Incidence of PD-L1 alterations according to underlying mechanism. (C) Representative DLBCL cells with the indicated PD-L1 locus status as assessed by FISH. Arrows indicate signals for PD-L1 (orange) and translocation (green) probes. Split signals are seen between PD-L1 and translocation probes in the representative DLBCL with a PD-L1 translocation. (D) Waterfall plot demonstrating the frequency of lymphoma cells (30 analyzed/specimen) with the indicated PD-L1 locus status. The horizontal black line represents the minimum number of lymphoma cells required for a case to be considered PD-L1 altered (20% of cells). (E) Incidence of PD-L1 alterations by cell of origin (*P < .05, Fisher’s exact test). (F) PFS of DLBCL patients with or without PD-L1 gene alterations. (*P = .024, log-rank test). (G) PFS of DLBCL patients according to specific PD-L1 alteration (*P = .012, log-rank test). Clinical and genetic univariate (H) and multivariate (I) risk models for PFS in DLBCL.
Interestingly, PD-L1 alterations were highly enriched in DLBCLs with a non–germinal center B-cell (non-GCB) phenotype as assessed by the Hans algorithm.26 Overall, 45% of non-GCB specimens harbored PD-L1 alterations compared with only 15% of GCB cases (Figure 1E). Clinical characteristics of patients with and without PD-L1 alterations are shown in Table 1. The median age and sex distribution were similar between the 2 groups. However, patients with PD-L1 gene–altered DLBCLs more frequently exhibited high-risk clinical features, including advanced-stage disease (82% vs 53%) and a higher mean LDH level at diagnosis (442 U/L vs 308 U/L), and were more likely to have high or high-intermediate international prognostic index (IPI) scores (71% vs 31%).
Clinical characteristics of patients according to PD-L1 gene status
| PD-L1 altered (n = 28) | PD-L1 unaltered (n = 77) | P | |
|---|---|---|---|
| Age, median (range), y | 62.5 (25-88) | 57 (20-89) | NS |
| Male sex | 57% | 59% | NS |
| Cell of origin | |||
| Non-GCB | 75% | 34% | <.01 |
| GCB | 25% | 53% | .01 |
| Unknown | 0% | 13% | NS |
| Advanced stage | 82% | 53% | <.01 |
| Average LDH | 442 | 308 | .03 |
| Extranodal sites >1 | 54% | 30% | .03 |
| High or high-intermediate IPI | 71% | 31% | <.01 |
| CD30 positive | 44% | 24% | .03 |
| Dual MYC/BCL2 expression | 50% | 41% | NS |
| MYC translocation | 5% | 21% | NS |
| Double-hit lymphoma | 0% | 8% | NS |
LDH, lactate dehydrogenase; NS, not significant.
We next assessed the impact of PD-L1 alterations on clinical outcomes following front-line chemoimmunotherapy (R-CHOP or dose-adjusted R-EPOCH). Long-term follow-up data were available for 92 of the 105 patients. Overall, PD-L1 gene–altered DLBCL patients had significantly inferior PFS after a median follow-up of 4.2 years (HR, 2.62; 95% confidence interval [CI], 1.12 to 6.20; P = .024; Figure 1F). Additionally, when patients were segregated according to the underlying mechanism of PD-L1 alteration (amplification/translocation vs copy gain/polysomy vs unaltered), a clear trend toward decreasing PFS was observed among patients with higher-degree PD-L1 alterations (Figure 1G). The negative prognostic significance of PD-L1 alterations, however, was not maintained on multivariate analysis due to strong associations with high-risk IPI scores (Figure 1H-I).
PD-L1 gene alterations are associated with increased PD-L1 protein expression in DLBCL
To determine the degree to which PD-L1 alterations were associated with enhanced PD-L1 protein expression on DLBCL cells, IHC was performed on 93 cases. PD-L1 expression was quantitated using an H-score (range, 0-300; described further in “Methods”). Using an arbitrary H-score of ≥30 to define PD-L1 positivity, we observed that 64% of PD-L1 altered DLBCLs were PD-L1 positive, compared with only 8% of non-PD-L1 altered cases (Figure 2A). A clear correlation existed between the PD-L1 H-score and the underlying type of PD-L1 alteration (Figure 2B; supplemental Figure 2). DLBCLs with PD-L1 amplifications and translocations exhibited the highest PD-L1 H-scores, with near-uniform positive expression on malignant B cells. PD-L1 H-scores were intermediate in DLBCLs with relative PD-L1 copy gains, while DLBCLs with chromosome 9 polysomy and those without PD-L1 alterations were largely PD-L1 negative.
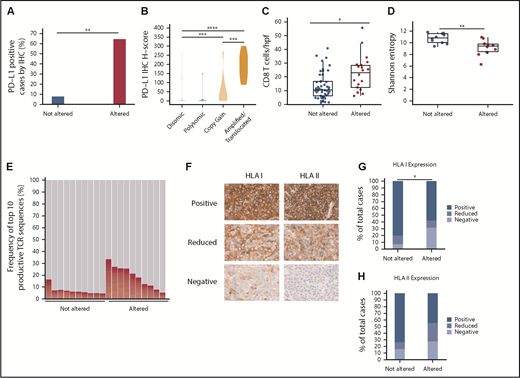
PD-L1 gene alterations are associated with increased PD-L1 protein expression, enhanced CD8+ T-cell infiltration, and decreased HLA class I expression in DLBCL. (A) Percentage of PD-L1–positive (H-score ≥30) DLBCLs according to PD-L1 locus status (**P < .01, Fisher’s exact test) (B) Violin plot demonstrating PD-L1 H-scores for DLBCLs with the indicated PD-L1 locus status (***P < .001 and ****P < .0001, Mann-Whitney U test). (C) Numbers of CD8+ T cells/hpf in DLBCLs with vs without PD-L1 gene alterations (*P < .05, Mann-Whitney U test). (D) TCR-β repertoire diversity among DLBCLs with and without PD-L1 alterations as measured by Shannon entropy (**P < .01, Mann-Whitney U test). (E) Overall contribution to the TCR repertoire by the top 10 TCR-β sequences in PD-L1 altered vs unaltered DLBCLs (P < .01, Mann-Whitney U test). (F) Representative IHC staining for HLA class I and II expression in DLBCL (40× magnification). Note in the HLA class I negative case the positive HLA I staining on infiltrating immune cells serving as an internal positive control. (G-H) Quantitative data showing percentage of DLBCLs with decreased/absent HLA class I (*P < .05, Fisher’s exact test) and II (P = .063) expression according to PD-L1 locus status.
PD-L1 gene alterations are associated with increased PD-L1 protein expression, enhanced CD8+ T-cell infiltration, and decreased HLA class I expression in DLBCL. (A) Percentage of PD-L1–positive (H-score ≥30) DLBCLs according to PD-L1 locus status (**P < .01, Fisher’s exact test) (B) Violin plot demonstrating PD-L1 H-scores for DLBCLs with the indicated PD-L1 locus status (***P < .001 and ****P < .0001, Mann-Whitney U test). (C) Numbers of CD8+ T cells/hpf in DLBCLs with vs without PD-L1 gene alterations (*P < .05, Mann-Whitney U test). (D) TCR-β repertoire diversity among DLBCLs with and without PD-L1 alterations as measured by Shannon entropy (**P < .01, Mann-Whitney U test). (E) Overall contribution to the TCR repertoire by the top 10 TCR-β sequences in PD-L1 altered vs unaltered DLBCLs (P < .01, Mann-Whitney U test). (F) Representative IHC staining for HLA class I and II expression in DLBCL (40× magnification). Note in the HLA class I negative case the positive HLA I staining on infiltrating immune cells serving as an internal positive control. (G-H) Quantitative data showing percentage of DLBCLs with decreased/absent HLA class I (*P < .05, Fisher’s exact test) and II (P = .063) expression according to PD-L1 locus status.
PD-L1 gene–altered DLBCLs are infiltrated by clonally restricted T cells
To explore the association between PD-L1 alterations and T-cell infiltration in DLBCL, IHC for CD4 and CD8 was performed on 68 cases. CD4+ and CD8+ T cells were enumerated by averaging their absolute numbers within 3 representative high-power fields (hpfs). Using this method, absolute numbers of lymphoma-infiltrating CD8+ T cells were significantly increased in PD-L1 gene–altered DLBCLs (22.6 vs 13.3 CD8+ T cells/hpf; Figure 2C; supplemental Figure 2). There was no difference in CD4+ T-cell infiltration between the 2 cohorts (supplemental Figure 3).
TCR-β deep sequencing was next performed to compare TCR repertoire diversities in PD-L1 gene–altered and unaltered DLBCLs. As measured by Shannon entropy,27 the TCR-β repertoire of PD-L1 gene–altered DLBCLs was significantly less diverse than that of unaltered DLBCLs (Figure 2D). Furthermore, the top 10 TCR-β sequences comprised a greater fraction of the total TCR-β repertoire in PD-L1 gene–altered DLBCLs compared with PD-L1–unaltered DLBCLs (14.57% vs 6.17%; P < .01; Figure 2E), suggesting that the higher T-cell numbers in PD-L1 gene–altered DLBCLs may represent a pool of presumably antigen-specific T cells that had expanded in the lymphoma microenvironment.
PD-L1 gene–altered DLBCLs frequently downregulate HLA expression
Display of peptide antigens on HLA class I and II molecules is required for recognition by CD8+ and CD4+ T cells, respectively, and loss of HLA expression is a well-described immune escape mechanism across human cancers.28-30 We hypothesized that HLA expression would be more commonly downregulated in PD-L1 gene–altered DLBCLs due to the heightened T-cell surveillance within these tumors. To address this hypothesis, HLA class I and II IHC was performed on 74 DLBCL specimens (Figure 2F-H). Overall, HLA class I expression on lymphoma cells was absent or unequivocally reduced compared with surrounding nonmalignant cells more frequently in PD-L1–altered compared with unaltered DLBCLs (42% vs 20%; P < .05; Figure 2G). There was also a trend toward more common HLA class II loss or downregulation in DLBCLs with PD-L1 alterations (55% vs 27%; P = .063; Figure 2H). When combined, absence or reduction of HLA class I and/or II expression was nearly twofold more common in DLBCLs with PD-L1 alterations (68% vs 39%; P < .05; supplemental Figure 4). Together, the findings of increased T-cell infiltration and more frequent HLA downregulation strongly point toward the presence of enhanced immune surveillance in PD-L1 gene–altered DLBCLs.
Upregulation of genes involved in negative regulation of T-cell function and NF-κB activation in PD-L1 gene–altered DLBCLs
To investigate the underlying molecular basis for increased immune surveillance in PD-L1 gene–altered DLBCLs, RNA-seq was performed on 24 DLBCL cases (12 PD-L1 gene-altered and 12 PD-L1 unaltered, matched for stage and cell of origin). Overall, 137 differentially expressed genes (DEGs) were identified at a false discovery rate of 0.05 and fold change of ≥1.5 or ≤−1.5 (Figure 3A-B). Seventy-seven genes were significantly upregulated and 60 genes were significantly downregulated in PD-L1 gene–altered vs unaltered DLBCLs (supplemental Table 2). Not surprisingly, PD-L1 was among the most significantly overexpressed genes in the PD-L1 gene–altered cohort (Figure 3A-B), a finding confirmed by quantitative polymerase chain reaction on a larger group of 47 DLBCL specimens (supplemental Figure 5).
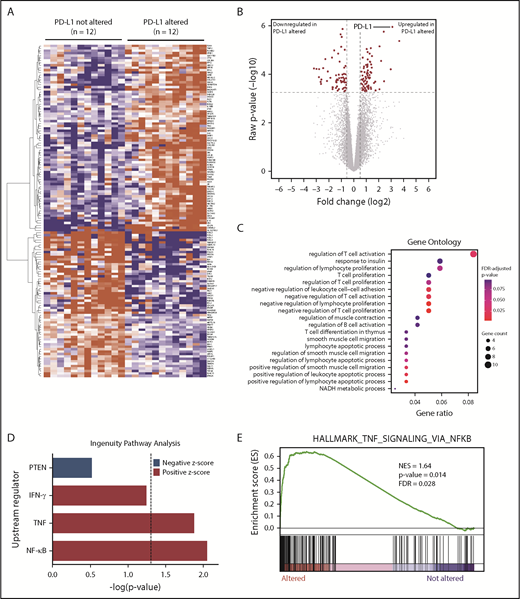
RNA-seq identifies DEGs in PD-L1–altered relative to PD-L1–unaltered DLBCL. Heatmap (A) and volcano plot (B) depicting 137 DEGs in DLBCLs with vs without PD-L1 gene alterations (false discovery rate-adjusted P < .05, fold change ≥1.5 or ≤−1.5). (C) GO analysis performed on the 137 DEGs. GO terms significantly enriched in DLBCLs with PD-L1 gene alterations are denoted by red dots. (D) IPA revealing predicted upstream regulators of gene expression that are activated (positive z score) and inhibited (negative z score) in DLBCLs with PD-L1 alterations relative to those without. Dashed vertical line indicates the position of P = .05 on the x-axis. (E) GSEA demonstrating enrichment of NF-κB–regulated genes in PD-L1–altered compared with PD-L1–unaltered DLBCLs. IFN-γ, interferon-γ; NES, normalized enrichment score; PTEN, phosphatase and tensin homolog.
RNA-seq identifies DEGs in PD-L1–altered relative to PD-L1–unaltered DLBCL. Heatmap (A) and volcano plot (B) depicting 137 DEGs in DLBCLs with vs without PD-L1 gene alterations (false discovery rate-adjusted P < .05, fold change ≥1.5 or ≤−1.5). (C) GO analysis performed on the 137 DEGs. GO terms significantly enriched in DLBCLs with PD-L1 gene alterations are denoted by red dots. (D) IPA revealing predicted upstream regulators of gene expression that are activated (positive z score) and inhibited (negative z score) in DLBCLs with PD-L1 alterations relative to those without. Dashed vertical line indicates the position of P = .05 on the x-axis. (E) GSEA demonstrating enrichment of NF-κB–regulated genes in PD-L1–altered compared with PD-L1–unaltered DLBCLs. IFN-γ, interferon-γ; NES, normalized enrichment score; PTEN, phosphatase and tensin homolog.
Gene ontology (GO) and Ingenuity Pathway Analysis (IPA) were employed to identify biological and molecular processes affected in PD-L1 gene–altered relative to PD-L1–unaltered DLBCLs. JAK/STAT signaling was among the most strongly activated pathways in PD-L1–altered DLBCLs, which is noteworthy, as PD-L1 is a known target of JAK/STAT signaling.31 Moreover, JAK2 is also located on chromosome 9p24.1 and is frequently coamplified with PD-L1 in other lymphomas, such as cHL and PMBL.31 Interestingly, we also found that GO terms related to negative regulation of T-cell activation and proliferation were enriched in DLBCLs with PD-L1 structural variations (Figure 3C). Additionally, IPA of activated upstream regulators of gene expression identified a number of inflammatory and effector cytokine pathways enriched in PD-L1 gene–altered DLBCLs, including NF-κB (P < .01), tumor necrosis factor (TNF) (P = .01), and interferon-γ (P = .058) (Figure 3D). Together, these findings suggest that PD-L1 gene-–altered DLBCLs exhibit an immune-inflamed phenotype, which in turn leads to the compensatory upregulation of pathways that negatively regulate T-cell function, namely PD-L1.
The observation that PD-L1 gene–altered DLBCLs exhibit enhanced NF-κB signaling was particularly intriguing, as NF-κB activation can simultaneously promote tumor growth and stimulate infiltration by immune cells through the release of inflammatory mediators.32,33 Indeed, increased NF-κB activation is a prominent feature of DLBCLs exhibiting a previously defined host response gene signature, characterized by increased expression of immune-related transcripts.34,35 Concordant with IPA, gene set enrichment analysis (GSEA) confirmed coordinate, pathway-level upregulation of NF-κB–associated genes in PD-L1 gene–altered DLBCLs (Figure 3E). This finding was not due to cell-of-origin differences between the 2 cohorts, as the majority of cases were non-GCB, and all control cases were matched for cell of origin. Together, these findings suggest that enhanced NF-κB activation is critical to promoting immune surveillance against DLBCL and may in part explain the high incidence of PD-L1 alterations in non-GCB DLBCLs (Figure 1E), which are often characterized by constitutive NF-κB activation.36
WES identifies recurrent somatic mutations in immune-related genes in PD-L1 gene–altered DLBCLs
To compare the genomic landscapes of PD-L1–altered vs PD-L1–unaltered DLBCLs, WES was performed on 11 PD-L1 gene–altered and 10 PD-L1–unaltered controls. Of the 21 samples, 19 had paired germline DNA. As the majority of PD-L1 gene–altered cases were of a non-GCB cell-of-origin, WES was performed strictly on non-GCB cases to avoid detecting mutational differences resulting from known genomic disparities between GCB and non-GCB DLBCLs.16-18
Somatic mutations in several genes were detected more frequently in PD-L1 gene–altered lymphomas (Figure 4A). For example, TNFAIP3, which encodes for A20, a negative regulator of NF-κB, was commonly and exclusively mutated in PD-L1–altered DLBCLs (6 of 11 cases vs 0 of 10; P = .01). TNFAIP3 mutations were predicted loss-of-function nonsense or frameshift mutations, in agreement with IPA and GSEA results demonstrating enhanced NF-κB activation in PD-L1 gene–altered DLBCLs (Figure 3D-E). Interestingly, PD-L1 gene–altered DLBCLs also exhibited frequent somatic mutations in TP53 (6 of 11 vs 2 of 10 in the PD-L1–unaltered group; P = .10) (Figure 4A), many of which were missense mutations in the p53 DNA-binding domain.
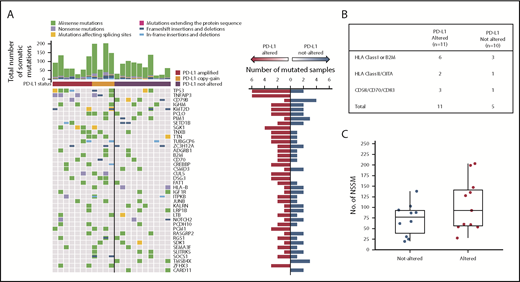
WES reveals PD-L1–altered DLBCLs are enriched for mutations in immune-related genes. (A) Profiles of recurrent nonsynonymous somatic mutations in DLBCLs with and without PD-L1 alterations. Each column represents a separate DLBCL case. Above each column is the mutational burden of each case as assessed by the total number of nonsynonymous somatic mutations. (B) Nonsynonymous somatic mutations (NSSMs) in genes involved in antigen presentation and T-cell costimulation in DLBCLs with vs without PD-L1 gene alterations (P = .02, Mann-Whitney U test). (C) Total mutational burden in DLBCLs with and without PD-L1 alterations (P = .34, Wilcoxon rank sum test with continuity correction).
WES reveals PD-L1–altered DLBCLs are enriched for mutations in immune-related genes. (A) Profiles of recurrent nonsynonymous somatic mutations in DLBCLs with and without PD-L1 alterations. Each column represents a separate DLBCL case. Above each column is the mutational burden of each case as assessed by the total number of nonsynonymous somatic mutations. (B) Nonsynonymous somatic mutations (NSSMs) in genes involved in antigen presentation and T-cell costimulation in DLBCLs with vs without PD-L1 gene alterations (P = .02, Mann-Whitney U test). (C) Total mutational burden in DLBCLs with and without PD-L1 alterations (P = .34, Wilcoxon rank sum test with continuity correction).
PD-L1 gene–altered DLBCLs also harbored frequent somatic mutations in genes critical for maintaining immune surveillance, including recurrent mutations in B2M, CIITA, and HLA genes (Figure 4B), consistent with the decreased HLA expression observed by IHC (Figure 2G-H; supplemental Figures 2 and 4). PD-L1 gene–altered DLBCLs also more commonly harbored mutations in genes involved in T-cell costimulation, such as CD70 and CD83 (Figure 4B). Interestingly, total mutational burden was similar in PD-L1 gene–altered and non-altered DLBCLs (Figure 4C), as were numbers of predicted HLA-A–binding neoantigen peptides (supplemental Figure 6), suggesting that neoantigen load in DLBCL is not a principal driver of host immune responses, as has been reported in several solid malignancies.28 Together, these results demonstrate that PD-L1 gene–altered DLBCLs frequently acquire somatic mutations in genes critical for immune surveillance and that genetic perturbations of NF-κB and p53 pathways may create an environment more conducive to the generation of endogenous antilymphoma immunity.
External validation of primary cohort
We next sought to validate our genomic findings in a large external data set given the relatively small size of our primary cohort. This clinically well-annotated data set included 476 DLBCL specimens and provided detailed molecular profiling, including WES, RNA-seq, and array-based DNA copy-number analysis.17 Overall, 5% of cases within this series exhibited PD-L1 amplifications, which suggests that array-based DNA copy-number analyses are a less sensitive metric than FISH for identifying PD-L1 CNAs. Nevertheless, a number of findings from our primary DLBCL cohort were replicated in this larger genomic data set. For example, we confirmed the association between PD-L1 amplifications and high-risk clinical features, such as increased serum LDH levels, non-GCB phenotype, and higher-risk IPI scores (supplemental Table 3). This corresponded to an increased risk of early relapse and inferior overall survival at 1 year following front-line anthracycline-based chemotherapy (supplemental Figure 7). Gene expression analyses also confirmed increased CD8Α expression within PD-L1–amplified DLBCLs, in agreement with our IHC findings (supplemental Figure 8), as well as the association between PD-L1 amplifications and higher expression of TNF, interferon-γ, and NF-κB targets, even when compared strictly to non-GCB DLBCL cases (supplemental Figure 9). Total mutational burdens were equivalent in DLBCLs with or without PD-L1 amplifications, similar to what was observed in our primary cohort (supplemental Figure 10). We were unable to validate our finding of increased TP53 and TNFAIP3 mutations in PD-L1 gene–amplified DLBCLs, which may have resulted from the lower sensitivity for detecting PD-L1 alterations in this cohort. Nevertheless, it is interesting that TNFAIP3 was mutated and/or deleted more frequently (48% of cases) than any other gene within the PD-L1–amplified group, suggesting an important role for lymphoma cell-intrinsic NF-κB activation in the generation of endogenous antitumor immunity in DLBCL.
PD-L1 gene alterations are associated with response to PD-1 blockade in relapsed/refractory DLBCL
Finally, in order to determine the degree to which PD-L1 alterations were associated with response to anti-PD-1 therapy in DLBCL, PD-L1 FISH was performed on archived samples from relapsed/refractory DLBCL patients treated with the anti-PD-1 antibody pembrolizumab in the phase 1b KEYNOTE-013 study (NCT01953692). Of the patients enrolled, 29 had archived tissue. Overall, PD-L1 alterations were identified in 3 (10.3%) patients (Figure 5A). Two patients had relative PD-L1 copy gains, and 1 patient was polysomic for chromosome 9. The remaining 26 samples were PD-L1 disomic. The overall response rate to pembrolizumab in this cohort was 13.8% (4 of 29). Interestingly, 2 of 3 patients with PD-L1 gene–altered DLBCLs achieved a clinical response to pembrolizumab. In contrast, only 2 of 26 patients with PD-L1–unaltered DLBCLs responded. Thus, the presence of PD-L1 alterations significantly enriched for response to pembrolizumab (P = .005). Positive PD-L1 protein expression (PD-L1 H score ≥30) also enriched for response (2 of 5 patients), although this did not reach statistical significance (P = .062). Additional response characteristics are outlined in Figure 5B.
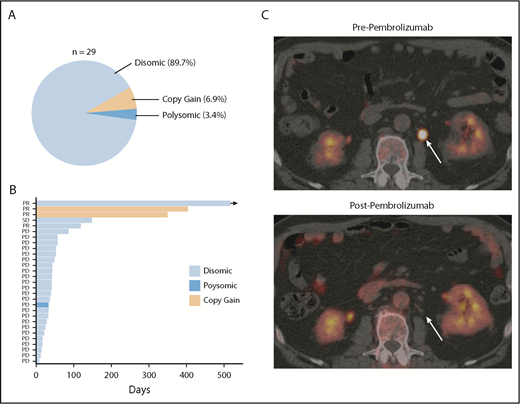
PD-L1 gene alterations are associated with objective response following pembrolizumab treatment in relapsed/refractory DLBCL patients. (A) Incidence and mechanism of PD-L1 gene alterations among 29 DLBCL patients enrolled on the KEYNOTE-013 study of pembrolizumab. (B) Swimmer’s plot demonstrating response characteristics and PFS to pembrolizumab according to PD-L1 locus status. Arrow depicts ongoing response. (C) Positron emission tomography (PET) scan images before and after pembrolizumab treatment in a patient with a PD-L1 gene–amplified DLBCL prior to and following 4 cycles of pembrolizumab treatment. PD, progressive disease; PR, partial response; SD, stable disease.
PD-L1 gene alterations are associated with objective response following pembrolizumab treatment in relapsed/refractory DLBCL patients. (A) Incidence and mechanism of PD-L1 gene alterations among 29 DLBCL patients enrolled on the KEYNOTE-013 study of pembrolizumab. (B) Swimmer’s plot demonstrating response characteristics and PFS to pembrolizumab according to PD-L1 locus status. Arrow depicts ongoing response. (C) Positron emission tomography (PET) scan images before and after pembrolizumab treatment in a patient with a PD-L1 gene–amplified DLBCL prior to and following 4 cycles of pembrolizumab treatment. PD, progressive disease; PR, partial response; SD, stable disease.
Based on this observation, we treated a patient with PD-L1 gene–amplified, relapsed/refractory DLBCL with pembrolizumab monotherapy. This patient had relapsed following 5 prior lines of therapy (R-EPOCH, R-ICE, ibrutinib, lenalidomide, and R-Gem/Ox). The lymphoma harbored high-risk features, including a TP53 mutation, non-GCB phenotype, and dual MYC/BCL2 expression. Remarkably, this patient achieved a complete metabolic response to pembrolizumab and remains in complete response on continued pembrolizumab treatment 10 months after starting therapy (Figure 5C; supplemental Figure 11). Collectively, these data strongly support the notion that PD-L1 gene alterations are a promising predictive biomarker of response to anti-PD-1 therapy in relapsed/refractory DLBCL.
Discussion
Utilizing a straightforward FISH-based approach, we demonstrate that PD-L1 alterations are a recurring genetic phenomenon in DLBCL, with an incidence of ∼25%, consistent with a recent report.24 Through a comprehensive analysis, we have for the first time characterized the immunogenomic landscape of DLBCLs harboring PD-L1 alterations. Collectively, our results indicate that PD-L1 gene–altered DLBCLs are associated with potent endogenous antilymphoma T-cell responses, reminiscent of the “T-cell–inflamed” phenotype described in solid tumors,21 and that these lymphomas commonly acquire additional genetic alterations to facilitate evasion from immune recognition and elimination (Figure 6A). Importantly, from a clinical perspective, we also find in an exploratory retrospective analysis that the presence of PD-L1 gene alterations is associated with responsiveness to PD-1 blockade in relapsed/refractory DLBCL.
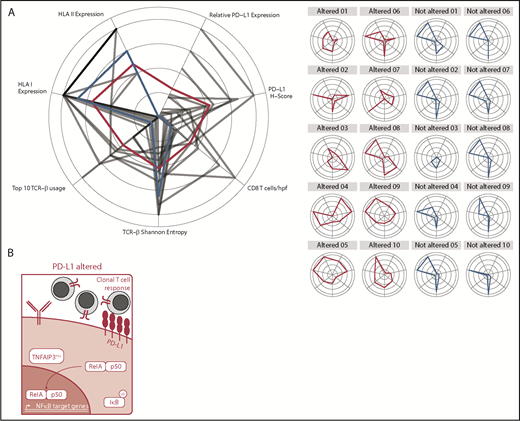
Graphical and schematic summaries of immune landscapes in DLBCLs with and without PD-L1 gene alterations. (A) Summary radar plot (left), with 20% radial intervals depicting 7 parameters that characterize the immunogenomic landscape of PD-L1 gene–altered vs unaltered subsets. Indices were normalized from 0 to 1; bold connecting lines represent average scores for PD-L1–altered (red) vs PD-L1–unaltered (blue) subsets. Curves for individual patients are represented as gray lines (left) or in individual radar plots (right), colored by PD-L1–altered (red) or PD-L1–unaltered (blue) status. (B) Schematic representation of the immunogenomic landscapes of PD-L1 altered DLBCLs. PD-L1 gene–altered DLBCLs are characterized by frequent loss-of-function mutations in TNFAIP3 (A20) and increased NF-κB pathway activation. As a result, these lymphomas demonstrate evidence of enhanced immune surveillance, including robust infiltration by clonally restricted T cells. In addition to marked upregulation of PD-L1 protein on the lymphoma cell surface, PD-L1 gene–altered DLBCLs also commonly downregulate HLA I and II expression and harbor loss-of-function mutations in other genes critical for maintaining tumor immune surveillance.
Graphical and schematic summaries of immune landscapes in DLBCLs with and without PD-L1 gene alterations. (A) Summary radar plot (left), with 20% radial intervals depicting 7 parameters that characterize the immunogenomic landscape of PD-L1 gene–altered vs unaltered subsets. Indices were normalized from 0 to 1; bold connecting lines represent average scores for PD-L1–altered (red) vs PD-L1–unaltered (blue) subsets. Curves for individual patients are represented as gray lines (left) or in individual radar plots (right), colored by PD-L1–altered (red) or PD-L1–unaltered (blue) status. (B) Schematic representation of the immunogenomic landscapes of PD-L1 altered DLBCLs. PD-L1 gene–altered DLBCLs are characterized by frequent loss-of-function mutations in TNFAIP3 (A20) and increased NF-κB pathway activation. As a result, these lymphomas demonstrate evidence of enhanced immune surveillance, including robust infiltration by clonally restricted T cells. In addition to marked upregulation of PD-L1 protein on the lymphoma cell surface, PD-L1 gene–altered DLBCLs also commonly downregulate HLA I and II expression and harbor loss-of-function mutations in other genes critical for maintaining tumor immune surveillance.
The identification of PD-L1 gene alterations as a potential biomarker of response to PD-1 blockade is particularly germane to the development of immunotherapy in DLBCL. The low response rates to anti-PD-1 monotherapy in unselected DLBCL patients will represent a considerable obstacle to the approval of these agents for routine clinical use. A major distinguishing feature of PD-1 blockade from most other antilymphoma therapies in the relapsed/refractory setting is the potential to provide durable clinical benefit. For example, the median duration of response to ibrutinib and lenalidomide in relapsed DLBCL is only 4.8 and 4.6 months, respectively.37,38 In comparison, PD-1 blockade has produced durable responses in DLBCL and other aggressive B-cell non-Hodgkin lymphomas.8-12 Therefore, we believe that continued development of anti-PD-1 therapy in DLBCL is critical; however, the next logical step will be to identify predictive biomarkers that effectively enrich for clinical benefit. Our results indicate that PD-L1 alterations represent a promising option, but prospective validation is needed.
The poor outcomes of PD-L1 gene–altered DLBCL patients following initial therapy is also intriguing and in keeping with a previous analysis, which found that DLBCLs with high PD-L1 protein expression were associated with inferior overall survival.39 Whether the effect of high-level PD-L1 expression on lymphoma cells is causal of poor survival remains to be demonstrated, but it seems likely that other high-risk clinical and molecular features enriched in these patients, including high IPI scores and a non-GCB phenotype, are also involved.40,41 Given these observations, it is reasonable to speculate that alternative treatment approaches, for example incorporating PD-1 blockade into initial chemotherapy, might lead to improved results, as has been recently demonstrated in PD-L1–positive non–small cell lung cancer.42
Our results raise new and important questions regarding the immune landscape of DLBCL. For example, what role do lymphoma-intrinsic and environmental factors play in generating a T-cell–inflamed phenotype in DLBCL (as defined by the presence of PD-L1 alterations), and why is it observed in only a relatively small subset of patients? Based upon our findings, we propose a model in which enhanced lymphoma cell–intrinsic NF-κB activation not only drives tumor growth and proliferation but also creates an inflammatory environment more conducive to the recruitment and activation of adaptive antitumor immune responses, similar to what has been reported with NF-κB hyperactivation within the solid tumor microenvironment (Figure 6B).32,43 Indeed, lymphomas in which PD-L1 alterations are enriched, including cHL, PMBL, and primary central nervous system lymphoma, are all characterized by constitutive NF-κB activation, often resulting from deletion or loss-of-function mutations in TNFAIP3.22,24,31,36,44-49 Moreover, a recent genomic analysis of over 300 DLBCL specimens identified 6 unique genomic DLBCL clusters and found that PD-L1–altered DLBCLs were enriched in a cluster defined by recurrent TNFAIP3 mutations and frequent T-cell/histiocyte-rich histologies.18 Collectively, these observations provide important links between increased NF-κB activation, heightened T-cell surveillance, and the presence of PD-L1 alterations.
In conclusion, we demonstrate that PD-L1 gene alterations identify a unique DLBCL subset that harbors a T-cell–inflamed phenotype. These findings have important basic scientific and translational implications. With regard to the former, the association of a genetic biomarker with potent antitumor T-cell surveillance will enable future investigations into key mechanisms regulating immunity to DLBCL. Furthermore, the identification of PD-L1 alterations as a promising predictive biomarker for anti-PD-1 therapy is clinically relevant, will help reinvigorate interest in PD-1 blockade in this disease, and will open new and exciting therapeutic avenues to improve outcomes of newly diagnosed and relapsed/refractory DLBCL patients with immunotherapies.
The online version of this article contains a data supplement.
The publication costs of this article were defrayed in part by page charge payment. Therefore, and solely to indicate this fact, this article is hereby marked “advertisement” in accordance with 18 USC section 1734.
Acknowledgments
The authors recognize the patients who participated in The University of Chicago Hoogland lymphoma biobank and the KEYNOTE-013 study. The authors thank the Hoogland family for philanthropic efforts supporting The University of Chicago lymphoma biobank and research efforts. The authors also acknowledge Lara Kozloff and Jessica Scott for organizing and collecting patient samples. The authors thank Michael Jarsulic for technical assistance on high-performance computing clusters. Lastly, the authors thank MSD for their collaboration and for providing tumor samples and clinical information for DLBCL patients enrolled on the KEYNOTE-013 study (NCT01953692).
This research was supported by an American Society of Hematology Research Training Award for Fellows, a Cancer Research Foundation Young Investigator Award, an Adaptive Biotechnologies Young Investigator Award, and a Hoogland Lymphoma Research Foundation Award (J.G.), as well as by the University of Chicago Comprehensive Center Team Science Award, a V Foundation Translational Research Award, and a Hoogland Family Foundation award (J.K.).
Authorship
Contribution: J.K. designed and supervised the study and wrote the manuscript; J.G. designed the study, wrote the manuscript, performed experiments, and completed data analysis; S.T. designed experiments, wrote the manuscript, performed data analysis, and assisted with figure preparation; S.M.S. established The University of Chicago Hoogland lymphoma biobank, designed the study, and edited the manuscript; G.V. and J.P. conducted and scored all IHC experiments; J.M. performed and scored all FISH experiments; C.F. assisted with the design of FISH probes and managed the Clinical Laboratory Improvement Amendments–certified laboratory in which the FISH experiments were performed; B.W.M. edited the manuscript and assisted with figure preparation; R.O. assisted with data collection and transfer of materials from the KEYNOTE-013 study; and R.B. and M.L. performed the bioinformatics analysis of RNA-seq and WES data on Gardner high-performance computing clusters at Center for Research Informatics, Biological Sciences Division.
Conflict-of-interest disclosure: R.O. is employed by Merck & Co., Inc., Kenilworth, NJ. J.K. has served as a consultant and has received research support from Merck Sharp & Dohme Corp., a subsidiary of Merck & Co., Inc. The remaining authors declare no competing financial interests.
Correspondence: Justin Kline, Department of Medicine, Section of Hematology/Oncology, University of Chicago, KCBD 6128, 900 East 57th St, Chicago, IL 60637; e-mail: jkline@medicine.bsd.uchicago.edu.

This feature is available to Subscribers Only
Sign In or Create an Account Close Modal