

Key Points
Unrestrained bone marrow necroptosis promotes inflammatory cytokine production that impairs HSPC function.

Abstract
Hematopoiesis is a dynamic system that requires balanced cell division, differentiation, and death. The 2 major modes of programmed cell death, apoptosis and necroptosis, share molecular machinery but diverge in outcome with important implications for the microenvironment; apoptotic cells are removed in an immune silent process, whereas necroptotic cells leak cellular contents that incite inflammation. Given the importance of cytokine-directed cues for hematopoietic cell survival and differentiation, the impact on hematopoietic homeostasis of biasing cell death fate to necroptosis is substantial and poorly understood. Here, we present a mouse model with increased bone marrow necroptosis. Deletion of the proapoptotic Bcl-2 family members Bax and Bak inhibits bone marrow apoptosis. Further deletion of the BH3-only member Bid (to generate VavCreBaxBakBid triple-knockout [TKO] mice) leads to unrestrained bone marrow necroptosis driven by increased Rip1 kinase (Ripk1). TKO mice display loss of progenitor cells, leading to increased cytokine production and increased stem cell proliferation and exhaustion and culminating in bone marrow failure. Genetically restoring Ripk1 to wild-type levels restores peripheral red cell counts as well as normal cytokine production. TKO bone marrow is hypercellular with abnormal differentiation, resembling the human disorder myelodysplastic syndrome (MDS), and we demonstrate increased necroptosis in MDS bone marrow. Finally, we show that Bid impacts necroptotic signaling through modulation of caspase-8–mediated Ripk1 degradation. Thus, we demonstrate that dysregulated necroptosis in hematopoiesis promotes bone marrow progenitor cell death that incites inflammation, impairs hematopoietic stem cells, and recapitulates the salient features of the bone marrow failure disorder MDS.
Introduction
Programmed cell death (PCD) is required to maintain homeostasis in dynamic systems such as hematopoiesis. The two main forms of PCD, apoptosis and necroptosis, result in markedly different outcomes with important implications for the cellular microenvironment. Whereas apoptosis is predominantly immune silent, necroptosis promotes inflammation through release of endogenous molecules such as DNA or membrane lipids, known as damage-associated molecular patterns (DAMPS).1
The process of necroptosis has the potential to amplify both cell death and inflammation within the bone marrow. Hematopoietic and stromal cells can respond to necroptosis-released DAMPS to produce cytokines such as tumor necrosis factor α (TNF-α) that also act as death receptor ligands. In the bone marrow microenvironment, cytokines such as TNF-α provide cues to maintain homeostasis.2-4 In addition, TNF-α as well as interferon can impair hematopoietic stem cell colony formation and the ability to sustain multilineage differentiation.5 The impact of necroptotic cell death on hematopoietic homeostasis is therefore potentially substantial and not well understood.
Seminal results from genetic mouse models demonstrate that the upstream activators of apoptosis, Fas-associated protein with death domain (FADD) and caspase-8, act as key inhibitors of necroptotic cell death during embryonic development.6-12 Situated at this central decision point of cell death fate, the Bcl-2 (B-cell lymphoma) family functions downstream of death receptor signaling before activation of executioner caspases. In particular, the BH3-only family member Bid acts as a sensor and amplifier of death receptor signaling. Upon activation of death receptors (TNF receptor [TNFR] and Fas), Bid is cleaved by caspase-813 and activates Bax/Bak to initiate the release of cytochrome c and the execution of apoptosis.14 The interaction of Bid with caspase-8 and Bid’s role in early activation of apoptosis are therefore well established. Bid has been shown to function in a prosurvival role, independent of apoptosis, in certain contexts,15,16 raising the possibility that Bid’s prosurvival function may extend to necroptosis.
We have developed a series of mouse models in which we alter the mechanism of cell death in hematopoiesis. Bone marrow in wild-type (WT) mice undergoes predominantly apoptotic cell death. As necroptosis is known to occur in situations where apoptosis is inhibited,17 we constructed a mouse in which intrinsic apoptosis is blocked in hematopoiesis: germline deletion of Bak and conditional deletion of Bax within the hematopoietic system with VavCre (DKO mice) completely blocks apoptotic cell death but is not sufficient to initiate necroptotic cell death. Further deletion of Bid (to create BaxBakBid triple-knockout [TKO] mice) leads to robust activation of necroptosis. While protection from programmed cell death leads to leukemia (double-knockout [DKO] mice), increased necroptotic cell death (TKO) leads to decreased survival due to bone marrow failure (BMF). Importantly, restoring WT levels of Ripk1 through genetic knockdown of 1 allele of Ripk1 fully restores peripheral blood counts and substantially increases progenitor cell percentages and proliferation as measured by 5-bromo-2′-deoxyuridine (BrdU) incorporation, establishing that TKO BMF is driven by Ripk1.
As a consequence of necroptosis, TKO mice display increased bone marrow cytokine production. This cytokine production is significantly diminished by genetically restoring normal levels of Ripk1 in TKO mice. Furthermore, blocking TNF-α in TKO mice with the decoy TNFR etanercept (Enbrel) partially restores TKO progenitor cells, anemia, and thrombocytopenia. Lastly, in samples from patients with the BMF disorder myelodysplastic syndrome (MDS), we observe prominent Ripk1 and phospho-mixed lineage kinase domain-like pseudokinase (pMLKL) immunofluorescence staining and necroptotic morphology by electron microscopy. Thus, we propose that uncontrolled necroptosis-mediated cell death leads to BMF that is in part due to inflammation and resembles MDS.
Methods
Additional details are included in supplemental Methods (available on the Blood Web site).
Mice
VavCreBaxBak mice were developed by crossing BaxF/FBak−/− mice with VavCre+ mice. VavCreBaxF/FBak−/− mice were further crossed to Bid−/− mice to generate VavCre BaxF/FBak−/−Bid−/− mice (TKO). VavCreBaxBakBid mice were also crossed with Ripk1K45A mice, which harbor loxP sites flanking exon 3 of Ripk1 (from Peter Gough).18 Mice were backcrossed 9 generations with C57BL/6J mice from The Jackson Laboratory.
Flow cytometry
Cells from peripheral blood and bone marrow were stained and analyzed on a BD LSR Fortessa according to previously described protocols.16
Immunoblotting and immunofluorescence
Formalin-fixed paraffin-embedded samples were stained and imaged on a Nikon AZ100 microscope, and images were captured using a Nikon DS-Ri1 color camera or a Zeiss Axioplan microscope using a Hamamatsu ORCA-ER monochrome digital camera. Details of the staining protocols and antibodies used can be found in supplemental Methods.
Competitive reconstitution
Lethally irradiated (900-cGy split dose) B6 CD45.1 mice were transplanted with a 1 × 10⁶ bone marrow cells with a 1:1 ratio of test (CD45.2) to control (CD45.1) cells according to previously described protocols.16 The Vanderbilt University Institutional Animal Care and Use Committee approved all experiments (M16000037).
Methylcellulose culture
Whole bone marrow from competitive reconstitution studies was isolated 3 months after reconstitution. Cells were stained with anti-CD45.1 and CD45.2 antibodies and sorted on a BD FACSAria III instrument. Cells were plated according to previously described protocols.16 Colonies were counted 10 days after plating.
Results
VavCreBaxBakBid TKO mice die of BMF
To create a mouse model with increased bone marrow necroptosis, we first blocked intrinsic apoptotic execution in hematopoiesis by creating VavCreBaxF/FBak−/− DKO mice (Figure 1A).19 We then crossed DKO mice with mice harboring germline deletion of Bid,20 resulting in VavCreBaxF/FBakBid TKO mice. VavCre efficiently deletes Bax in the bone marrow and spleen of DKO and TKO mice (Figure 1B-C; supplemental Figure 1A).
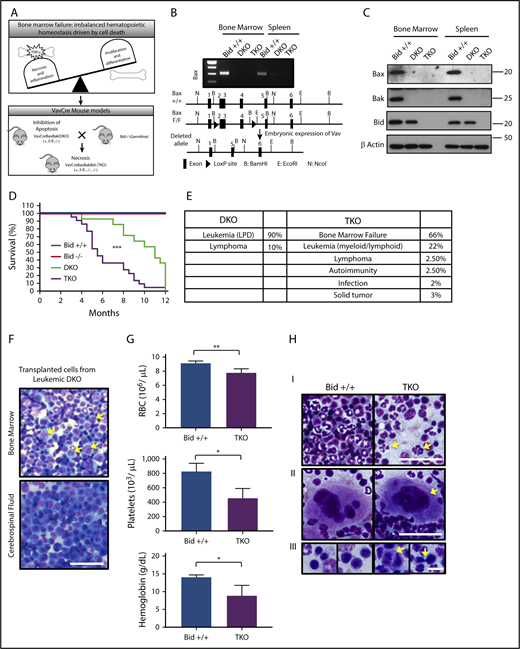
VavCreBaxBakBid TKO mice die of BMF. (A) Schematic of hematopoietic homeostasis and BMF and development of VavCre transgenic mouse models to study the role of cell death. (B) Deletion of Bax in bone marrow and spleen determined by reverse-transcription polymerase chain reaction (top), and diagram of highlighting Cre-Lox recombination with loxP sites flanking exons 2 to 4 of the Bax gene (bottom). (C) Immunoblot examining the expression of Bax, Bak, and Bid in WT (Bid+/+), VavCreBaxBak (DKO), and VavCreBaxBakBid (TKO) mice. (D) Survival curves of Bid+/+, Bid−/−, DKO, and TKO mice. Statistics demonstrate differences between DKO and TKO animals. Bid+/+ n = 4, Bid−/− n = 4, DKO n = 14, TKO n = 22. (E) Cause of death in DKO and TKO mice determined at time of necropsy. (F) Bone marrow and cerebrospinal fluid from Bid+/+ mice transplanted with leukemic DKO bone marrow after sublethal irradiation. Arrows indicate leukemic blasts. Scale bar, 50 μm. (G) Complete blood counts, including RBCs (top; 106/µL), platelet counts (middle; 106/µL), and hemoglobin (bottom; g/dL); n = 3 and 4 Bid+/+ and TKO mice, respectively. (H) Cytospins from bone marrow Bid+/+ and TKO mouse bone marrow mice denoting neutrophils (I), megakaryocytes (II), and erythroid precursors (III). Arrows indicate hypersegmentation (I), hypolobulation (II), and binucleation and intrachromosomal bridging (III). Scale bars, 10 μm. *P < .05, ***P < .001. Data represent mean ± standard error of the mean (SEM). LDP, lymphoproliferative disorder.
VavCreBaxBakBid TKO mice die of BMF. (A) Schematic of hematopoietic homeostasis and BMF and development of VavCre transgenic mouse models to study the role of cell death. (B) Deletion of Bax in bone marrow and spleen determined by reverse-transcription polymerase chain reaction (top), and diagram of highlighting Cre-Lox recombination with loxP sites flanking exons 2 to 4 of the Bax gene (bottom). (C) Immunoblot examining the expression of Bax, Bak, and Bid in WT (Bid+/+), VavCreBaxBak (DKO), and VavCreBaxBakBid (TKO) mice. (D) Survival curves of Bid+/+, Bid−/−, DKO, and TKO mice. Statistics demonstrate differences between DKO and TKO animals. Bid+/+ n = 4, Bid−/− n = 4, DKO n = 14, TKO n = 22. (E) Cause of death in DKO and TKO mice determined at time of necropsy. (F) Bone marrow and cerebrospinal fluid from Bid+/+ mice transplanted with leukemic DKO bone marrow after sublethal irradiation. Arrows indicate leukemic blasts. Scale bar, 50 μm. (G) Complete blood counts, including RBCs (top; 106/µL), platelet counts (middle; 106/µL), and hemoglobin (bottom; g/dL); n = 3 and 4 Bid+/+ and TKO mice, respectively. (H) Cytospins from bone marrow Bid+/+ and TKO mouse bone marrow mice denoting neutrophils (I), megakaryocytes (II), and erythroid precursors (III). Arrows indicate hypersegmentation (I), hypolobulation (II), and binucleation and intrachromosomal bridging (III). Scale bars, 10 μm. *P < .05, ***P < .001. Data represent mean ± standard error of the mean (SEM). LDP, lymphoproliferative disorder.
DKO mice die predominantly of leukemia (89%) that can be transferred to recipient mice, with a median survival of 10 months, consistent with loss of mitochondrial-mediated death (Figure 1D-F).21 In contrast, TKO mice develop significant cytopenias (Figure 1G); 66% die of BMF, and 22% die of leukemia (Figure 1D-E), with a median survival of 5.5 months. Morphologically, TKO marrow harbors dysplastic myeloid cells, including neutrophil hypersegmentation, megakaryocyte hypolobulation, and erythroid precursor binucleation and intrachromosomal bridging (Figure 1H).22 Thus, hematopoietic loss of Bax and Bak prevents apoptosis and promotes leukemia. Further loss of Bid results in BMF.
TKO bone marrow displays necrotic morphology and increased Rip1 kinase
We examined cellular morphology, a defining feature of both apoptosis (eg, pyknotic nuclei, cell membrane and organelle shrinkage) and necroptosis (eg, membrane integrity loss, cell membrane and organelle swelling) by transmission electron microscopy (TEM). TKO bone marrow cells displayed significantly increased necrotic morphology compared with Bid+/+ bone marrow cells (25% vs 7% [of 100 cells], respectively) (Figure 2A-B). Furthermore, cells undergoing necrotic death have recently been reported to display bubbles at the membrane by TEM as a consequence of phospho-MLKL (pMLKL) activation and translocation.23 We observe an increase in the number of these bubbles in TKO bone marrow compared with Bid+/+ marrow (Figure 2C-D), consistent with activated pMLKL.
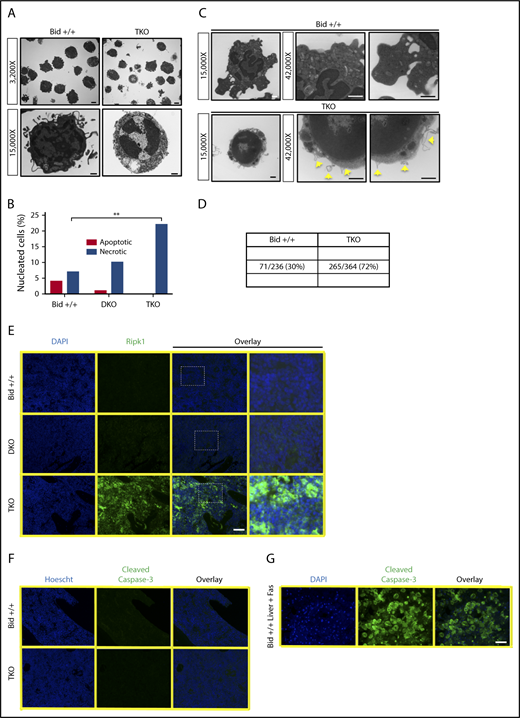
TKO bone marrow dies by necrosis. (A) Representative TEM images from Bid+/+ and TKO mice (top: original magnification ×3200; scale bar, 2 μm; bottom: original magnification ×15 000; scale bar, 500 nm). (B) Quantitation of apoptotic and necrotic cells from Bid+/+, DKO, and TKO TEM. A total of 100 cells with a nucleus from lower-magnification images were scored based on cell and organelle morphology (see supplemental Methods for quantitation details). (C) TEM images of bone marrow from Bid+/+ and TKO mice analyzed for membrane bubble. Images of the whole cell are original magnification ×15 000, and zoomed images of the cell membrane are original magnification ×42 000 (scale bars, 500 nm). (D) Quantitation of the number of bubbles show in panel C. (E) Ripk1 fluorescent immunohistochemistry as a marker for necrotic cell death on paraffin-embedded bone marrow sections from Bid+/+, DKO, and TKO mice. Staining was performed 3 independent times (scale bar, 50 μm). Zoomed-in images (250%) are of the indicated boxed area. (F) Fluorescent immunohistochemistry for cleaved caspase-3 as a marker of apoptotic cell death on Bid+/+ and TKO bone marrow sections as in panel C. (G) Fluorescent immunohistochemistry for Bid+/+ liver after tail vein injection with Fas ligand as a positive control for cleaved caspase-3 staining. **P < .01. Data represent mean ± SEM. DAPI, 4′,6-diamidino-2-phenylindole.
TKO bone marrow dies by necrosis. (A) Representative TEM images from Bid+/+ and TKO mice (top: original magnification ×3200; scale bar, 2 μm; bottom: original magnification ×15 000; scale bar, 500 nm). (B) Quantitation of apoptotic and necrotic cells from Bid+/+, DKO, and TKO TEM. A total of 100 cells with a nucleus from lower-magnification images were scored based on cell and organelle morphology (see supplemental Methods for quantitation details). (C) TEM images of bone marrow from Bid+/+ and TKO mice analyzed for membrane bubble. Images of the whole cell are original magnification ×15 000, and zoomed images of the cell membrane are original magnification ×42 000 (scale bars, 500 nm). (D) Quantitation of the number of bubbles show in panel C. (E) Ripk1 fluorescent immunohistochemistry as a marker for necrotic cell death on paraffin-embedded bone marrow sections from Bid+/+, DKO, and TKO mice. Staining was performed 3 independent times (scale bar, 50 μm). Zoomed-in images (250%) are of the indicated boxed area. (F) Fluorescent immunohistochemistry for cleaved caspase-3 as a marker of apoptotic cell death on Bid+/+ and TKO bone marrow sections as in panel C. (G) Fluorescent immunohistochemistry for Bid+/+ liver after tail vein injection with Fas ligand as a positive control for cleaved caspase-3 staining. **P < .01. Data represent mean ± SEM. DAPI, 4′,6-diamidino-2-phenylindole.
Consistent with the observed cellular morphology, Ripk1 levels are increased in TKO bone marrow, but not Bid+/+, Bid−/−, or DKO bone marrow (Figure 2E). Minimal cleaved caspase-3 was observed in Bid+/+, TKO (Figure 2F), Bid−/−, and DKO bone marrow (supplemental Figure 2A). A strong cleaved caspase-3 signal was observed in Bid+/+ Fas-treated livers, validating our antibody and staining technique (Figure 2G). Ripk1 staining of WT cells, but not Ripk1−/− 3T3 cells, validated specificity of Ripk1 staining (supplemental Figure 2B-C). Only in the context of transformation from BMF to leukemia do we observe decreased Ripk1 (supplemental Figure 2D). Overall, these results are consistent with abrogation of apoptosis in DKO bone marrow and increased necroptosis upon additional loss of Bid in TKO bone marrow under homeostatic conditions.
TKO myeloid progenitors die by necrosis
We next generated Hox11 immortalized myeloid progenitor cells (MPCs) from the bone marrow of Bid+/+, DKO, and TKO mice.15 We treated these MPCs with TNF-α plus actinomycin D (ActD) to activate TNFR cell death signaling. As expected, Bid−/− and DKO cells exhibited less death (by Annexin V+/propidium iodide+) in response to TNF-α/ActD.24 TKO and Bid+/+ cells display similar death kinetics (Figure 3A); however, Bid+/+, but not TKO MPCs, displayed increased cleaved caspase-3 (supplemental Figure 3A). TEM of untreated MPCs reveals minimal cell death (supplemental Figure 3B). TEM of TNF-α/ActD-treated MPCs reveals predominantly apoptotic morphology in Bid+/+ cells and predominantly necrotic cell morphology in TKO cells (Figure 3B). Canonical death receptor signaling is thus preserved in our MPCs. Bid+/+ MPCs undergo apoptosis in response to TNF-α/ActD, and removal of Bax and Bak prevents cell death. Importantly, removal of Bid in addition to Bax and Bak results in necroptotic cell death, consistent with a novel role for Bid to restrain necroptosis.
![Figure 3. Bid modulates Ripk1 signaling in MPCs in a caspase-8–dependent manner. (A) Examination of death in MPCs. MPCs were treated with 25 ng/mL TNF-α + 50 ng/mL ActD. Viability was determined by Annexin V/propidium iodide staining. The experiment was performed three independent times. Statistics indicate differences between Bid+/+ vs Bid−/−, DKO, and TKO. (B) Bid+/+ and TKO MPCs treated with TNF-α/ActD were examined by TEM. A total of 50 cells with a nucleus were examined and characterized as being apoptotic or necrotic. Arrows indicate apoptotic cells, and asterisks indicate necrotic cells (scale bars, 2 μm). Quantitation of cells is to the right of images. (C) MPCs unstimulated or stimulated with 250 ng/mL LPS for 10 minutes and 1 hour followed by immunoblot for Ripk1. pRipk1, phospho-Ripk1. The experiment was performed 4 times. (D) Immunoblot of Bid+/+ MPCs treated with or without TNF-α in the presence or absence of calf intestinal alkaline phosphatase (CIAP). pRipk1 is lost in the presence of CIAP. (E) Immunoblot of Ripk1 in Bid+/+, DKO, TKO, and TKO+ FLAG-Bid MPCs following LPS stimulation. The experiment was performed 2 independent times. (F) Immunoblot of MLKL trimerization in Bid+/+, DKO, and TKO MPCs following stimulation with LPS. MLKL trimer is ∼150 kDa. The experiment was performed 3 times. (G) Bone marrow from Bid+/+ and TKO mice treated with or without LPS (250 ng/mL) for 4 hours followed by bismaleimidohexane (BMH) crosslinking and probed for MLKL. Control lane indicates Bid+/+ bone marrow pretreated with zVAD (25 μM) followed by Smac mimetic (Birinapant [100 nM]) and TNF-α (25 ng/mL) for 4 hours as a positive control. The experiment was performed 2 independent times. NT, not treated. (H) Immunoblot of Ripk1 in Bid+/+, DKO, and TKO MPCs following stimulation with 250 ng/mL LPS and pretreatment with 20 μM Z-IETD-FMK (an inhibitor of caspase-8). The experiment was performed 3 independent times. (I) Ripk1 levels by immunoblot after knockdown of caspase-8 utilizing the CRISPR-Cas9 system in Bid+/+ MPCs. The experiment was performed 2 times. (J) Immunoblot of bone marrow from Bid+/+, DKO, and TKO mice treated with LPS for the indicated times. The experiment was performed 3 independent times. **P < .01, ***P < .001. Data represent mean ± SEM.](https://ash.silverchair-cdn.com/ash/content_public/journal/blood/133/2/10.1182_blood-2018-05-847335/6/m_blood847335f3.png?Expires=1765894265&Signature=YZpWYor2Lq97J0hobL-wXcUqampVBxOmKQ8FD0m5CzsAJbmG5fVX3eCKzrFcHJTIJphn20cjzvaWXscAXceuZuWx3FcC-V4WdL0bv~KlgiNxBrpxmnKnnb-UsAsyLVKfCrVgPWBmCAisoxHgUc1QEX4srGRpNsVmzpnWW7TD686cNpxjonodA9Y14voCCBJJclsUKaWyLRk8OSaDUg6xPub7yS-SCxlkJF7ROcI6ajMEH584BTkeO5zxuOFoe-EiaKki4xmWuvD~YafI8WNNt9gJjNW6fWfMeltEIQVJKcHB3I5pH-luEBSW9uC5wcFhFPlXcRZCA0fPD-tK4wYlOQ__&Key-Pair-Id=APKAIE5G5CRDK6RD3PGA)
Bid modulates Ripk1 signaling in MPCs in a caspase-8–dependent manner. (A) Examination of death in MPCs. MPCs were treated with 25 ng/mL TNF-α + 50 ng/mL ActD. Viability was determined by Annexin V/propidium iodide staining. The experiment was performed three independent times. Statistics indicate differences between Bid+/+ vs Bid−/−, DKO, and TKO. (B) Bid+/+ and TKO MPCs treated with TNF-α/ActD were examined by TEM. A total of 50 cells with a nucleus were examined and characterized as being apoptotic or necrotic. Arrows indicate apoptotic cells, and asterisks indicate necrotic cells (scale bars, 2 μm). Quantitation of cells is to the right of images. (C) MPCs unstimulated or stimulated with 250 ng/mL LPS for 10 minutes and 1 hour followed by immunoblot for Ripk1. pRipk1, phospho-Ripk1. The experiment was performed 4 times. (D) Immunoblot of Bid+/+ MPCs treated with or without TNF-α in the presence or absence of calf intestinal alkaline phosphatase (CIAP). pRipk1 is lost in the presence of CIAP. (E) Immunoblot of Ripk1 in Bid+/+, DKO, TKO, and TKO+ FLAG-Bid MPCs following LPS stimulation. The experiment was performed 2 independent times. (F) Immunoblot of MLKL trimerization in Bid+/+, DKO, and TKO MPCs following stimulation with LPS. MLKL trimer is ∼150 kDa. The experiment was performed 3 times. (G) Bone marrow from Bid+/+ and TKO mice treated with or without LPS (250 ng/mL) for 4 hours followed by bismaleimidohexane (BMH) crosslinking and probed for MLKL. Control lane indicates Bid+/+ bone marrow pretreated with zVAD (25 μM) followed by Smac mimetic (Birinapant [100 nM]) and TNF-α (25 ng/mL) for 4 hours as a positive control. The experiment was performed 2 independent times. NT, not treated. (H) Immunoblot of Ripk1 in Bid+/+, DKO, and TKO MPCs following stimulation with 250 ng/mL LPS and pretreatment with 20 μM Z-IETD-FMK (an inhibitor of caspase-8). The experiment was performed 3 independent times. (I) Ripk1 levels by immunoblot after knockdown of caspase-8 utilizing the CRISPR-Cas9 system in Bid+/+ MPCs. The experiment was performed 2 times. (J) Immunoblot of bone marrow from Bid+/+, DKO, and TKO mice treated with LPS for the indicated times. The experiment was performed 3 independent times. **P < .01, ***P < .001. Data represent mean ± SEM.
Bid modulates Ripk1 signaling in MPCs in a caspase-8–dependent manner. (A) Examination of death in MPCs. MPCs were treated with 25 ng/mL TNF-α + 50 ng/mL ActD. Viability was determined by Annexin V/propidium iodide staining. The experiment was performed three independent times. Statistics indicate differences between Bid+/+ vs Bid−/−, DKO, and TKO. (B) Bid+/+ and TKO MPCs treated with TNF-α/ActD were examined by TEM. A total of 50 cells with a nucleus were examined and characterized as being apoptotic or necrotic. Arrows indicate apoptotic cells, and asterisks indicate necrotic cells (scale bars, 2 μm). Quantitation of cells is to the right of images. (C) MPCs unstimulated or stimulated with 250 ng/mL LPS for 10 minutes and 1 hour followed by immunoblot for Ripk1. pRipk1, phospho-Ripk1. The experiment was performed 4 times. (D) Immunoblot of Bid+/+ MPCs treated with or without TNF-α in the presence or absence of calf intestinal alkaline phosphatase (CIAP). pRipk1 is lost in the presence of CIAP. (E) Immunoblot of Ripk1 in Bid+/+, DKO, TKO, and TKO+ FLAG-Bid MPCs following LPS stimulation. The experiment was performed 2 independent times. (F) Immunoblot of MLKL trimerization in Bid+/+, DKO, and TKO MPCs following stimulation with LPS. MLKL trimer is ∼150 kDa. The experiment was performed 3 times. (G) Bone marrow from Bid+/+ and TKO mice treated with or without LPS (250 ng/mL) for 4 hours followed by bismaleimidohexane (BMH) crosslinking and probed for MLKL. Control lane indicates Bid+/+ bone marrow pretreated with zVAD (25 μM) followed by Smac mimetic (Birinapant [100 nM]) and TNF-α (25 ng/mL) for 4 hours as a positive control. The experiment was performed 2 independent times. NT, not treated. (H) Immunoblot of Ripk1 in Bid+/+, DKO, and TKO MPCs following stimulation with 250 ng/mL LPS and pretreatment with 20 μM Z-IETD-FMK (an inhibitor of caspase-8). The experiment was performed 3 independent times. (I) Ripk1 levels by immunoblot after knockdown of caspase-8 utilizing the CRISPR-Cas9 system in Bid+/+ MPCs. The experiment was performed 2 times. (J) Immunoblot of bone marrow from Bid+/+, DKO, and TKO mice treated with LPS for the indicated times. The experiment was performed 3 independent times. **P < .01, ***P < .001. Data represent mean ± SEM.
TKO MPCs and bone marrow display increased necroptotic signaling
Phosphorylation of Ripk1 has been shown to stabilize its association with a pronecroptotic complex and activate necroptotic kinase activity.25 TKO MPCs, but not Bid+/+, Bid−/−, or DKO MPCs, displayed constitutive and increased kinetics of Ripk1 phosphorylation manifested by a phosphatase-sensitive shifted band upon treatment with lipopolysaccharide (LPS)26 or TNF-α (Figure 3C-D; supplemental Figure 3C-D). Furthermore, TKO bone marrow exhibits more total Ripk1 and phospho-Ripk1 (supplemental Figure 3D). Importantly, reintroduction of FLAG-tagged Bid into TKO MPCs by retroviral transduction results in decreased Ripk1 levels (Figure 3E), demonstrating that decreased Ripk1 observed in DKO MPCs is due to the presence of Bid.
In addition, TKO MPCs, but not Bid+/+ or DKO MPCs, display increased MLKL trimerization with or without LPS stimulation (Figure 3F; supplemental Figure 3E).27 Importantly, TKO bone marrow with and without LPS stimulation, displays increased MLKL monomers, trimers, and phospho-MLKL relative to Bid+/+ bone marrow (Figure 3G; supplemental Figure 3F). These results suggest that loss of Bid in addition to Bax and Bak is sufficient to stimulate Ripk1 phosphorylation and MLKL trimerization, consistent with increased necroptotic signaling.
Bid regulates Ripk1 stability by modulating caspase-8 activity
The above studies reveal that Ripk1 levels vary markedly between genotypes, with decreased Ripk1 observed in DKO MPCs compared with both Bid+/+ and TKO cells (Figure 3C).
Ripk1 can be cleaved by proteases such as caspase-828 and cathepsins29 to generate truncated Ripk1 (tRipk1). Treatment with the caspase-8–specific inhibitor Z-IETD-FMK, but not MG132 (proteasome inhibitor) or Z-VAD-FMK (pan-caspase inhibitor), following LPS (Figure 3H; supplemental Figure 4A) completely recovered full-length Ripk1 in DKO MPCs and decreased tRipk1 in Bid+/+ and TKO MPCs, indicating that a Z-IETD-FMK–inhibitable enzyme cleaves Ripk1. Similar recovery of a caspase-8 substrate, cylindromatosis, was also observed (supplemental Figure 4B). Furthermore, deletion of caspase-8 using CRISPR-Cas9 with 2 independent guide RNAs increased Ripk1 levels in Bid+/+ MPCs proportional to the degree of caspase-8 knockdown (Figure 3I).
Treatment of Bid+/+, DKO, and TKO bone marrow with LPS also revealed striking differences in caspase-8 levels. Both the p43/45 and p20 forms of active caspase-8 are elevated in DKO bone marrow. Despite this, only minimal cleaved Bid (tBid) can be observed in Bid+/+, but not DKO, marrow (Figure 3J). This suggests that in the absence of Bax and Bak, caspase-8 preferentially cleaves Ripk1 over Bid. The above results are consistent with a role for caspase-8 in mediating Ripk1 levels.
Unrestrained bone marrow necroptosis disrupts hematopoietic homeostasis
To determine whether bone marrow necroptosis may impair hematopoietic homeostasis, we evaluated hematopoietic stem and progenitor cell (HSPC) populations. Immunophenotyping of HSPCs reveals that LSK (Lin−Sca1+c-Kit+) cell populations are expanded in TKO mice, but not Bid+/+, Bid−/−, or DKO mice (Figure 4A). The signaling lymphocyte activating molecule hematopoietic stem cell (SLAM-HSC; LSK Flt3LoCD48−CD150+) population30 continues to expand in TKO mice with age, whereas SLAM-HSC populations decline in aged DKO mice. Accordingly, TKO, but not DKO, SLAM-HSCs displayed increased numbers (Figure 4B; supplemental Figure 5A) as well as proliferation assessed by in vivo BrdU analysis (Figure 4C), consistent with an appropriate response to bone marrow stress. Long-term hematopoietic stem cell (Lin−Sca1+c-Kit+CD135Lo) populations were not significantly changed between genotypes (supplemental Figure 5B).

TKO mice have fewer myeloid progenitor cells and more hematopoietic stem cells (HSCs), which can be rescued with a genetic cross to Ripk1(+/−) heterozygous mice. (A) Flow cytometry analysis of bone marrow to examine LSK and (B) SLAM-HSC populations. Mice were examined before onset of sickness. Younger mice were 11 to 15 weeks old, and older mice were 15 to 20 weeks of age. Bid+/+, n = 5; Bid−/−, n = 5; DKO, n = 6; TKO younger, n = 5; and TKO older, n = 9. (C) Examination of the number of BrdU-positive SLAM-HSCs in bone marrow. Mice were injected with a total of 4 mg BrdU in 3 doses over 36 hours. Bone marrow was harvested, depleted for terminal lineages, and stained for flow cytometry. Mice were 18 to 20 weeks of age. (D) Numbers of myeloid progenitors (Lin−Sca-1−c-Kit+) as in panel A. Mice were 18 to 20 weeks of age. (E) Number of BrdU-positive myeloid progenitors. Numbers of mice for panels C–E are as follows: Bid+/+, n = 8; Bid−/−, n = 7; DKO, n = 8; and TKO, n = 7. (F) Western blot of Ripk1, cleaved Ripk1, and Ripk3 expression in Bid+/+, TKO, and TKORipk1(+/−) mouse bone marrow and spleen. (G) Intracellular flow cytometry analysis of LSK (left) and progenitor cell populations (right). TKO, n = 9; TKORipk1(+/−), n = 6 . (H) Percentage of MPCs from lineage-depleted bone marrow. Bid+/+, n = 12; TKO, n = 14; and TKORipk1(+/−), n = 8. (I) Percentage of BrdU-positive myeloid progenitors from lineage-depleted bone marrow. Bid+/+, n = 13; TKO, n = 15; and TKORipk1(+/−), n = 8. (I) RBCs (106/µL), hemoglobin (g/dL), and hematocrit (%) were measured in peripheral blood. Bid+/+, n = 6; TKO, n = 6; and TKORipk1(+/−), n = 6. ns, not significant; *P < .05, **P < .01, ***P < .001, and ****P < .0001. Data represent mean ± SEM.
TKO mice have fewer myeloid progenitor cells and more hematopoietic stem cells (HSCs), which can be rescued with a genetic cross to Ripk1(+/−) heterozygous mice. (A) Flow cytometry analysis of bone marrow to examine LSK and (B) SLAM-HSC populations. Mice were examined before onset of sickness. Younger mice were 11 to 15 weeks old, and older mice were 15 to 20 weeks of age. Bid+/+, n = 5; Bid−/−, n = 5; DKO, n = 6; TKO younger, n = 5; and TKO older, n = 9. (C) Examination of the number of BrdU-positive SLAM-HSCs in bone marrow. Mice were injected with a total of 4 mg BrdU in 3 doses over 36 hours. Bone marrow was harvested, depleted for terminal lineages, and stained for flow cytometry. Mice were 18 to 20 weeks of age. (D) Numbers of myeloid progenitors (Lin−Sca-1−c-Kit+) as in panel A. Mice were 18 to 20 weeks of age. (E) Number of BrdU-positive myeloid progenitors. Numbers of mice for panels C–E are as follows: Bid+/+, n = 8; Bid−/−, n = 7; DKO, n = 8; and TKO, n = 7. (F) Western blot of Ripk1, cleaved Ripk1, and Ripk3 expression in Bid+/+, TKO, and TKORipk1(+/−) mouse bone marrow and spleen. (G) Intracellular flow cytometry analysis of LSK (left) and progenitor cell populations (right). TKO, n = 9; TKORipk1(+/−), n = 6 . (H) Percentage of MPCs from lineage-depleted bone marrow. Bid+/+, n = 12; TKO, n = 14; and TKORipk1(+/−), n = 8. (I) Percentage of BrdU-positive myeloid progenitors from lineage-depleted bone marrow. Bid+/+, n = 13; TKO, n = 15; and TKORipk1(+/−), n = 8. (I) RBCs (106/µL), hemoglobin (g/dL), and hematocrit (%) were measured in peripheral blood. Bid+/+, n = 6; TKO, n = 6; and TKORipk1(+/−), n = 6. ns, not significant; *P < .05, **P < .01, ***P < .001, and ****P < .0001. Data represent mean ± SEM.
Given the apparent bone marrow stress observed in TKO SLAM-HSCs, we anticipated similar progenitor expansion. In contrast, we observed decreased TKO myeloid progenitor (Lin− Sca1−c-Kit+) populations (Figure 4D) with decreased BrdU incorporation as compared with Bid+/+ mice (Figure 4E), consistent with increased progenitor cell death with compensatory hematopoietic stem cell proliferation. Despite a similarly decreased progenitor cell population, DKO mice do not display increased SLAM-HSC proliferation (Figure 4B-C), suggesting a distinct defect in hematopoietic homeostasis in the setting of impaired apoptosis (DKO) vs increased necroptosis (TKO).
Consistent with the increased programmed cell death noted in myeloid cell lines, TKO mice, but not Bid+/+, Bid−/−, or DKO mice, display splenomegaly with increased Ter119+ cells (erythroid), indicative of extramedullary hematopoiesis that is progressive with age (supplemental Figure 5C-D). Notably, B-cell and monocyte populations are not different between genotypes at necropsy, but DKO and TKO T-cell populations are expanded (supplemental Figure 5E).
Restoring normal Ripk1 levels rescues TKO red blood cells (RBCs) and bone marrow progenitors
To definitively establish whether the altered hematopoiesis observed in TKO mice was due to unrestrained necroptosis, we crossed VavCreTKO mice to mice in which exon 3 within the endogenous Ripk1 gene locus is flanked by 2 loxP sites18 to generate mice in which 1 allele of Ripk1 was knocked out in hematopoietic tissues (TKORipk1(+/−)) (supplemental Figure 6A-B). Deletion of 1 allele of Ripk1 resulted in decreased Ripk1 and Ripk3 levels in TKO bone marrow and spleen, comparable to Ripk1and Ripk3 levels in Bid+/+ mice (Figure 4F). Intracellular Ripk1 staining revealed increased Ripk1 expression at baseline in progenitor compared with LSK cells in TKORipk1(+/−) mice. Importantly, Ripk1 levels were decreased in TKORipk1(+/−) LSK and progenitor populations (Figure 4G; supplemental Figure 6C). Compared with TKO mice, TKORipk1(+/−) mice have a trend for increased total cell number in the marrow (supplemental Figure 6D), as well as increased progenitor cells and proliferation (Figure 4H). Strikingly, loss of 1 allele of Ripk1 is sufficient to restore red cell peripheral counts, as indicated by the number of red blood cells, hemoglobin, and hematocrit (Figure 4I). Thus, we establish that increased Ripk1-mediated necroptosis drives the altered hematopoiesis observed in TKO mice.
TKO cells outcompete Bid+/+ cells but fail to maintain hematopoiesis in competitive repopulation experiments
To evaluate TKO HSPC function, we performed a competitive repopulation of lethally irradiated congenic mice. Accordingly, we injected a 1:1 ratio of TKO (Ly45.2+) to Bid+/+ (Ly45.1+) bone marrow into lethally irradiated Bid+/+ (Ly5.1+) mice and evaluated peripheral blood for Ly45.2+ and Ly45.1+ mononuclear cells. Two additional cohorts of mice were examined in which a 1:1 ratio of Bid+/+ (Ly5.2+) or DKO (Ly5.2+) to Bid+/+ (Ly5.1+) marrow was similarly transplanted. Both DKO and TKO bone marrow displayed increased repopulating ability relative to Bid+/+ marrow (Figure 5A). However, peripheral blood counts reflected bone marrow stress in TKO mice, with decreased RBC counts (anemia) and platelets (thrombocytopenia) and increasing platelet size (Mean platelet volume) over time (Figure 5B-D; supplemental Figure 7A-B), consistent with BMF. Despite the presence of WT bone marrow, hematopoiesis was not maintained, suggesting a cell-extrinsic effect of TKO bone marrow on WT HSPCs.

TKO bone marrow can reconstitute and outcompete Bid+/+bone marrow but is unable to maintain long-term hematopoiesis. (A) Percentage of CD45.2+ cells in Bid+/+, DKO, and TKO transplant mice at 8, 12, 16, and 20 weeks after transplantation. Mice were transplanted with experimental and control bone marrow at a 1:1 ratio. Bid+/+, n = 7; DKO, n = 7; and TKO, n = 6. Statistics demonstrate differences between Bid+/+ and TKO animals. (B-D) RBCs (106/µL; B), platelet counts (103/µl; C), and mean platelet volume (fL; D) in transplanted Bid+/+ and TKO mice at 8, 12, 16, and 20 weeks after transplantation. Bid+/+, n = 5; TKO, n = 8. Statistics demonstrate differences between Bid+/+ and TKO animals. (E) Distribution of myeloid progenitor, LSK, and SLAM-HSC populations in Bid+/+, DKO, and TKO transplanted mice. Bid+/+, n = 5; DKO, n = 7; and TKO, n = 6. (F) CD45.2+ LSK cells in transplanted mice. (G) Secondary transplantation of DKO and TKO bone marrow (primary transplant in a 1:1 ratio with Bid+/+) to rigorously test hematopoietic stem cell function. DKO, n = 8; and TKO, n = 7. (H) Ratio of the colony-forming ability of CD45.1+ to CD45.2+ cells isolated from primary transplants. Bid+/+ or TKO CD45.2+ cells are transplanted in a 1:1 ratio with congenic CD45.1+Bid+/+ cells. CD45.1+ and CD45.2+ bone marrow cells were sorted and cultured in methylcellulose in the presence of IL3, IL6, SCF, EPO. Colonies were counted at 10 days. The data are from 3 independent experiments. (I) Number of colonies for indicated bone marrow cells relative to Bid+/+ colonies. Bid+/+ CD45.1 denotes WT CD45.1 cells transplanted with Bid+/+ CD45.2 cells. TKO CD45.1 denotes WT CD45.1 cells transplanted with TKO CD45.2 cells. ns, not significant; *P < .05 **P < .01, ***P < .001, and ****P < .0001. Data represent mean ± SEM.
TKO bone marrow can reconstitute and outcompete Bid+/+bone marrow but is unable to maintain long-term hematopoiesis. (A) Percentage of CD45.2+ cells in Bid+/+, DKO, and TKO transplant mice at 8, 12, 16, and 20 weeks after transplantation. Mice were transplanted with experimental and control bone marrow at a 1:1 ratio. Bid+/+, n = 7; DKO, n = 7; and TKO, n = 6. Statistics demonstrate differences between Bid+/+ and TKO animals. (B-D) RBCs (106/µL; B), platelet counts (103/µl; C), and mean platelet volume (fL; D) in transplanted Bid+/+ and TKO mice at 8, 12, 16, and 20 weeks after transplantation. Bid+/+, n = 5; TKO, n = 8. Statistics demonstrate differences between Bid+/+ and TKO animals. (E) Distribution of myeloid progenitor, LSK, and SLAM-HSC populations in Bid+/+, DKO, and TKO transplanted mice. Bid+/+, n = 5; DKO, n = 7; and TKO, n = 6. (F) CD45.2+ LSK cells in transplanted mice. (G) Secondary transplantation of DKO and TKO bone marrow (primary transplant in a 1:1 ratio with Bid+/+) to rigorously test hematopoietic stem cell function. DKO, n = 8; and TKO, n = 7. (H) Ratio of the colony-forming ability of CD45.1+ to CD45.2+ cells isolated from primary transplants. Bid+/+ or TKO CD45.2+ cells are transplanted in a 1:1 ratio with congenic CD45.1+Bid+/+ cells. CD45.1+ and CD45.2+ bone marrow cells were sorted and cultured in methylcellulose in the presence of IL3, IL6, SCF, EPO. Colonies were counted at 10 days. The data are from 3 independent experiments. (I) Number of colonies for indicated bone marrow cells relative to Bid+/+ colonies. Bid+/+ CD45.1 denotes WT CD45.1 cells transplanted with Bid+/+ CD45.2 cells. TKO CD45.1 denotes WT CD45.1 cells transplanted with TKO CD45.2 cells. ns, not significant; *P < .05 **P < .01, ***P < .001, and ****P < .0001. Data represent mean ± SEM.
Hematopoietic stem and progenitor compartments reflect a distinct phenotype of DKO and TKO HSPCs
To further explore how altered cell death mechanism impacts non–cell-autonomous interactions in the HSPC and progenitor compartment, we evaluated progenitor, LSK, and SLAM-HSC populations after 20 weeks in primary competitive repopulation experiments. Progenitor cell numbers were similar between DKO and TKO transplanted mice and untransplanted mice (Figure 5E; supplemental Figure 7C) and markedly decreased relative to Bid+/+ transplanted mice. Interestingly, Bid+/+ progenitors in TKO transplanted mice were decreased relative to Bid+/+ progenitors in DKO transplanted mice, suggesting the possibility that the presence of dying TKO progenitors may impair cotransplanted Bid+/+ progenitors. Strikingly, whereas DKO and Bid+/+ LSK cell numbers are similar, TKO bone marrow displays a substantial increase in LSK cells (approximately sevenfold), with a highly significant difference between DKO and TKO LSK cell numbers (Figure 5E-F). There was a trend to increased TKO SLAM-HSC (approximately twofold) numbers and a relative decrease in TKO progenitor cells (supplemental Figure 7C). In contrast, DKO HSPCs displayed a trend to an approximately twofold decrease relative to Bid+/+ HSPCs, consistent with bone marrow crowding due to increased mature cells (supplemental Figure 7C).
To further evaluate HSPC function and compare DKO and TKO bone marrow reserve, we performed a secondary transplant. DKO bone marrow continues to outcompete Bid+/+ marrow even in secondary transplant conditions, indicating continued HSPC self-renewal capacity (Figure 5G). In contrast, TKO bone marrow displays strikingly decreased competitive repopulating ability, consistent with decreased HSPC self-renewal capacity (exhaustion) in secondary transplant conditions (Figure 5G). We thus demonstrate that increased necroptosis impairs long-term HSPC function, resulting in HSPC exhaustion.
To further explore the impact of TKO bone marrow on WT hematopoietic progenitor cell function, we isolated CD45.1+ and CD45.2+ cells from competitively repopulated mice by FACS sorting, cultured these cells in methylcellulose, and evaluated colony numbers 10 days after plating. Transplanted TKO cells display decreased colony-forming ability (Figure 5H) relative to transplanted Bid+/+ cells. Strikingly, Bid+/+ cells transplanted in the presence of TKO cells also displayed decreased colony-forming ability as measured by the ratio of CD45.1+ cells transplanted with Bid+/+ cells to CD45.1+ cells transplanted with TKO cells (Figure 5I).
TKO bone marrow displays increased TNF-α and IL-1β production
TKO bone marrow displayed elevated TNF-α staining without treatment (supplemental Figure 7E). Examination of HSPCs revealed significantly increased TNF-α and interleukin-6 (IL-6) in LSK cells and IL-1β in both LSK and progenitors in TKO marrow compared with Bid+/+ marrow, but not interferon-γ (Figure 6A-C; supplemental Figure 7D). Bone marrow from TKORipk1(+/−) mice has significantly decreased TNF-α and IL-1β cytokine production (Figure 6D-E) relative to bone marrow from TKO mice. The above results are consistent with inflammation induced by necroptotic TKO cells.

TKO mice display increased TNF-α, which can be rescued by a genetic cross with Ripk1(+/−) mice or the anti-inflammatory drug Enbrel. (A) TNF-α, (B) IL-6, and (C) IL-1β positivity in myeloid progenitor and LSK populations in Bid+/+, DKO, and TKO mice. (D-E) Intracellular cytokine staining for TNF-α (D) and IL-1β (E) in Bid+/+, TKO, and TKORipk1(+/−) mouse bone marrow after 5 hours of LPS stimulation (200 ng/mL) + Golgi Plug. Bid+/+, n = 5; TKO, n = 7; and TKORipk1(+/−), n = 5. (F) Myeloid progenitor populations and corresponding fold change for Bid+/+ and TKO mice before and after treatment with Enbrel (TNF decoy receptor). (G) Number of BrdU-positive myeloid progenitors and fold change as in panel F. (H-I) RBCs (106/µL; H, left) and platelet counts (103/µL; I, right) in Bid+/+ and TKO mice with and without Enbrel and corresponding fold change. (J) Model diagram for cell death pathways in Bid+/+, DKO, and TKO mice. In a TKO mouse, the absence of Bax and Bak inhibits the feed-forward caspase amplification, while further loss of Bid results in necrotic cell death. Bid+/+, n = 4; and TKO, n = 4. *P < .05, ***P < .001, and ****P < .0001. Data represent mean ± SEM. MOMP, mitochondrial outer membrane permeabilization; ns, not significant.
TKO mice display increased TNF-α, which can be rescued by a genetic cross with Ripk1(+/−) mice or the anti-inflammatory drug Enbrel. (A) TNF-α, (B) IL-6, and (C) IL-1β positivity in myeloid progenitor and LSK populations in Bid+/+, DKO, and TKO mice. (D-E) Intracellular cytokine staining for TNF-α (D) and IL-1β (E) in Bid+/+, TKO, and TKORipk1(+/−) mouse bone marrow after 5 hours of LPS stimulation (200 ng/mL) + Golgi Plug. Bid+/+, n = 5; TKO, n = 7; and TKORipk1(+/−), n = 5. (F) Myeloid progenitor populations and corresponding fold change for Bid+/+ and TKO mice before and after treatment with Enbrel (TNF decoy receptor). (G) Number of BrdU-positive myeloid progenitors and fold change as in panel F. (H-I) RBCs (106/µL; H, left) and platelet counts (103/µL; I, right) in Bid+/+ and TKO mice with and without Enbrel and corresponding fold change. (J) Model diagram for cell death pathways in Bid+/+, DKO, and TKO mice. In a TKO mouse, the absence of Bax and Bak inhibits the feed-forward caspase amplification, while further loss of Bid results in necrotic cell death. Bid+/+, n = 4; and TKO, n = 4. *P < .05, ***P < .001, and ****P < .0001. Data represent mean ± SEM. MOMP, mitochondrial outer membrane permeabilization; ns, not significant.
Treatment with the TNF decoy receptor Enbrel restores MPCs and improves cytopenia in TKO mice
We next sought to determine whether inhibiting TNF-α could improve TKO cytopenia. We treated a cohort of Bid+/+, DKO, and TKO mice with the TNFR decoy Enbrel. Enbrel treatment increased the number of TKO myeloid progenitor cells and BrdU+ myeloid progenitor cells so that they were not significantly different from the corresponding Bid+/+ cell numbers (Figure 6F-G). Enbrel treatment also improved RBC and platelet counts in TKO mice (Figure 6H-I), consistent with a role of necroptosis-induced TNF-α in TKO BMF.
We propose that our results suggest a model (Figure 6J) in which loss of Bax and Bak removes a feed-forward amplification of caspase activation and intrinsic apoptotic cell death. In a TKO mouse, further loss of Bid results in a change in caspase-8 activation, resulting in decreased cleaved Ripk1 and increased necroptosis, consequently creating a highly inflammatory microenvironment in the marrow, leading to failure.
MDS demonstrates increased Ripk1 and pMLKL expression, suggesting increased necroptotic signaling
We have demonstrated that increased necroptosis in mouse bone marrow results in BMF with hypercellular marrow, prominent dysplasia, and a small frequency of transformation to leukemia, phenocopying the human BMF disorder MDS. Increased cell death in MDS bone marrow has been attributed to apoptosis based on techniques to measure cell death that do not distinguish between apoptotic and necroptotic cells,31 including in situ end labeling, terminal deoxynucleotidyltransferase-mediated dUTP nick end labeling staining, or DNA laddering on gels.32 Increased caspase-3 activity was seen in cultured MDS bone marrow,33 but only in 10% of MDS samples measured directly ex vivo.34
To determine whether necroptotic cell death may play a role in MDS, we investigated necroptosis and apoptosis in MDS patient bone marrow samples. Immunofluorescence for Ripk1 (Figure 7A) and pMLKL (Figure 7B) revealed increased expression of these markers in all samples of refractory cytopenia with multilineage dysplasia and 50% of RAEB-1 and RAEB-2 subtypes of MDS in our 22-patient cohort (Figure 7C). Staining for cleaved caspase-3 reveals modest staining in only a few samples, including controls (Figure 7D). These findings are consistent with increased necroptosis signaling in MDS bone marrow. We also observed an inverse correlation between Ripk1 and Bid expression in several MDS, but not control, patient samples (supplemental Figure 8A).
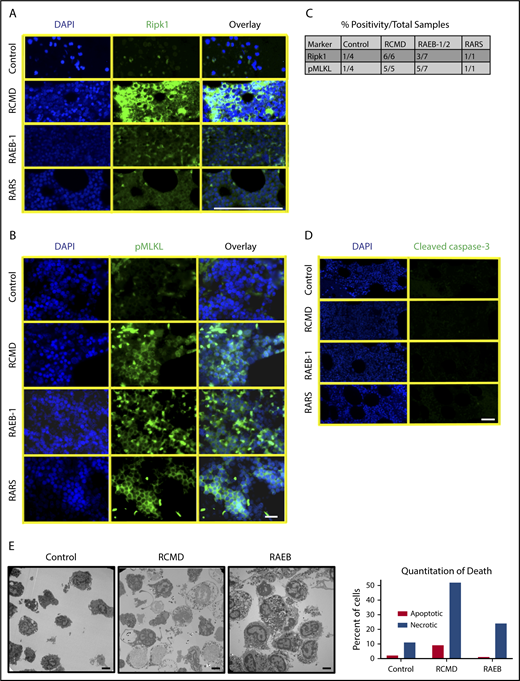
Bone marrow from patients with MDS displays increased Ripk1 and pMLKL and necrotic morphology on electron microscopy. (A) Ripk1 staining on paraffin-embedded human bone marrow aspirate for DAPI and Ripk1. MDS subtypes include (from top to bottom) refractory cytopenia with multilineage dysplasia (RCMD), refractory anemia with excess blasts (RAEB-1), and refractory anemia with ring sideroblasts (RARS). Scale bar, 100 μm. The experiment was performed 3 independent times. (B) Phospho-MLKL staining on paraffin-embedded human bone marrow aspirate. The experiment was performed 2 independent times. Scale bar, 50 μm. (C) Table demonstrating positivity of human samples for Ripk1 and pMLKL by subtype. (D) Cleaved caspase-3 staining on paraffin-embedded human bone marrow aspirate. The experiment was performed 3 independent times. Scale bar, 50 μm. (E) TEM of human bone marrow aspirate following RBC lysis from a normal control donor, an early MDS patient, and a RAEB patient. Scale bars, 2 μm; original magnification ×4400. Quantitation of apoptotic or necroptotic cell death for each patient represented in graph (right).
Bone marrow from patients with MDS displays increased Ripk1 and pMLKL and necrotic morphology on electron microscopy. (A) Ripk1 staining on paraffin-embedded human bone marrow aspirate for DAPI and Ripk1. MDS subtypes include (from top to bottom) refractory cytopenia with multilineage dysplasia (RCMD), refractory anemia with excess blasts (RAEB-1), and refractory anemia with ring sideroblasts (RARS). Scale bar, 100 μm. The experiment was performed 3 independent times. (B) Phospho-MLKL staining on paraffin-embedded human bone marrow aspirate. The experiment was performed 2 independent times. Scale bar, 50 μm. (C) Table demonstrating positivity of human samples for Ripk1 and pMLKL by subtype. (D) Cleaved caspase-3 staining on paraffin-embedded human bone marrow aspirate. The experiment was performed 3 independent times. Scale bar, 50 μm. (E) TEM of human bone marrow aspirate following RBC lysis from a normal control donor, an early MDS patient, and a RAEB patient. Scale bars, 2 μm; original magnification ×4400. Quantitation of apoptotic or necroptotic cell death for each patient represented in graph (right).
We further obtained bone marrow from 3 patients with normal bone marrow, early MDS, and RAEB at the time of biopsy for TEM to minimize cell death artifacts. Early MDS cells show marked necrosis morphology relative to RAEB or control bone marrow (Figure 7E). While this study does not rule out a role for apoptosis in a subset of MDS patients, our study clearly implicates necroptosis signaling in MDS bone marrow cell death.
Discussion
The role of necroptosis in dynamic systems such as hematopoiesis and the impact on the microenvironment is not well understood. We have developed a novel set of mouse models tuned to undergo apoptosis (WT) or necroptosis (TKO) to explore the impact of necroptotic PCD on hematopoiesis. Using these models, we demonstrate that increased necroptotic cell death in the bone marrow leads to loss of the progenitor cell populations with compensatory expansion and proliferation of SLAM-HSCs (Figure 4), leading to an initial increase in repopulating ability in primary competitive repopulation studies; ultimately, this leads to stem cell exhaustion and BMF in secondary competitive repopulating experiments.
We further demonstrate in competitive repopulation experiments that necroptotic cells can cause cytopenias. This suggests that necroptotic cell death results in a cell extrinsic impairment of normal hematopoietic stem cells, mediated by the release of DAMPS, that promote release of inflammatory cytokines such as TNF-α that amplify cell death in a feed-forward manner (supplemental Figure 8B-C). Accordingly, while treatment of TKO mice with Enbrel partially restores TKO progenitor cells and peripheral cytopenias (Figure 6), loss of 1 allele of Rip1 kinase restores peripheral red cell counts and significantly improves progenitor numbers and proliferation. Our data demonstrate that the mechanism by which cells die can have a marked impact on bone marrow homeostasis. Skewing death to necroptosis results in BMF driven at least in part by necroptosis-induced TNF-α production.
Multiple lines of evidence have identified caspase-8 and the Rip kinases as central to the early signaling events that commit a cell to a given cell death fate. Leveraging cell lines from our mouse models and bone marrow and splenocytes taken directly from the mouse, we demonstrate that Bid restrains hematopoietic necroptosis through a Bid/caspase-8 axis, which cleaves and inactivates Ripk1 (Figure 3; supplemental Figures S3 and S4). This is consistent with a previous finding6 that Ripk3 activates an apoptotic cell death pathway in settings where Ripk1 is blocked and also highlights a new, central role for Bid in the restraint of necroptosis.
Two recent studies demonstrate hematopoietic stem cell dysfunction in mice harboring genetic loss of Ripk1 in hematopoietic cells. Roderick et al demonstrated that a hematopoietic specific deletion of Ripk1 (Vav-iCre-Ripk1F/F) resulted in BMF as a result of HSPC loss that is partially restored by loss of Ripk3.35 Rickard et al demonstrated impaired engraftment of fetal liver cells from Ripk1−/− embryos that could be partially restored with a TNF blocking antibody.36 These studies are both consistent with a requirement for signaling through Rip1 kinase to support proper HSC function. Our study, designed to interrogate increased necroptosis signaling, demonstrates an expanded HSC population with increased repopulating ability, in agreement with a role for Rip1 kinase signaling to support hematopoietic stem cell function. We further provide evidence that the level of Ripk1 kinase signaling is critical, as restoring normal Ripk1 levels in hematopoietic cells can restore normal peripheral blood counts.
Our results significantly contribute to our understanding of how necroptosis, through increased Ripk1-dependent inflammatory cytokines, impacts hematopoietic homeostasis and hematopoietic stem cell function leading to BMF. Significantly, the hematopoietic phenotype of our TKO mice phenocopies the human BMF disorder MDS. Substantial data have established the presence of increased cell death and increased inflammation in MDS, and we now demonstrate increased necroptosis in MDS patient bone marrow. We show in mouse models that genetic loss of 1 allele of Ripk1 is sufficient to restore RBC peripheral counts and ameliorate excess cytokine production. Additional studies will be required to determine whether combining inhibition of both necroptosis and cytokines will provide added benefit.
The online version of this article contains a data supplement.
The publication costs of this article were defrayed in part by page charge payment. Therefore, and solely to indicate this fact, this article is hereby marked “advertisement” in accordance with 18 USC section 1734.
Acknowledgments
The authors thank Jennifer Pietenpol and Scott Hiebert for helpful comments, Janice Williams and Mary Dawes for assistance with TEM, Heidi Chen for help with biostatistics, and Claudio Mosse and James Atkinson for assistance with mouse pathology.
This work was supported by the National Institutes of Health, National Heart, Lung, and Blood Institute (grants R01-HL088347 [S.S.Z.] and 5T32HL06976509 [P.N.W.], the American Society of Hematology (bridge grant) (S.S.Z.), the US Department of Veterans Affairs (merit award BX002250, CDMRP W81XWH-16-1-0057) (S.S.Z.), the Evans Foundation (S.S.Z.). Immunofluorescence and TEM experiments were performed in part through the Vanderbilt University Cell Imaging Shared Resource and supported by the National Institutes of Health, National Cancer Institute (grant CA68485), National Institute of Diabetes and Digestive and Kidney Diseases (grants DK20593, DK58404, DK59637), and National Eye Institute (grant EY08126). Flow cytometry experiments were performed at the Vanderbilt University Medical Center, Flow Cytometry Shared Resource, and Vanderbilt-Ingram Cancer Center and supported by the National Institutes of Health, National Cancer Institute (grant P30CA68485) and Vanderbilt Digestive Disease Research Center (DDRC), National Institute of Diabetes and Digestive and Kidney Diseases (grant DK058404).
Authorship
Contribution: P.N.W., Q.S., C.T.S.-R., S.S.Z., and J.Z. performed experiments; S.S.Z., P.N.W., and C.T.S.-R. designed experiments and analyzed experimental results; Y.F. and M.R.S. provided MDS patient samples; all authors analyzed and interpreted data; and P.N.W., S.S.Z., and C.T.S.-R. wrote the manuscript.
Conflict-of-interest disclosure: M.R.S. received grants, personal fees, and nonfinancial support from Astex, Incyte Corporation, Takeda, and TG Therapeutics; personal fees and other funds from Boehringer-Ingelheim, Celgene, and Gilead; personal fees, nonfinancial support, and other support from Karyopharm; and grants and personal fees from Sunesis. The remaining authors declare no competing financial interests.
Correspondence: Sandra S. Zinkel, 2220 Pierce Ave, 548 Preston Research Building, Nashville, TN 37232; e-mail: sandra.zinkel@vumc.org.

This feature is available to Subscribers Only
Sign In or Create an Account Close Modal