

Key Points
AID protein expression and proliferative fractions are decreased during ibrutinib therapy in patients with CLL.
Downregulation of AID and proliferative subsets are associated with decrease of AKT and JAK1/STAT6 signaling after ibrutinib therapy.

Abstract
Activation-induced cytidine deaminase (AID) initiates somatic hypermutation and class switch recombination of the immunoglobulin genes. As a trade-off for its physiological function, AID also contributes to tumor development through its mutagenic activity. In chronic lymphocytic leukemia (CLL), AID is overexpressed in the proliferative fractions (PFs) of the malignant B lymphocytes, and its anomalous expression has been associated with a clinical poor outcome. Recent preclinical data suggested that ibrutinib and idelalisib, 2 clinically approved kinase inhibitors, increase AID expression and genomic instability in normal and neoplastic B cells. These results raise concerns about a potential mutagenic risk in patients receiving long-term therapy. To corroborate these findings in the clinical setting, we analyzed AID expression and PFs in a CLL cohort before and during ibrutinib treatment. We found that ibrutinib decreases the CLL PFs and, interestingly, also reduces AID expression, which correlates with dampened AKT and Janus Kinase 1 signaling. Moreover, although ibrutinib increases AID expression in a CLL cell line, it is unable to do so in primary CLL samples. Our results uncover a differential response to ibrutinib between cell lines and the CLL clone and imply that ibrutinib could differ from idelalisib in their potential to induce AID in treated patients. Possible reasons for the discrepancy between preclinical and clinical findings, and their effect on treatment safety, are discussed.
Introduction
Chronic lymphocytic leukemia (CLL) is a mature B-cell malignancy typically diagnosed in elderly patients1 based on the detection of mature monoclonal CD5+/CD23+ B cells in the peripheral blood (PB), bone marrow (BM), and secondary lymphoid organs.2,3 Historically, CLL has been described as a disease caused by the accumulation of quiescent clonal B cells, arrested in the G0 phase of the cell cycle. However, more recently, small fractions of the CLL clone were found to proliferate constitutively, and the relative size of the proliferative compartment has been linked to disease progression.4,5 As a consequence, they have been termed proliferative fractions (PFs).4,6-8 CLL cell proliferation occurs primarily in the secondary lymphoid organs within proliferation centers9 that resemble lymphoid follicles (“pseudofollicles”). In these areas, CLL cells are activated by signals from the microenvironment, especially activation of B-cell receptor (BCR) signaling,9 along with triggering costimulatory molecules such as CD40 and toll-like receptors,10 among others,11 that collectively result in cell proliferation and survival. CLL cell activation and proliferation are associated with the expression of activation-induced cytidine deaminase (AID),12 a B-cell–restricted enzyme that creates point mutations in the genomic DNA of the immunoglobulin (Ig) genes to initiate somatic hypermutation and class switch recombination.13 AID can also exhibit promiscuous activity outside the Ig locus, resulting in off-target mutations that have been linked to genomic instability14,15 and tumor progression in acute lymphoblastic leukemia16 and in diffuse large B-cell lymphoma.17 In CLL, AID expression is restricted to the subset of proliferating leukemia cells4,5,7,18 and can be detected in PB from patients with CLL with poor prognostic features, such as unmutated IGHV, extensive lymphocytosis, and short survival.4,19-21 This observation indicates that PFs and AID activity play an important role in the natural history of this disease.
Kinase inhibitors targeting BCR signaling have significantly improved the outcome of patients with CLL, especially those with high-risk CLL, and now are widely used in clinical practice.22,23 The BTK inhibitor ibrutinib induces high rates of durable remissions in patients with CLL with untreated and or refractory CLL.24,25 Ibrutinib abrogates CLL cell proliferation, both in vitro, judged by reduced Ki-67+ cells,26 and in vivo, based on abolished deuterium incorporation into the DNA of CLL cells in patients.27 Compagno et al recently reported that BCR signaling inhibition with either the phosphatidylinositol 3-kinase (PI3K)δ inhibitor idelalisib or ibrutinib increased AID protein expression in murine B cells and human B-cell lymphoma lines, along with increased genomic instability and tumor formation.28 These findings by Compagno et al raise concerns about a potential mutagenic risk in patients receiving long-term therapy because of AID overexpression. However, according to the available clinical data, continuous therapy with the PI3Kδ inhibitor idelalisib29 and with ibrutinib24,25 have not been associated with an increased risk of developing secondary cancers. Nonetheless, AID expression levels in idelalisib- or ibrutinib-treated patients with CLL have not previously been reported. Therefore, we analyzed AID expression and the percentage of the proliferative CLL cell fractions in serial CLL cell samples obtained before and during ibrutinib therapy. In addition, we also evaluated the phosphorylation status of PI3K/protein kinase B (PKB) pathway of the PF CXCR4low/CD5high and studied AICDA mRNA and AID protein expression in ibrutinib-treated primary CLL cells, and in MEC-1 cells, a CLL-derived cell line.30 Collectively, our data, in contrast with recent preclinical data,28 demonstrate that ibrutinib therapy results in a profound reduction in both AID expression and proliferative leukemic fractions in patients with CLL.
Methods
Patient selection
All patients fulfilled clinical and immune-phenotypic criteria for CLL and were enrolled in a clinical trial approved and conducted in accordance with the Institutional Review Board of the University of Texas MD Anderson Cancer Center guidelines and with the principles of the Declaration of Helsinki (ClinicalTrials.gov identifier: NCT02007044). Patients were treated at MD Anderson Cancer Center with ibrutinib 420 mg daily. After obtaining informed consent, PB samples were collected before and after the initiation of ibrutinib therapy. PB mononuclear cells (PBMCs) were isolated with Ficoll/Hypaque density-gradient centrifugation, purification of B cells was obtained by negative selection using EasySep Human B cell enrichment kit (StemCell Technologies, Vancouver, Canada), and purified B cells were cryopreserved with fetal bovine serum (FBS; Gibco, Thermo Fisher Scientific, Waltham, MA) supplemented with 10% dimethylsulphoxide (DMSO; Sigma-Aldrich, St. Louis, MO), and stored in vapor-phase liquid nitrogen until further use.
Flow cytometry analysis, in vitro cultures, and polymerase chain reaction analysis
Briefly, 1 × 10⁶ blood purified B cells were incubated with the corresponding mixture of antibodies or isotype controls for 30 minutes at 4°C in phosphate-buffered saline (PBS) with 0.5% bovine serum albumin (Sigma-Aldrich, St. Louis, MO). Cells were washed twice in PBS 0.5% bovine serum albumin before acquisition. For intracellular protein detection, 1 × 10⁶ PBMCs were fixed in PBS, paraformaldehyde 4%, washed twice in PBS, and then permeabilized in PBS containing 0.5% saponin and 5% FBS (PermB) after the addition of the specific antibody. For Ki-67 staining, conjugated anti-human Ki-67 was incubated for 30 minutes on ice. For intracellular AID staining, primary antibody was incubated 1:500 in PermB for 1 hour on ice and subsequently incubated for 30 minutes with secondary conjugated anti-rat. Methodology and antibodies used for phenotypic surface analysis of leukemic B cells are provided in supplemental Data 1, available on the Blood Web site.
AKT/PKB phospho array
Fluorescence-activated cell sorter isolation of the leukemic cell populations CD19+CXCR4lowCD5high (PF) and CD19+CXCR4highCD5low (quiescent fraction [QF]) in samples from patients with CLL treated with ibrutinib treatment was performed with the use of the Atrios cell sorter (Beckman Coulter, Brea, CA) and the FACS Aria II cell sorter (BD Bioscience). Detailed information is provided in supplemental Data 1. Purity of sorted PF and QP populations was greater than 98% in all the cases. Cell pellets were obtained by cold centrifugation and delivered to Full Moon BioSystems (Sunnyvale, CA) for the development of the AKT/PKB phosphoarray. We used AKT/PKB Phospho Antibody Array with 216 highly specific antibodies related to the PI3K/PKB/AKT pathway designed for protein phosphorylation profile in cell and tissue human samples. (Catalog No: PAB216; https://www.fullmoonbio.com/product/akt-pkb-phospho-antibody-array).
Cell lines and in vitro cultures
MEC-1 cell line was a kind gift of F. Caligaris-Cappio (Milano, Italy). For evaluation of ibrutinib effects on AID expression in vitro, MEC-1 cells were incubated in RPMI Medium 1640 (Gibco, Thermo Fisher) supplemented with 10% FBS (Gibco, Thermo Fisher) in the presence of ibrutinib (MedKoo Biosciences, Morrisville, NC) or Idelalisib (MedKoo Biosciences) at 0.1 or 1 µM for 24 or 48 hours. In vitro cultures with CD40L and interleukin (IL)-4 were performed as described in Palacios et al.31
Western blot and immunodetection
After harvesting, cells were lysed with RIPA buffer (50 mM TRIS-HCl at pH 7.4, 150 mM NaCl, 0.1% sodium dodecyl sulfate, 1% NP-40) supplemented with protease inhibitor cocktail (Roche, Basel, Switzerland). Samples were heated at 95°C for 5 minutes, and a total of 50 μg/well were loaded onto 12% Tris-glycine acrylamide gel. Electrophoresis and immunoblot methodology, as well as antibodies used, are detailed in supplemental Data 1.
RNA extraction and AID transcripts analysis
RNA extraction was performed from 1 × 10⁶ to 5 × 10⁶ purified CD19+ CLL cells, using Trizol (Invitrogen, Carlsbad, CA), and cDNA was synthesized as described in Palacios et al,4 using Superscript II reverse transcriptase (Invitrogen) with ribonuclease inhibitor RNAsin (Promega, Madison, WI). Standard and quantitative polymerase chain reaction (qPCR) amplification was performed as described in Palacios et al.4 AID and GAPDH primers are provided in the supplemental Data 1.
Statistical analyses
Percentages of CD38+ PF, CD86+ PF, IgM+/IgG+ PF, and CXCR4lowCD5high PF during ibrutinib treatment, as well as Ki-67- and AID-positive cells within the subsets, were compared with the use of 2-tailed paired Student t test. One-way analysis of variance (ANOVA) multiple comparison test was used in cases in which more than 2 conditions were evaluated. Variables with P < .05 were considered to be significant. All analyses were performed using GraphPad Prism 7 software version 7.0c (GraphPad, San Diego, CA).
Results
Ibrutinib treatment diminishes proliferative CLL fractions
The 4 distinct CLL PFs4,6-8 were quantified in PB samples from patients with CLL (n = 10) before and after 1 and 4 weeks of ibrutinib therapy. Clinical and laboratory characteristics are provided in Table 1, and the flow cytometry strategy for characterization of PFs is described in supplemental Figure 1. Our analyses demonstrated that the distinct CLL PFs, CD19+/Ki-67+ (I), CD19+/CD38+ (II), CD19+/CD86+ (III), IgM+/IgG+ (IV), and CXCR4low/CD5high (V), were significantly decreased after 4 weeks of ibrutinib treatment (Figure 1A). In addition, the proportion of proliferating CLL cells was reduced at 1 and 4 weeks after ibrutinib administration, as shown by the significant decrease in the proportion of leukemic cells expressing Ki-67, a marker for cell proliferation, in IgM+/IgG+ and CXCR4low/CD5high CLL cells. The mean proportion of IgM+/IgG+ cells expressing Ki-67 was 5.6% pretreatment vs 1.7% and 0.3% at weeks 1 and 4 posttreatment, respectively (P < .0001; 1-way ANOVA test). For CXCR4low/CD5high, the mean proportion of cells expressing Ki-67 decreased from 14.9% pretreatment to 5.8% and 1.36% at weeks 1 and 4 posttreatment, respectively (P < .0001; 1-way ANOVA test; Figure 1B-C). Altogether, these results support and expand previous works from Herman et al,32 confirming the effect of ibrutinib on CLL proliferating cells.
Patient’s characteristics: clinical and biological features of the cohort of patients used in this study
| CLL number | Age, y | Sex | FISH | TP53 mutations | Mutational status | Rai stage | Zap-70 (IHC) | CD38% (BM flow) | WBC (K/uL), baseline | Lymphocyte percentage | ABS LYMPH (K/μL), baseline |
|---|---|---|---|---|---|---|---|---|---|---|---|
| 13-US | 61 | F | 13q (59%) | c.402T>G p.F134L | Unmut | III | Pos | 30.1 | 121.8 | 95 | 115.73 |
| 16-US | 53 | M | 17p (57.5%), 13q (48.5%) | N/D | Unmut | I | Pos | 0.7 | 9.9 | 79 | 3.19 |
| 21-US | 53 | F | Negative | N/D | Unmut | II | Pos | 7.0 | 41.4 | 95 | 35.63 |
| 22-US | 72 | F | 17p (92%) | c.743G>A p.R248Q | Unmut | III | Neg | 74.7 | 131 | 81 | 124.47 |
| 32-US | 48 | F | 17p (85%) | N/D | Unmut | I | Pos | 89.6 | 7.4 | 93 | 5.8 |
| 36-US | 63 | M | 13q (33.5% single, 43% both) | N/D | Unmut | II | N/D | 9.4 | 2.9 | 85 | 0.7 |
| 45-US | 79 | M | 11q (92.5%), 13q (88.5% single, 3% both) | No mutations | Unmut | IV | Pos | 7.0 | 4.7 | 96 | 2.61 |
| 46-US | 48 | F | 17p (92%), 13 (89.5%) | No mutations | Unmut | IV | Pos | 40.7 | 12.7 | 93 | 6.75 |
| 3-US | 74 | M | 11q (88%), 13q (36% single, 46.5% both) | No mutations | Unmut | IV | Pos | 93.8 | 140.4 | 95 | 131.93 |
| 113-US | 59 | M | 11q (84.5%), 13q (84%) | No mutations | Unmut | I | Pos | 66.0 | 23.2 | 85 | 19.02 |
| 252 UY | 58 | M | 11q (62%), 13q (86%) | No mutations | Unmut | II | N/D | 45.7 | 120 | 82 | 110.08 |
| 279 UY | 53 | F | 17p (46%) | N/D | Unmut | II | N/D | 44 | 130 | 89 | 92.65 |
| 422 UY | 49 | M | 17p (72%) | No mutations | Unmut | IV | N/D | 83 | 100 | 95 | 99.57 |
| 450 UY | 57 | F | Negative | N/D | Unmut | I | N/D | 10.5 | 50 | 89 | 49.9 |
| 451 UY | 87 | M | Negative | N/D | Unmut | II | N/D | N/D | 111 | 92 | 102 |
| 456 UY | 59 | F | 17p (72%) | c.659A>G p.Y220C | Unmut | III | N/D | 56.8 | 107 | 90 | 95 |
| 457 UY | 52 | M | Tris 12 | No mutations | Unmut | IV | N/D | 32.5 | 75.4 | 87 | 68.7 |
| 458 UY | 61 | F | Negative | No mutations | Unmut | I | N/D | 8.7 | 14.7 | 72 | 12 |
ABS LYMPH, absolute lymphocytosis; FISH, fluorescence in situ hybridization; IHC, immunohistochemistry; N/D, no determined; Neg, negative; Pos, positive; US, American cohort; UY, Uruguayan cohort used in in vitro studies; WBS, whole blood count.
![Figure 1. Studies of proliferative CLL subsets during ibrutinib treatment of patients with CLL. Peripheral blood samples from patients with CLL before and after 1 and 4 weeks postibrutinib treatment were centrifuged in Ficoll gradient, and total MCs obtained were next analyzed by flow cytometry, using the different markers detailed here. Leukemic cells were discriminated by gating lymphocytes and by labeling CD19 plus CD5. (A) Ki-67+ (i), CD38 (ii), CD86 (iii), or CXCR4 (v) surface expression was evaluated in the 3 points depicted. Results are shown as percentages of CD19+/CD5+/Ki-67+ cells (i), CD19+/CD5+/CD38+ cells (ii), CD19+/CD5+/CD86+ cells (iii), or CD19+/CXCR4low/CD5high cells (v) by fixing the gate at the pretreated condition. (iv) Intracellular labeling of IgM plus IgG was performed where percentages of CD19+/IgM+/IgG+ cells before and after treatment is shown. As depicted for CD19+/Ki-67+, CD19+/CD38+; CD19+/CD86+, IgM+/IgG+, and CXCR4lowCD5high, the P values were P ≤ .0001, P = .001, P = .011; P = .016, and P = .005; respectively (n = 10). Each dot represents a single patient sample (*P < .05; ** P < .005; 2-tailed, Student paired t test). (B) Intracellular staining of Ki-67 was developed in CD19+/IgM+/IgG+ cells. Shown are representative dot plots and Ki-67 histograms in a representative patient (left) and the statistical analysis of the entire cohort evaluated (right part), where each dot represents a single patient sample. Pretreated IgM+/IgG+/Ki67+ was 5.6% vs 1.7% at 1 week (mean difference, 3.9; 95% confidence interval [CI], 1.5-6.3; P = .0013), whereas at 4 weeks, it was 0.3% (mean difference, 3.9; 95% CI, 2.9-7.6; P ≤ .0001; n = 10; 1-way ANOVA, multiple comparisons test). (C) Intracellular staining of Ki-67 was developed in CD19+CD5high/CXCR4low cells. Shown are representative dot plots and Ki-67 histograms in a representative patient (left part) and the statistical analysis of the entire cohort (right part), where each dot represents a single patient sample. For CXCR4lowCD5high, the mean proportion of cells expressing Ki-67 at pretreatment is 14.9% vs 5.8% at week 1 (mean difference, 9.1; 95% CI, 2.4-15.7; P = .042); and for week 4, 1.36%, with a mean difference of 13.5 (95% CI, 6.7-20.3; P = .017; n = 10; 1-way ANOVA, multiple comparisons test).](https://ash.silverchair-cdn.com/ash/content_public/journal/blood/133/19/10.1182_blood-2018-09-876292/3/m_blood876292f1.png?Expires=1765895330&Signature=h80OXHctrLlj8yF~Cq8G89rnwaOfT0l1LdtoKhZSfzDvFi-mTXmNGv2J8WS3P4gO-YSfaRZHvnvMgLmeKgE8JtaKP4-0EqLGcqe9e~7JgyCF9T02kCT2B6sHpfu2UC-QO~KGMfRS-3kKvOBBVsxLbgGGuwA4nf1-Sj6CLdDgQoEZzQNI3WNon1osY2S-2Y-nuqlZK71uo0Gz~-XYQyq3NarXTqFGuQ4rB3TlPqqf4o5~pA1PCqedg7KQ9R9fpjG2BsM19Vq6W93U5~Kjv58EosOsb7-BZMny5unyWSY~w7fDSWgbRMWLViIGxHHh3jF~8pfaocvyffXIXSAtzPtVeA__&Key-Pair-Id=APKAIE5G5CRDK6RD3PGA)
Studies of proliferative CLL subsets during ibrutinib treatment of patients with CLL. Peripheral blood samples from patients with CLL before and after 1 and 4 weeks postibrutinib treatment were centrifuged in Ficoll gradient, and total MCs obtained were next analyzed by flow cytometry, using the different markers detailed here. Leukemic cells were discriminated by gating lymphocytes and by labeling CD19 plus CD5. (A) Ki-67+ (i), CD38 (ii), CD86 (iii), or CXCR4 (v) surface expression was evaluated in the 3 points depicted. Results are shown as percentages of CD19+/CD5+/Ki-67+ cells (i), CD19+/CD5+/CD38+ cells (ii), CD19+/CD5+/CD86+ cells (iii), or CD19+/CXCR4low/CD5high cells (v) by fixing the gate at the pretreated condition. (iv) Intracellular labeling of IgM plus IgG was performed where percentages of CD19+/IgM+/IgG+ cells before and after treatment is shown. As depicted for CD19+/Ki-67+, CD19+/CD38+; CD19+/CD86+, IgM+/IgG+, and CXCR4lowCD5high, the P values were P ≤ .0001, P = .001, P = .011; P = .016, and P = .005; respectively (n = 10). Each dot represents a single patient sample (*P < .05; ** P < .005; 2-tailed, Student paired t test). (B) Intracellular staining of Ki-67 was developed in CD19+/IgM+/IgG+ cells. Shown are representative dot plots and Ki-67 histograms in a representative patient (left) and the statistical analysis of the entire cohort evaluated (right part), where each dot represents a single patient sample. Pretreated IgM+/IgG+/Ki67+ was 5.6% vs 1.7% at 1 week (mean difference, 3.9; 95% confidence interval [CI], 1.5-6.3; P = .0013), whereas at 4 weeks, it was 0.3% (mean difference, 3.9; 95% CI, 2.9-7.6; P ≤ .0001; n = 10; 1-way ANOVA, multiple comparisons test). (C) Intracellular staining of Ki-67 was developed in CD19+CD5high/CXCR4low cells. Shown are representative dot plots and Ki-67 histograms in a representative patient (left part) and the statistical analysis of the entire cohort (right part), where each dot represents a single patient sample. For CXCR4lowCD5high, the mean proportion of cells expressing Ki-67 at pretreatment is 14.9% vs 5.8% at week 1 (mean difference, 9.1; 95% CI, 2.4-15.7; P = .042); and for week 4, 1.36%, with a mean difference of 13.5 (95% CI, 6.7-20.3; P = .017; n = 10; 1-way ANOVA, multiple comparisons test).
Studies of proliferative CLL subsets during ibrutinib treatment of patients with CLL. Peripheral blood samples from patients with CLL before and after 1 and 4 weeks postibrutinib treatment were centrifuged in Ficoll gradient, and total MCs obtained were next analyzed by flow cytometry, using the different markers detailed here. Leukemic cells were discriminated by gating lymphocytes and by labeling CD19 plus CD5. (A) Ki-67+ (i), CD38 (ii), CD86 (iii), or CXCR4 (v) surface expression was evaluated in the 3 points depicted. Results are shown as percentages of CD19+/CD5+/Ki-67+ cells (i), CD19+/CD5+/CD38+ cells (ii), CD19+/CD5+/CD86+ cells (iii), or CD19+/CXCR4low/CD5high cells (v) by fixing the gate at the pretreated condition. (iv) Intracellular labeling of IgM plus IgG was performed where percentages of CD19+/IgM+/IgG+ cells before and after treatment is shown. As depicted for CD19+/Ki-67+, CD19+/CD38+; CD19+/CD86+, IgM+/IgG+, and CXCR4lowCD5high, the P values were P ≤ .0001, P = .001, P = .011; P = .016, and P = .005; respectively (n = 10). Each dot represents a single patient sample (*P < .05; ** P < .005; 2-tailed, Student paired t test). (B) Intracellular staining of Ki-67 was developed in CD19+/IgM+/IgG+ cells. Shown are representative dot plots and Ki-67 histograms in a representative patient (left) and the statistical analysis of the entire cohort evaluated (right part), where each dot represents a single patient sample. Pretreated IgM+/IgG+/Ki67+ was 5.6% vs 1.7% at 1 week (mean difference, 3.9; 95% confidence interval [CI], 1.5-6.3; P = .0013), whereas at 4 weeks, it was 0.3% (mean difference, 3.9; 95% CI, 2.9-7.6; P ≤ .0001; n = 10; 1-way ANOVA, multiple comparisons test). (C) Intracellular staining of Ki-67 was developed in CD19+CD5high/CXCR4low cells. Shown are representative dot plots and Ki-67 histograms in a representative patient (left part) and the statistical analysis of the entire cohort (right part), where each dot represents a single patient sample. For CXCR4lowCD5high, the mean proportion of cells expressing Ki-67 at pretreatment is 14.9% vs 5.8% at week 1 (mean difference, 9.1; 95% CI, 2.4-15.7; P = .042); and for week 4, 1.36%, with a mean difference of 13.5 (95% CI, 6.7-20.3; P = .017; n = 10; 1-way ANOVA, multiple comparisons test).
Ibrutinib therapy modifies the phosphorylation status of AKT/PKB in the CXCR4lowCD5high PF
Taking into account different studies demonstrating the importance of PI3K/AKT signaling during CLL progression,23,31,33,34 we analyzed the phosphorylation status of the AKT/PKB pathway during ibrutinib treatment. To accomplish this task, we isolated the CXCR4lowCD5high PF from patients CLL3, CLL16, and CLL36 by cell sorting before and during ibrutinib treatment, and analyzed these samples using a phospho-array platform. The full data set of this experiment is provided in supplemental Data 2. Analysis of the 3 patients allowed us to identify significant changes in the phosphorylation status of different proteins involved in cancer progression after ibrutinib treatment. From a total of 94 protein variants (44 genes), 63 had no significant differences. In contrast, 31 protein variants (25 genes, 57%) were significantly dephosphorylated (n = 12) or phosphorylated (n = 19) after ibrutinib treatment (Figure 2A-B). Between these significant changes, we found increased dephosphorylation of important molecules-pathways implicated in B-cell activation and proliferation, such as spleen tyrosine kinase,35 GSK3-α,36,37 Janus Kinase 1 (JAK1),38 or AKT/PI3K39 (Figure 2B-C). Specifically, dephosphorylation in the Tyrosine 1022 residue of JAK1 has been reported as a key modification needed for the deactivation of the catalytic center of this kinase.40-42 Furthermore, spleen tyrosine kinase and JAK1 have been previously reported to be involved in CLL progression.43,44 Interestingly, we also found a significant dephosphorylation of serine/threonine kinase AKT1 protein in residues associated with activation of this pathway, such as Ser47345 and Thr72.46 In line with these observations, we found an increased phosphorylation of protein phosphatase 2A, which constitutes an AKT deactivating phosphatase,47 and AKT1S1, which is an inhibitor of mTORC2, the main activating kinase of AKT39,48 (Figure 2B-C). Finally, there was increased phosphorylation in key residues in the P53 protein (Ser392, Ser37, Ser46, and Thr18), as well as of other important proteins related with survival such as BAD (Ser134), Cicline D1 (Thr-286), and FOXO1 (Thr24/32), among others (Figure 2C). Altogether, these data show how ibrutinib therapy directly affects the phosphorylation status of the PFs.
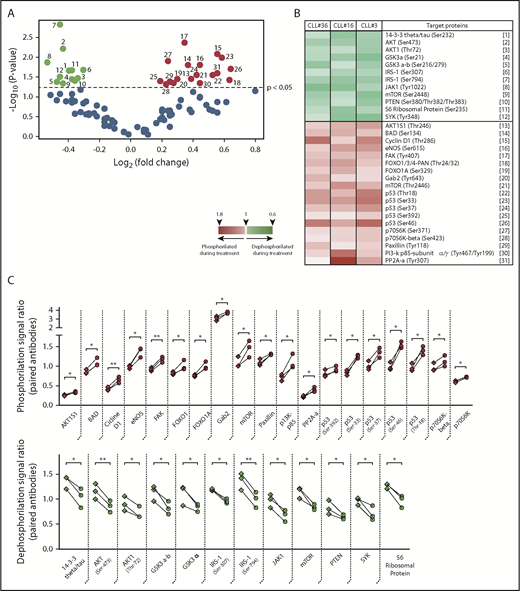
Phosphorylation profile of CD5high/CXCR4low leukemic cells in patients with CLL treated with ibrutinib. Cell sorting purified CD19+/CD5high/CXCR4low cells obtained from PBMC of 3 patients with CLL before and after 4 weeks of ibrutinib therapy were used to perform a phosphoarray analysis. (A) Volcano plot showing the fold change vs the P value obtained for each evaluated phosphorylation site. Black dots refer to sites that did not change after treatment (63 phosphorylation sites). Depicted in color are the sites that were significantly dephosphorylated (green dots, 12 sites) or phosphorylated (red dots, 19 sites) during therapy (P < .05; n = 3; 2-tailed paired Student t test). The reference for each numbered dot is depicted in panel B. (B) Heat map showing the targeted proteins with their corresponding phosphorylation sites in 3 CLL patient samples. Heat map scale is shown at the bottom. (C) Statistically significant changes in phosphorylation rate (red, upper panel) or dephosphorylation rate (green, lower panel) during ibrutinib administration are shown. Each square represents the signal ratio of the antibody against the unphosphorylated form of the site before and after treatment, connected with the round dot for the signal ratio of the phosphorylated form (P < .05; n = 3; 2-tailed paired Student t test). Relevant proteins associated with inactivation of PI3K/AKT, JAK/STAT, and p53 pathway are indicated in bold at the x axes.
Phosphorylation profile of CD5high/CXCR4low leukemic cells in patients with CLL treated with ibrutinib. Cell sorting purified CD19+/CD5high/CXCR4low cells obtained from PBMC of 3 patients with CLL before and after 4 weeks of ibrutinib therapy were used to perform a phosphoarray analysis. (A) Volcano plot showing the fold change vs the P value obtained for each evaluated phosphorylation site. Black dots refer to sites that did not change after treatment (63 phosphorylation sites). Depicted in color are the sites that were significantly dephosphorylated (green dots, 12 sites) or phosphorylated (red dots, 19 sites) during therapy (P < .05; n = 3; 2-tailed paired Student t test). The reference for each numbered dot is depicted in panel B. (B) Heat map showing the targeted proteins with their corresponding phosphorylation sites in 3 CLL patient samples. Heat map scale is shown at the bottom. (C) Statistically significant changes in phosphorylation rate (red, upper panel) or dephosphorylation rate (green, lower panel) during ibrutinib administration are shown. Each square represents the signal ratio of the antibody against the unphosphorylated form of the site before and after treatment, connected with the round dot for the signal ratio of the phosphorylated form (P < .05; n = 3; 2-tailed paired Student t test). Relevant proteins associated with inactivation of PI3K/AKT, JAK/STAT, and p53 pathway are indicated in bold at the x axes.
AID expression is downregulated after ibrutinib treatment in CLL proliferative fractions
Reduction of CLL PFs during ibrutinib treatment and dephosphorylation of key pathway molecules involved in control of AID expression, such as IL-4/JAK1/STAT649-53 and/or PI3K/AKT,31 lead us to evaluate the effects of ibrutinib therapy on AID expression in patients with CLL. Therefore, we assessed AID protein in the PFs by flow cytometry, as previously described.5 CLL cells stimulated with CD40L and IL-4 for 5 days served as positive controls. Such CLL cells demonstrated increased cell size by FSC/SSC and AID positivity that ranged from 18% to 55% of the whole CLL clone on the 3 patients analyzed (supplemental Figure 2). AID is primarily expressed in the PFs.4,8,18 Accordingly, we observed a higher proportion of AID-positive CLL cells in the CXCR4low/CD5high and IgM+/IgG+ populations when compared with the fraction of AID+ cells in the entire CLL cell population (CD19+/CD5+). Mean percentage of AID+ cells was 7.2% ± 0.7% and 10% ± 1.7%, for IgM+/IgG+ and CXCR4lowCD5high, respectively, vs 1.8% ± 0.1% for the whole clone (Figure 3 A-B; supplemental Figure 2B). When we evaluated the effect of ibrutinib therapy within the IgM+/IgG+ and CXCR4low/CD5high PFs, the proportion of AID+ leukemic cells were clearly decreased at 1 and 4 weeks after treatment, reaching statistical significance for both the CXCR4low/CD5high and IgM+/IgG+ subsets at the 4-week point (Figure 3A-B). For IgM+/IgG+, the corresponding values were 7.2% pre- and 2.5% at week 4 posttreatment (n = 9; P = .0007), whereas for CXCR4low/CD5high, subset percentages were 10% pre- and 1.13% at week 4 (n = 5; P = .0016; 1-way ANOVA, multiple comparisons test). It was possible that AID-positive cells were more sensitive to the treatment, and therefore preferentially lost in the treated samples. If this were the case, AID might not be decreased in the leukemic cells, but instead, CLL cells expressing AID might die after ibrutinib treatment. To test this hypothesis, we quantified AID protein levels in the QF of patients with CLL (n = 30) and in CXCR4lowCD5high and IgM+/IgG+ PFs of treated samples (n = 10), using mean fluorescence intensities (MFIs) before and during ibrutinib therapy. Our results showed that AID MFI levels are significantly decreased in these subsets after ibrutinib treatment. The mean of cells expressing AID in IgM+/IgG+ PF at pretreatment was 9.7 MFI vs 6.0 MFI at week 4 (mean differences, 3.7; 95% CI, 1.4-6.0; P = .0004; n = 10). For CXCR4lowCD5high PF, pretreatment was 7.0 MFI 4.5 MFI for week 4 (mean differences, 2.4; 95% CI, 1.0-3.7; P = .0004; n = 5; 1-way ANOVA, multiple comparisons test). These data confirm that downregulation of AID cannot be solely explained by the disappearance of AID-positive CLL cells (Figure 3A-B), but most likely by a decrease of AID expression on individual CLL cells evidenced by MFI differences (Figure 3C-D). Altogether, our results show that AID expression is decreased in the IgM+/IgG+ and CXCR4low/CD5high subsets within the leukemic clone after ibrutinib therapy.
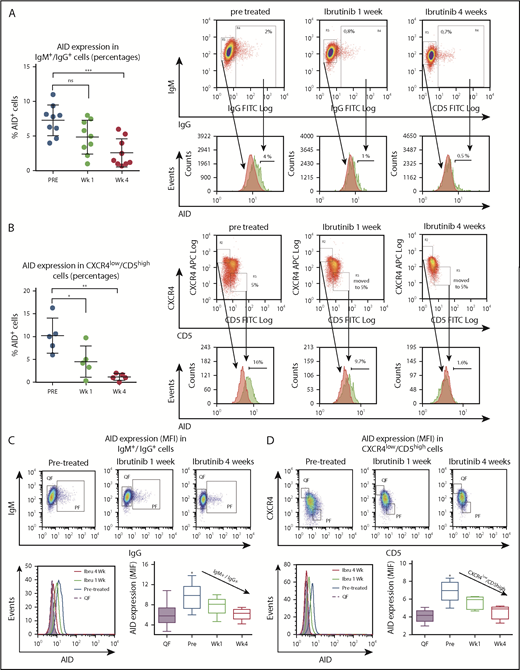
Analysis of AID expression in B cells from ibrutinib-treated patients with CLL. PBMC samples from patients with CLL before and after 1 and 4 weeks of ibrutinib in vivo therapy were studied by flow cytometry to measure intracellular AID protein. Leukemic cells were discriminated by gating lymphocytes and by labeling CD19 plus CD5. Expression of AID as percentage of positive cells in the proliferative CD19+/IgM+/IgG+ subset compared with IgM+/IgG- quiescent cells or from proliferative CD19+/CD5high/CXCR4low vs CD19+/CD5low/CXCR4high quiescent cells for treatment at 3 times. (A) Results for the IgM+/IgG+ subset in the whole group of patients evaluated (left graphic) and 1 representative cytometry data (right graphic). The corresponding median values were 7.2% pre- and 2.5% at week 4 posttreatment (mean difference, 4.7%; 95% CI, 2.3-7.2; P = .0007, 1-way ANOVA, multiple comparisons test). Nonsignificant differences were found between pre- and 1 week posttreatment samples (P = .810). Right panel shows representative dot plots of the gates constructed to select the subsets and from where the histograms of AID expression were obtained. PF and QF are depicted in green and red, respectively. (B) Results for the CXCR4 low/CD5 high fraction in the whole group of patients evaluated (left graphic) and 1 representative cytometry data (right graphic). Significant differences were found comparing pr-treatment mean (10%) vs mean posttreatment at week 1, 4.5%; (mean difference, 5.68%; 95% CI, 0.91-10.45; P = .278) and vs week 3, 1.13% (mean difference, 9.5%; 95% CI, 4.3%-13.8%; P = .0016 by 1-way ANOVA, multiple comparisons test). PF and QF are depicted in green and red, respectively. (C-D) MFI AID expression on the quiescent and proliferative subsets CD19+IgM+IgG+ compared with IgM+/IgG- quiescent cells or from proliferative CD19+/CD5high/CXCR4low vs CD19+/CD5low/CXCR4high quiescent cells, at the points indicated. Intracellular staining of AID as MFI was evaluated. Shown are representative dot plots and gate criteria (higher graphics), as well as AID histograms of cytometric MFI shifts with treatment (lower left graphic) for a single patient. The statistics of the whole cohort evaluated are shown in the lower right graphics. The mean of cells expressing AID in IgM+/IgG+ PF at pretreatment was 9.7 MFI vs 6.0 MFI at week 4 (mean differences, 3.7; 95% CI, 1.4-6.0; P = .0004; n = 10). For CXCR4lowCD5high PF pretreatment, 7.0 MFI vs 4.5 at week 4 MFI (mean differences, 2.4; 95% CI, 1.0-3.7; P = .0004; n = 5). One-way ANOVA with Tukey's multiple comparisons test was used in all cases (***P < .0005).
Analysis of AID expression in B cells from ibrutinib-treated patients with CLL. PBMC samples from patients with CLL before and after 1 and 4 weeks of ibrutinib in vivo therapy were studied by flow cytometry to measure intracellular AID protein. Leukemic cells were discriminated by gating lymphocytes and by labeling CD19 plus CD5. Expression of AID as percentage of positive cells in the proliferative CD19+/IgM+/IgG+ subset compared with IgM+/IgG- quiescent cells or from proliferative CD19+/CD5high/CXCR4low vs CD19+/CD5low/CXCR4high quiescent cells for treatment at 3 times. (A) Results for the IgM+/IgG+ subset in the whole group of patients evaluated (left graphic) and 1 representative cytometry data (right graphic). The corresponding median values were 7.2% pre- and 2.5% at week 4 posttreatment (mean difference, 4.7%; 95% CI, 2.3-7.2; P = .0007, 1-way ANOVA, multiple comparisons test). Nonsignificant differences were found between pre- and 1 week posttreatment samples (P = .810). Right panel shows representative dot plots of the gates constructed to select the subsets and from where the histograms of AID expression were obtained. PF and QF are depicted in green and red, respectively. (B) Results for the CXCR4 low/CD5 high fraction in the whole group of patients evaluated (left graphic) and 1 representative cytometry data (right graphic). Significant differences were found comparing pr-treatment mean (10%) vs mean posttreatment at week 1, 4.5%; (mean difference, 5.68%; 95% CI, 0.91-10.45; P = .278) and vs week 3, 1.13% (mean difference, 9.5%; 95% CI, 4.3%-13.8%; P = .0016 by 1-way ANOVA, multiple comparisons test). PF and QF are depicted in green and red, respectively. (C-D) MFI AID expression on the quiescent and proliferative subsets CD19+IgM+IgG+ compared with IgM+/IgG- quiescent cells or from proliferative CD19+/CD5high/CXCR4low vs CD19+/CD5low/CXCR4high quiescent cells, at the points indicated. Intracellular staining of AID as MFI was evaluated. Shown are representative dot plots and gate criteria (higher graphics), as well as AID histograms of cytometric MFI shifts with treatment (lower left graphic) for a single patient. The statistics of the whole cohort evaluated are shown in the lower right graphics. The mean of cells expressing AID in IgM+/IgG+ PF at pretreatment was 9.7 MFI vs 6.0 MFI at week 4 (mean differences, 3.7; 95% CI, 1.4-6.0; P = .0004; n = 10). For CXCR4lowCD5high PF pretreatment, 7.0 MFI vs 4.5 at week 4 MFI (mean differences, 2.4; 95% CI, 1.0-3.7; P = .0004; n = 5). One-way ANOVA with Tukey's multiple comparisons test was used in all cases (***P < .0005).
AID downregulation in CLL cells by ibrutinib is associated with dephosphorylation of the transcription factor STAT6
Compagno et al reported that inhibition of BTK by ibrutinib increased AID expression in vitro in human lymphoma and leukemia cell lines,28 which was different from our results using primary CLL cells from patients treated with ibrutinib. Because different technical approaches (flow cytometry and immunoblot) were used in each laboratory and to corroborate our findings, we first evaluated AID expression in the MEC-1 CLL cell line by both techniques. Our results using immunoblot confirm those previously obtained by Compagno et al, showing upregulation of AID after incubation with ibrutinib and idelalisib in MEC-1 cells, which additionally allowed us to further validate the flow cytometry technique that we used to asses AID expression (Figure 4A). We then used the same strategy to analyze patient-derived CLL cell cultures. PBMC from 5 different patients with CLL were incubated with ibrutinib at 0.3 and 1 μM for 24 and 48 hours, and AID expression was evaluated by qPCR and immunoblot. Despite the fact that ibrutinib increased AID protein levels in MEC-1 cells, no differences in AID expression were noted in primary CLL cell cultured with ibrutinib. As depicted in Figure 4B, no differences of AID expression were detected when comparing control samples with those incubated with ibrutinib. As positive controls, we used samples from primary CLL cells cultured with CD40L+IL4 as stimuli, or MEC-1 cells incubated with different concentrations of ibrutinib, both of which induced AID expression. Two representative patients of this experiment are shown (Figure 4A-B).
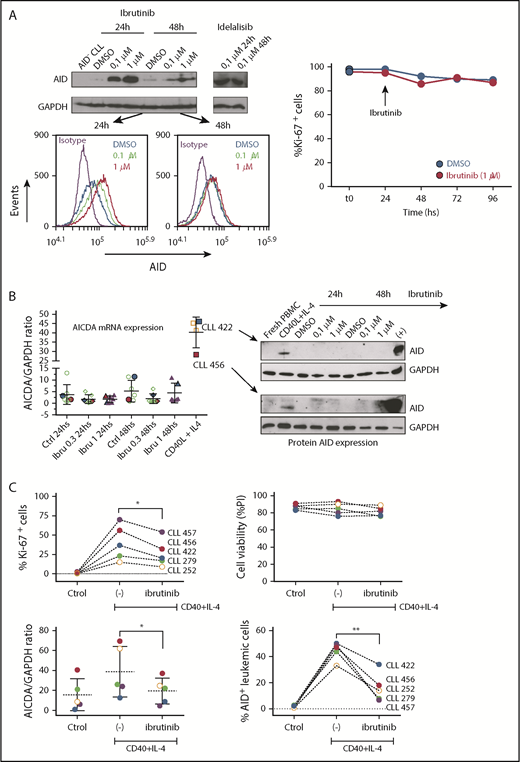
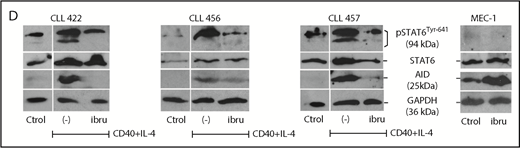
Analysis of AID expression in CLL cells treated in vitro with ibrutinib. (A) MEC-1 cell line was cultured in the presence of ibrutinib at 0.1 and 1 µM for 24 and 48 hours, or in DMSO as control. AID expression at the protein level was evaluated by immunoblotting and flow cytometry techniques. Shown are representative immunoblots (upper graphic) and mean fluorescence cytometry histograms (lower panels), where increasing AID levels are detected for all treated conditions. Proliferation measured by Ki-67 expression was performed at baseline and after 24 and 48 hours of ibrutinib treatment (right graphic). (B) PB CLL cells were incubated in the presence of ibrutinib at 0.3 and 1 µM. DMSO was used as basal control, and CD40L+IL-4 stimulation to induce AID expression was used as positive control (n = 5). AICDA mRNA and protein expression was evaluated at 24 and 48 hours, as indicated in the x-axis. Shown are the results from the whole cohort of patients studied by quantitative qPCR (left graphic) and the immunoblot obtained when studying the 2 patients colored in red and blue (right graphic). AID increase was detected only in the CD40L+IL-4 activated condition for both mRNA and protein determinations. (C) PBMC from 5 patients with CLL were incubated with CD40+IL-4 or CD40+IL-4+ibrutinib 1 μM, and then cultured for 5 days. Proliferation was evaluated by Ki-67 expression, and viability of cells was analyzed by propidium iodide as a life/death marker (upper graphics). As previously described by Slinger et al,44 maximum inhibition of proliferation was achieved after 24 hours. AICDA mRNA levels and AID protein were tested by qPCR and immunoblotting, respectively, at the different times and conditions (lower graphics). Significance was calculated comparing stimulated condition (CD40+IL-4) with stimulated condition + ibrutinib by 2-tailed, paired t-test (*P < .05; **P < .01). (D) PBMC from 3 patients with CLL were incubated in the presence of CD40L+IL-4 in the same conditions as mentioned here. Samples without treatment (RPMI+FBS 10%+DMSO -ctrol-), samples treated with CD40L+IL-4 and samples treated with CD40L+IL-4+1 μM of ibrutinib were tested. Glyceraldehyde-3-phosphate dehydrogenase (load control); AID; STAT6 and p-STAT6-Tyr641 proteins expression were evaluated at day 5. Immunoblots depict the effect of ibrutinib on AID expression and STAT6 phosphorylation. Whereas AID and p-STAT6-Tyr641 decrease during ibrutinib treatment, the nonphosphorylated form of STAT-6 remains unchanged. The same proteins were analyzed in the MEC-1 cell line after incubation with ibrutinib (ibru) or DMSO as control (Ctrol). As depicted, p-STAT6-Tyr641 was undetectable in neither condition, whereas the nonphosphorylated STAT-6 form remains unchanged. As previously described,28 AID expression increased when MEC1 cells are cultured in presence of ibrutinib.
Analysis of AID expression in CLL cells treated in vitro with ibrutinib. (A) MEC-1 cell line was cultured in the presence of ibrutinib at 0.1 and 1 µM for 24 and 48 hours, or in DMSO as control. AID expression at the protein level was evaluated by immunoblotting and flow cytometry techniques. Shown are representative immunoblots (upper graphic) and mean fluorescence cytometry histograms (lower panels), where increasing AID levels are detected for all treated conditions. Proliferation measured by Ki-67 expression was performed at baseline and after 24 and 48 hours of ibrutinib treatment (right graphic). (B) PB CLL cells were incubated in the presence of ibrutinib at 0.3 and 1 µM. DMSO was used as basal control, and CD40L+IL-4 stimulation to induce AID expression was used as positive control (n = 5). AICDA mRNA and protein expression was evaluated at 24 and 48 hours, as indicated in the x-axis. Shown are the results from the whole cohort of patients studied by quantitative qPCR (left graphic) and the immunoblot obtained when studying the 2 patients colored in red and blue (right graphic). AID increase was detected only in the CD40L+IL-4 activated condition for both mRNA and protein determinations. (C) PBMC from 5 patients with CLL were incubated with CD40+IL-4 or CD40+IL-4+ibrutinib 1 μM, and then cultured for 5 days. Proliferation was evaluated by Ki-67 expression, and viability of cells was analyzed by propidium iodide as a life/death marker (upper graphics). As previously described by Slinger et al,44 maximum inhibition of proliferation was achieved after 24 hours. AICDA mRNA levels and AID protein were tested by qPCR and immunoblotting, respectively, at the different times and conditions (lower graphics). Significance was calculated comparing stimulated condition (CD40+IL-4) with stimulated condition + ibrutinib by 2-tailed, paired t-test (*P < .05; **P < .01). (D) PBMC from 3 patients with CLL were incubated in the presence of CD40L+IL-4 in the same conditions as mentioned here. Samples without treatment (RPMI+FBS 10%+DMSO -ctrol-), samples treated with CD40L+IL-4 and samples treated with CD40L+IL-4+1 μM of ibrutinib were tested. Glyceraldehyde-3-phosphate dehydrogenase (load control); AID; STAT6 and p-STAT6-Tyr641 proteins expression were evaluated at day 5. Immunoblots depict the effect of ibrutinib on AID expression and STAT6 phosphorylation. Whereas AID and p-STAT6-Tyr641 decrease during ibrutinib treatment, the nonphosphorylated form of STAT-6 remains unchanged. The same proteins were analyzed in the MEC-1 cell line after incubation with ibrutinib (ibru) or DMSO as control (Ctrol). As depicted, p-STAT6-Tyr641 was undetectable in neither condition, whereas the nonphosphorylated STAT-6 form remains unchanged. As previously described,28 AID expression increased when MEC1 cells are cultured in presence of ibrutinib.
Taking into account that different proliferation rates exist between MEC-1 cell line and CLL cells from PB, and knowing that a direct correlation exists between AID and proliferation,54 we investigated the profile of AID expression in primary CLL samples stimulated with CD40L+IL-4 and subsequently incubated with ibrutinib. Our results show a significant decrease of proliferation in the leukemic clone activated with CD40L+IL-4+ ibrutinib, whereas CLL cell survival appears to be not affected (Figure 4C, upper panels). Interestingly, proliferation decrease is accompanied by downregulation of AID at mRNA and protein levels (Figure 4C, lower panels). Concerning the MEC-1 cell line, our results shown that proliferation is not significantly affected by ibrutinib at 24, 48, 72, or 96 hours (Figure 4A, lower panel), whereas AID protein is increased, as it has been previously demonstrated by Compagno et al28 (Figure 4A,D).
IL-4 is a common origin of the 2 pathways (PI3K/AKT and JAK1) that appear to be modulated by ibrutinib in the PF CXCR4low/CD5high.53,55 After IL-4 stimulation, cytoplasmic STAT6 monomers are phosphorylated by JAK1 and JAK3,56,57 and the homodimers translocated to the nucleus57,58 with the consequent AID expression.51 To further investigate the role of ibrutinib and its effect on AID expression in proliferative CLL cells, we evaluated the phosphorylation status of the transcription factor STAT6 and AID expression in in vitro experiments after CD40L+IL-4 activation. Our results show that phosphorylation of STAT6 is diminished after in vitro activation of CD40L+IL-4 of CLL cells incubated with ibrutinib, and that dephosphorylation of Tyr641 is associated with decreased AID expression (Figure 4D). Interestingly, the MEC-1 cell line appears to be unable to phosphorylate Tyr641 of STAT6 after ibrutinib, independent of its expression (Figure 4D). Altogether, our results suggest that IL-4/JAK1/STAT6 could be the axis responsible for ibrutinib AID-downregulation in the leukemic clone, and that different regulation mechanisms could account for AID expression between MEC-1 cell line and CLL cells.
Discussion
CLL treatment has rapidly evolved over the last few years because of the increased availability and use of novel agents that target BCR signaling and other microenvironment-derived signals.2 Specifically, kinase inhibitors targeting the BCR-related kinases BTK and PI3Kδ, ibrutinib and idelalisib, are increasingly replacing chemotherapy-based treatment in patients with CLL.2,59 The key mechanism of action of these agents is to disrupt cross-talk between CLL cells and their supportive tissue microenvironment, which promote CLL cell survival and proliferation.60,61 One of the consequences of CLL cell microenvironment interactions is increased expression of the mutagenic enzyme AID in CLL cells,5,62 which remains restricted to the PFs of the leukemic clone.4,5,63 Our results confirm these data at protein level in CLL, showing that AID expression in peripheral blood of pretreated patients is either undetectable or only detected in a very low proportion (up to 2%) of the entire leukemic clone. In contrast, AID expression is readily detectable in a relatively large proportion of the CLL PFs defined as IgM+/IgG+ fraction (4%-10%) or CXCR4low/CD5high subset (12%-28%).
An intriguing set of recent preclinical data suggested that ibrutinib and idelalisib can increase AID expression in vitro.28 This observation had not been tested in human patients. Here, we analyzed serial CLL samples from patients receiving ibrutinib, finding that this therapy substantially reduced, rather than increased, AID expression in the PFs. Because we have to rely on flow cytometry to detect AID protein in the small PFs in patients with CLL, we validated our findings in vitro by AID immunoblotting detection using MEC-1 and primary CLL cells, treated with ibrutinib, or activated with CD40L/IL-4. In vitro treatment of MEC-1 cells with ibrutinib resulted in an increase in AID expression, as previously described.28 However, we were unable to detect AID upregulation by immunoblot or flow cytometry after ibrutinib treatment in primary CLL cell samples, despite AID being readily induced by CD40/IL4 stimulation. We cannot exclude the possibility of minimal changes in AID expression by ibrutinib below the detection level of our methods. To explore this, we performed quantitative PCR analyses evaluating AID expression changes in CLL cells expressing or not AICDA mRNA at baseline and treated or not with ibrutinib. qPCR data confirm that, in all cases, AICDA mRNA levels were not increased after ibrutinib treatment. Collectively, these results demonstrate that in primary CLL cells, AICDA mRNA and protein levels are not increased by ibrutinib treatment in vitro or in vivo and, on the contrary, are decreased in the PFs in ibrutinib-treated patients.
Ibrutinib also decreases CLL cell proliferation in vitro32,64 and in vivo.27 Accordingly, in this study, we demonstrate that ibrutinib therapy significantly decreases CLL PFs after 1 month of treatment, corroborating previous data from Herman et al.32 Knowing that proliferative differences should go hand in hand with molecular changes at the transcriptional and posttranscriptional levels, we interrogated the phosphorylation status of the PF CXCR4low/CD5high before and during ibrutinib treatment, focusing on the phosphorylation profile of AKT/PKB pathway. Our results uncover changes in p53 phosphorylation in the PF during treatment. Considering the importance of the TP53 gene function in the progression and refractoriness of CLL, this could be an interesting observation suggesting the relevance of posttranslational modifications of p53 in CLL after ibrutinib treatment. Furthermore, phospho-array analysis also shows that in the PF, the AKT1 and JAK1 proteins become dephosphorylated after treatment. The phosphorylated forms pAKT-Thr308 and pJAK1-Tyr1022/Tyr1023 are hallmarks of the PI3K/AKT and JAK1 pathway activation, respectively.40,41,65 These observations suggest a role for ibrutinib in the regulation of these 2 pathways in vivo and support our previous work postulating a key role of PI3K/AKT pathway in the generation and/or maintenance of the CLL IgM+/IgG+ PF.31 PI3K/AKT and JAK1 pathways are important drivers of cell proliferation and cell survival, most notably in cells that are responding to growth-factor-receptor engagement in tumor microenvironments.65,66 Interestingly, a common activation stimulus of these 2 axes is IL-4, which in synergism with CD40L are responsible to promote B-cell proliferation and activation of CSR to IgG1 and IgE immunoglobulins.53,67 The signal transduction used by IL-4 to activate B cells involves tyrosine phosphorylation of the IL-4 receptor and JAK1 and STAT6 proteins.68 IL-4 stimulation induces phosphorylation and nuclear translocation of the transcription factor STAT6, which in turn binds the 5′ upstream region of AID gene inducing optimal AID expression.51 Our results show that in CLL cells, phosphorylation of STAT6 is associated with AID expression after CD40L+IL-4 activation and suggest that the signaling IL-4/JAK/STAT could be involved in the origin of PFs and AID expression in the leukemic clone. In CLL, activated IL-4 pathway is a key microenvironment signal associated with disease progression that was recently proposed as an indirect target of ibrutinib therapy.69-71 Supporting this notion are recent data from Landau et al, who analyzed CLL transcriptome changes during ibrutinib treatment. Their results demonstrate downregulation of the JAK/STAT pathway, as well as different cytokines such as IL-4, IL-6, and IL-10.72 Altogether, these results suggest that reduction of both AID expression and PFs after ibrutinib treatment could have a common mechanistic basis, associated with changes in the phosphorylation status of IL4/JAK/STAT and AKT/PKB pathway.
Compagno et al reported that PI3Kδ inhibitors enhanced AID expression and AID off-target sites in CLL and mantle cell lymphoma cell lines.28 This work also described that patients with CLL treated with idelalisib showed increased somatic hypermutation in AID off-target genes. Interestingly, this was not the case for patient samples treated with ibrutinib (see Figure 4D in Stacchini et al30 ). Our work sheds some light on this difference by showing that, unlike what occurs in the MEC-1 cell line incubated with ibrutinib or with PI3Kδ inhibitors, in CLL cells analyzed either freshly from treated patients or after incubation with ibrutinib ex vivo, AID expression is in fact downregulated. Taking into account our results, this disparity could be explained by the fact that different activation pathways are involved in the regulation of AID expression. In CLL cells, ibrutinib appears to be responsible of AID diminution via IL-4/JAK/STAT6 pathway, whereas in the MEC-1 cell line, it does not appear to be the case. Moreover, there seems to be an additional difference between the effect to ibrutinib and idelalisib in patients with CLL regarding their ability to induce AID. This difference suggests that these 2 drugs may also differ in their potential to cause additional genomic instability, which should be considered when judging the possible collateral risks of these therapies. Despite the fact that our results propose that PFs and AID expression are downmodulated by ibrutinib via JAK/STAT6 axis, ibrutinib resistance in CLL has been vastly documented.73-75 Thus, additional axes other than AKT/PKB and JAK/STAT pathways might also be involved during disease progression in CLL. Finally, our results also suggest that although ibrutinib reduce PFs, it does not appear to seriously affect the viability of the CLL cells (Figure 4C and published data of Slinger et al44 ). On the basis of these data, we speculate that not all CLL cells within PFs undergo cell death during treatment with ibrutinib, and consequently, surviving subclones that persist over time can give rise to ibrutinib-refractory clones. Recent data by Primo et al,76 demonstrating that approximately 10% of cultured CLL cells still can proliferate in vitro in the presence of high ibrutinib concentrations, support this concept.
In summary, we demonstrate that AID expression and CLL PFs are diminished during ibrutinib therapy, both of which are desirable outcomes for this leukemia. This work also emphasizes the importance of the microenvironment signaling on the regulation of proliferating subsets and AID expression in CLL.
The online version of this article contains a data supplement.
The publication costs of this article were defrayed in part by page charge payment. Therefore, and solely to indicate this fact, this article is hereby marked “advertisement” in accordance with 18 USC section 1734.
Acknowledgments
This work was supported by grants from FMV 1_2014_104397 and a Leukemia & Lymphoma Society Scholar Award in Clinical Research (J.A.B.), the CLL Global Research Foundation (J.A.B.), and in part by the Anderson Cancer Center Support Grant CA016672. J.M.D.N. is a Chercheur Boursier Senior of the Fonds de Recherche du Québec.
Authorship
Contribution: J.A.B. and P.O. contributed conception and design: A.I.L., J.A.B., and P.O. provided of study materials and patients samples; P.E.M., M.S., A.U., N.S., and C.B. conducted the experiments; P.E.M., M.S., A.U., N.S., P.F., and P.O. contributed data analysis and interpretation; P.E.M., M.S., J.M.D.N., J.A.B., and P.O. contributed manuscript writing; and all authors read and approved the final manuscript.
Conflict-of-interest disclosure: J.A.B. has received research support from Gilead and Pharmacyclics. The remaining authors declare no competing financial interests.
The current affiliation for P.E.M. is CONICET-Universidad de Buenos Aires, Instituto de Inmunología, Genética y Metabolismo. Facultad de Farmacia y Bioquímica-Hospital de Clínicas “José de San Martín,” Buenos Aires, Argentina.
Correspondence: Pablo Oppezzo, Institut Pasteur de Montevideo, Research Laboratory on Chronic Lymphocytic Leukemia, Montevideo 11400, Uruguay; e-mail: poppezzo@pasteur.edu.uy; and Jan A. Burger, Department of Leukemia, The University of Texas MD Anderson Cancer Center, 1515 Holcombe Blvd, Houston, TX 77030; e-mail: jaburger@mdanderson.org.

This feature is available to Subscribers Only
Sign In or Create an Account Close Modal