

Key Points
A pilot trial evaluated stepwise reduction of ibrutinib dose in patients with CLL from 420 to 280 to 140 mg/d over three 28-day cycles.
BTK occupancy, signaling, and biomarker data show that a lower dose of ibrutinib after 1 full dose cycle is enough for biological activity.

Abstract
Ibrutinib is highly efficacious and used at 420 mg/d for treatment of chronic lymphocytic leukemia (CLL). We previously demonstrated a decline in Bruton’s tyrosine kinase (BTK) protein levels in CLL cells after 1 cycle of ibrutinib, suggesting ibrutinib dose could be lowered after the first cycle without loss of biological effect. To test this postulate, a pilot study (NCT02801578) was designed to systematically reduce ibrutinib dosing within the same patient with CLL over the course of three 28-day cycles. After an initial cycle of 420 mg/d, the dose was reduced to 280 mg/d in cycle 2, and then to 140 mg/d in cycle 3. Eleven patients began study treatment, and 9 completed the 3 cycles. Plasma and intracellular pharmacokinetics (PK), BTK occupancy, and pharmacodynamic (PD) response at different doses of ibrutinib were compared. Plasma and intracellular levels of ibrutinib were dose-dependent, and even the lowest dose was sufficient to occupy, on average, more than 95% of BTK protein. In concert, BTK downstream signaling inhibition was maintained with 140 mg/d ibrutinib in cycle 3, and there were comparable reductions in total and phospho-BTK (Tyr223) protein levels across 3 cycles. Reductions of plasma chemokine CCL3 and CCL4 levels, considered to be biomarkers of ibrutinib response, were similar during the 3 cycles. These PK/PD data demonstrate that after 1 cycle of ibrutinib at the standard 420 mg/d dose, the dose can be reduced without losing biological activity. Clinical efficacy of lower doses needs to be systematically evaluated. Such dose reductions would lower drug cost, lessen untoward toxicity, and facilitate rationale-based combinations. This trial was registered at www.clinicaltrials.gov as #NCT02801578.
Introduction
Ibrutinib (Imbruvica) has emerged as a leading targeted therapy for chronic lymphocytic leukemia (CLL) and is an approved agent for both previously untreated and relapsed/refractory disease. This oral drug covalently and irreversibly binds to the C481 residue of Bruton’s tyrosine kinase (BTK). The standard ibrutinib dose for CLL is 420 mg/d, which was selected from a phase 1 study of ibrutinib in patients with relapsed/refractory B-cell malignancies.1 Although ibrutinib is well tolerated, major bleeding and atrial fibrillation are observed in a significant minority of patients.2 Some of the cardiac effects of ibrutinib, as well as its inhibitory effects on platelet function, may stem from inhibition of kinases other than BTK, such as TEC.3-7 Importantly, the frequency of incident atrial fibrillation reported in the randomized controlled registration trials of ibrutinib (6.5%) markedly underestimates the frequency observed in unselected patients in a “real-world” setting (13% in a recent study of 582 patients).8,9 Furthermore, serious infections have been reported in patients receiving ibrutinib therapy,10-12 as well as potentially impaired responses to vaccines.13 Management of some of the most common toxicities includes treatment suspension and/or dose reduction.14 Intolerance and adverse events (AEs) are major causes of discontinuation of ibrutinib.15-18
In addition to the issues of safety and tolerability, the cost of ibrutinib in the United States exceeds $130 000 per year for patients with CLL.19,20 Furthermore, as complete remissions with ibrutinib are rare, either indefinite administration of the drug is needed, which compounds the “financial toxicity” that has profound individual and societal impact (reviewed in Bose et al21 ), or combination strategies with other agents are required, which further increases the potential for AEs. A recent analysis projected that the number of people living with CLL in the United States would increase by 55%, going from 128 000 in 2011 to 199 000 by 2025, as a result of improved survival in the era of targeted therapies.19 In parallel, the annual cost of CLL management would increase from $0.74 billion to $5.13 billion, representing a 590% increase. The per patient lifetime cost of CLL treatment would rise substantially, going from $147 000 to $604 000, as oral targeted therapies such as ibrutinib emerged as first-line treatments. Indeed, cost can affect treatment choice and has been recognized as a reason for ibrutinib discontinuation.18,22 Thus, lowering the dose of ibrutinib has clear potential to reduce the toxicities of ibrutinib, as well as the economic burden of CLL management. As mentioned before, the standard ibrutinib dose for CLL is 420 mg/d. Even though at least 97% BTK occupancy was achieved at the 2.5 mg/kg/d dose level, which roughly corresponds to 175 mg/d, in the phase 1 trial, a 420 mg/d dose was selected for CLL.1
In addition to occupancy data, BTK expression data in B cells provides further rationale for dose reduction. BTK expression is dynamically regulated during development of B cells and is high in marrow-derived murine B cells23 and in human normal and CLL B cells.24 In healthy murine B cells, BTK levels are maintained by B-cell receptor (BCR) pathway engagement, and BTK expression was increased after antigen-binding to immunoglobulin M+ murine B cells.23 In murine CLL B cells, BTK levels decrease after ibrutinib treatment,25 with the mechanism being inhibition of BCR signaling as well as disruption of CXCR4 recycling by ibrutinib. Importantly, a decline in BTK mRNA and protein levels was observed in CLL cells obtained from patients receiving ibrutinib therapy.26 The mechanism of BTK protein decline may reflect inhibition by ibrutinib of the activity of NF-κB, which is a known transcription factor for BTK and binds to its promoter region.27
On the basis of these investigations of normal and CLL B cells in both murine and human systems, we hypothesized that BTK protein levels would be reduced during the second and subsequent cycles after 1 cycle of prescribed 420 mg/d ibrutinib. Because this covalent inhibitor and the BTK protein require a 1:1 stoichiometric ratio, the ibrutinib dose could be lowered as levels of its target, BTK, declined. Lower doses would also result in decreased levels of free drug in plasma and reduced binding to off-target kinases, potentially resulting in decreased incidence of AEs such as atrial fibrillation and bleeding manifestations. To test our hypotheses, a pilot protocol (NCT02801578) with pharmacokinetic (PK) and pharmacodynamic (PD) end points was designed for patients with CLL to systematically evaluate progressively lower doses of ibrutinib within the same individuals over the course of three 28-day cycles. This pilot study was focused on biological and molecular end points and did not include formal clinical response evaluation using imaging and bone marrow examination.
Methods
Adults with CLL and absolute lymphocyte counts of at least 20 × 109/L who were candidates for ibrutinib therapy were eligible for the study, which initially planned to accrue 12 patients. The patient characteristics are shown in Table 1. None of the patients had deletion of 11q or 17p; however, this occurred purely by chance. The somatic hypermutation status of the IGHV gene was unmutated in 1 patient who completed the study and unknown in 2 others, with the remaining patients having mutated IGHV.
Characteristics of the 11 patients with CLL enrolled in the 12-week pilot trial, along with dosing changes and poststudy dose
| Patient no. | Age/sex | Years since diagnosis | Prior therapies | WBC ×103/μL | ALC ×103/μL | IGHV status | FISH | IBR dosed per protocol? | Poststudy IBR dose (mg/d) |
|---|---|---|---|---|---|---|---|---|---|
| 1 | 69/F | 9 | 1 | 33 | 29 | Unknown | Trisomy 12 | Yes | 140 |
| 2 | 68/F | 8 | 0 | 64 | 55 | Mutated | Del13q | Yes | 140* |
| 3 | 68/F | 7 | 0 | 179 | 173 | Mutated | Del13q | Yes | 140 |
| 4 | 56/M | 20 | 3 | 29 | 24 | Mutated | Del13q, trisomy 12 | Yes | 140 |
| 5 | 74/F | 11 | 1 | 53 | 49 | Unmutated | Trisomy 12 | Yes | 140 q.o.d. |
| 6 | 67/M | 2 | 0 | 153 | 130 | Unmutated | Normal | † | 140 |
| 7 | 53/F | 2 | 0 | 33 | 28 | Mutated | Normal | ‡ | 420 |
| 8 | 73/M | 8 | 1 | 67 | 61 | Mutated | Del13q, trisomy 12 | Yes | 140, 280¶ |
| 9 | 79/M | 17 | 4 | 71 | 62 | Mutated | Del13q | Yes | 140 |
| 10 | 79/F | 10 | 1 | 34 | 31 | Mutated | Del13q | § | — |
| 11 | 52/M | 13 | 2 | 45 | 41 | Mutated | Del13q, trisomy 12 | Yes | 140 |
ALC, absolute lymphocyte count; F, female; FISH, fluorescent in-situ hybridization; IBR, ibrutinib; M, male; WBC, white blood cells.
Patient continued 140 mg/d IBR for 6 months and then switched to a different therapy because of fatigue.
Discontinued on C1D28 because of the need for surgery to repair an abdominal aortic aneurysm.
Patient dose was increased to 420 mg/d because of joint pain and swelling on C3D8.
Patient continued 140 mg/d IBR for 14 months, and then the dose of IBR was increased to 280 mg/d by the treating physician.
Patient experienced IBR intolerance (headaches, arthralgias, myalgias, and weakness) in C1 and treatment was suspended for 7 days and then resumed at 280 mg/d in C2, during which time treatment was suspended again because of intolerance that responded slightly to holding of the drug, prompting her physician to discontinue IBR and take her off the study on C2D28.
Patients received the currently prescribed dose of 420 mg/d ibrutinib in the first cycle, then 280 mg/d in the second cycle, followed by further reduction to a single 140 mg capsule/d in the third cycle. Blood was collected at 16 scheduled times for PK and PD analyses (Figure 1A), which were based on those used during phase 1 and 2 investigations that were instrumental in defining the dose and schedule of ibrutinib.1,28
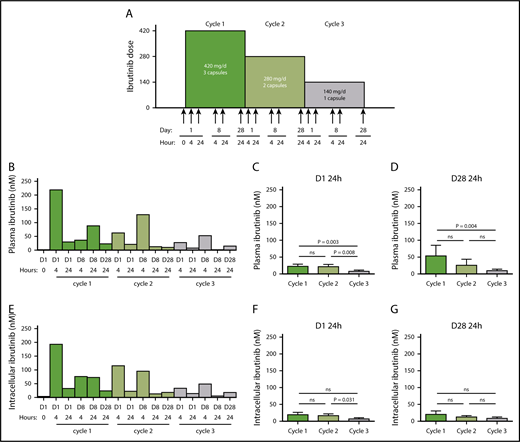
Ibrutinib protocol design and PK and PD at 3 doses of ibrutinib. (A) Clinical protocol design for the systematic reduction of ibrutinib dosing in patients with CLL over the course of three 28-day cycles, from 420 to 280 mg/d and then to 140 mg/d. Peripheral blood samples were collected from each patient at the indicated times (arrows). (B-G) Plasma and cellular pharmacology of ibrutinib over the course of 3 cycles of treatment with ibrutinib at 420 mg/d (green), 280 mg/d (light green) and 140 mg/d (gray). (B) Ibrutinib plasma levels in a representative patient with CLL (patient 2) over the course of 3 cycles of treatment. (C-D) Mean plasma ibrutinib levels (n = 8) on (C) D1 24 hours and (D) D28 24 hours. (E) Intracellular ibrutinib levels in a representative patient with CLL (patient 2) over the course of 3 cycles of treatment. Mean intracellular ibrutinib level (n = 6) on (F) D1 24 hours, (G) D28 24 hours, as measured by high-performance liquid chromatography-MS. Error bars represent standard errors of the mean (SEMs). Paired comparisons were performed using 2-sided Wilcoxon signed rank test. ns, not significant.
Ibrutinib protocol design and PK and PD at 3 doses of ibrutinib. (A) Clinical protocol design for the systematic reduction of ibrutinib dosing in patients with CLL over the course of three 28-day cycles, from 420 to 280 mg/d and then to 140 mg/d. Peripheral blood samples were collected from each patient at the indicated times (arrows). (B-G) Plasma and cellular pharmacology of ibrutinib over the course of 3 cycles of treatment with ibrutinib at 420 mg/d (green), 280 mg/d (light green) and 140 mg/d (gray). (B) Ibrutinib plasma levels in a representative patient with CLL (patient 2) over the course of 3 cycles of treatment. (C-D) Mean plasma ibrutinib levels (n = 8) on (C) D1 24 hours and (D) D28 24 hours. (E) Intracellular ibrutinib levels in a representative patient with CLL (patient 2) over the course of 3 cycles of treatment. Mean intracellular ibrutinib level (n = 6) on (F) D1 24 hours, (G) D28 24 hours, as measured by high-performance liquid chromatography-MS. Error bars represent standard errors of the mean (SEMs). Paired comparisons were performed using 2-sided Wilcoxon signed rank test. ns, not significant.
We hypothesized that lowering the dose of ibrutinib after an initial cycle at 420 mg/d would preserve the PD effects relevant to its mechanism of action in CLL, as well as reduce its inhibition of platelet function. Mechanistic investigation included evaluation of BTK occupancy, inhibition of downstream signaling including NF-κB, and suppression of the CCL3 and CCL4 chemokine levels. All patients provided written informed consent to participate in the clinical trial and accompanying laboratory correlative studies. The clinical trial was approved by the Institutional Review Board of the MD Anderson Cancer Center and was conducted in accordance with the Declaration of Helsinki. The choice of therapy after study completion was left to the discretion of the treating physician.
Sample size considerations
This was based on phase 1 study and PK/PD variations among individuals and is described in the supplemental Material, available on the Blood Web site.
Peripheral blood collection
For the isolation of plasma and white blood cells, blood from patients was collected from patients into Vacutainer glass green top tubes (Becton Dickinson). The tubes were centrifuged to isolate the plasma, and the remaining blood was processed immediately by Ficoll-Hypaque density gradient separation, as described.29 The peripheral blood mononuclear cells (PBMCs) were isolated and washed twice with phosphate-buffered saline, and the cell number and cell volume were determined using a Coulter Channelyzer (Coulter Electronics). For platelet function analysis, blood was collected into Vacutainer glass yellow top tubes and kept at ambient temperature until processing (within 2 hours of collection).
Clinical laboratory end points
Determination of IGHV gene mutation status and ZAP-70 analyses were performed as described.30 Conventional karyotyping and fluorescence in situ hybridization were performed by the clinical cytogenetics laboratory, Department of Hematopathology, MD Anderson Cancer Center. Detailed methodology for the fluorescence in situ hybridization assay has been published.31
Measurement of ibrutinib levels in plasma and white blood cells
Levels of ibrutinib were measured using a validated liquid chromatography-tandem mass spectrometry (LC-MS/MS) method. Briefly, plasma aliquots were precipitated with acetonitrile and then further diluted with 1 volume of 50% acetonitrile/water. LC-MS/MS analysis was conducted on a Waters Acquity ultraperformance liquid chromatography system coupled with a Waters Xevo TQ-S triple quadrupole mass spectrometer operated at positive mode. Ibrutinib was separated using a Waters Acquity ultraperformance liquid chromatography BEH C18 column, detected by a multiple reaction monitoring transition, and the method was validated with an analytical range of 5 to 5000 nM ibrutinib in untreated human plasma. The cell extracts were analyzed using the same method, with the calibration standards prepared in 50% acetonitrile/water.
BTK occupancy assay
Covalent inhibition of BTK protein by ibrutinib was measured by Pharmacyclics LLC (an AbbVie company), using an enzyme-linked immunosorbent assay-based BTK occupancy assay in PBMCs. The results are the means of duplicate analyses.
Measurement of chemokine levels
Plasma CCL3 (Mip-1α) and CCL4 (Mip-1β) levels were quantitated using Quantikine enzyme-linked immunosorbent assay immunoassays (R&D Systems). Absorbance was measured at 450 nm, using a microplate reader (Powerwave XSBioTek Instruments). The results are presented as the means of duplicate analyses in picograms per milliliter.
Protein and gene expression analysis
Total protein lysates or RNA extracts were prepared from CLL cells and analyzed as described in the supplemental Material.29
Platelet function analysis
Platelet-rich plasma and platelet-poor plasma were separated from whole blood by centrifugation at room temperature and used as a light transmission control. Platelet aggregation in response to ristocetin (1.5 mg/mL), adenosine diphosphate (ADP; 20 μM), and collagen (0.19 mg/mL) were measured using an aggregometer at 37°C for 6 min.
Statistical analysis
Summary statistics were provided in the form of frequency and percentages for categorical data, and continuous variables were summarized using mean, SD, and median with range. Bar charts depicting the mean, summarizing a continuous numeric measurement, were presented for different assessment points. The change in measured values (eg, PK parameters) at different cycle points was evaluated using the Wilcoxon signed rank test. All tests were 2-sided, and P < .05 was considered statistically significant. Statistical analysis was carried out using SAS version 9.4 (SAS Institute, Cary, NC).
Results
The plasma kinetics of ibrutinib were similar at the 3 doses, with peaks during the early hours after oral administration and troughs at 24 hours and dose proportional (Patient 2, Figure 1B). Plasma levels, dose dependence, and elimination profile were similar to what has been described previously.1 Cumulative data obtained from 9 patients 24 hours after drug intake showed that mean ibrutinib plasma levels of 22, 22, and 8 nM were achieved during cycles 1, 2, and 3, respectively (Figure 1C). The levels in cycle 3, 24 hours after the day 1 dose, were significantly different than at the corresponding points during cycles 2 and 1. On D28, the mean plasma ibrutinib levels at 24 hours were similar to those on D1, suggesting steady-state concentrations, reaching 54 nM in cycle 1 and then dropping to 26 nM in cycle 2 and to 10 nM in cycle 3 (Figure 1D), which was significantly lower in cycle 3. Intracellular ibrutinib levels and kinetics mirrored the plasma profile (Patient 2, Figure 1B,E). Mean intracellular ibrutinib levels in CLL cells were 20 nM or less 24 hours postdosing on D1 and D28 (Figure 1F-G), and were significantly higher than the corresponding points in cycles 2 and 3. Our cycle 1 PK results were similar to the reported steady-state concentrations of ibrutinib in patients with CLL in the phase 1/2 trial reported by Byrd et al.32 At the lowest dose in cycle 3, at D1 4 hours, the mean ibrutinib levels in plasma and CLL cells were only 60 and approximately 40 nM, respectively; hence, we sought to determine BTK occupancy.
Ibrutinib inactivates BTK protein by irreversibly binding to the residue Cys481,1,33 and this BTK occupancy in PBMCs reflects drug activity. Our results demonstrated that the lowest (140 mg/d) dose in cycle 3 was still sufficient to occupy almost all BTK molecules. In a representative patient, BTK occupancy was higher than 98% in all 16 samples collected over the course of the 3 cycles (Patient 2, Figure 2A). The results were similar in the 7 additional patients (supplemental Figure 1A-H; n = 8), and the mean BTK occupancy was above 97% on D1 (Figure 2B-C) and D28 (Figure 2D) of each cycle. Except for the D28 value in cycle 3, BTK occupancy was not statistically different over the course of the 3 cycles. Of the 8 patients in whom BTK occupancy was evaluated, there was only 1 sample from patient 8 in which occupancy was less than 97% (supplemental Figure 1G). These data clearly demonstrate that the 280 or 140 mg/d dose, preceded by a cycle at the currently prescribed dose of 420 mg/d, is sufficient to bind to almost all the BTK in circulating PBMCs. It follows that the resultant reduction of free plasma ibrutinib levels could reduce the inhibition of off-target proteins.34
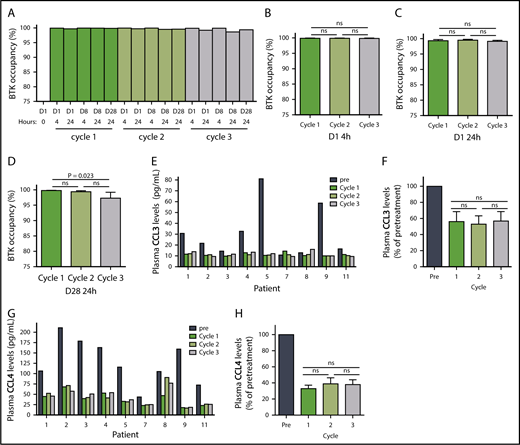
Pharmacodynamic evaluation of reduced doses of ibrutinib. (A) BTK occupancy in a representative patient with CLL (patient 2) over the course of 3 cycles of treatment with ibrutinib at doses of 420 mg/d (dark blue), 280 mg/d (medium blue), and 140 mg/d (light blue). Mean percentages of BTK occupancy in patients (n = 8) on (B) D1 4 hours, (C) D1 24 hours, (D) D28 24 hours. Error bars represent SEMs. (E) CCL3 levels in patients with CLL over the course of 3 cycles of ibrutinib treatment. (F) Mean decrease in CCL3 levels in patients (n = 9). (G) CCL4 levels over the course of 3 cycles of ibrutinib treatment. (H) Mean decrease in CCL4 levels in patients (n = 9). Error bars represent SEMs. Paired comparisons were performed using 2-sided Wilcoxon signed rank test. ns, not significant.
Pharmacodynamic evaluation of reduced doses of ibrutinib. (A) BTK occupancy in a representative patient with CLL (patient 2) over the course of 3 cycles of treatment with ibrutinib at doses of 420 mg/d (dark blue), 280 mg/d (medium blue), and 140 mg/d (light blue). Mean percentages of BTK occupancy in patients (n = 8) on (B) D1 4 hours, (C) D1 24 hours, (D) D28 24 hours. Error bars represent SEMs. (E) CCL3 levels in patients with CLL over the course of 3 cycles of ibrutinib treatment. (F) Mean decrease in CCL3 levels in patients (n = 9). (G) CCL4 levels over the course of 3 cycles of ibrutinib treatment. (H) Mean decrease in CCL4 levels in patients (n = 9). Error bars represent SEMs. Paired comparisons were performed using 2-sided Wilcoxon signed rank test. ns, not significant.
BCR engagement induces plasma CCL3 and CCL4 chemokine expression,35 which are considered markers of disease progression in CLL.36 As a corollary, decreases in CCL3 and CCL4 levels are considered biomarkers for response to ibrutinib.37,38 The median plasma concentrations of CCL3 and CCL4 in pretreatment CLL cells were 22 pg/mL (range, 11-81 pg/mL) and 116 pg/mL (range, 44-211 pg/mL), respectively (Figure 2E,G; n = 9). During all 3 cycles of ibrutinib therapy, the declines in plasma CCL3 and CCL4 concentrations were similar, with CCL3 levels averaging 53% to 57% of pretreatment levels (Figure 2F; n = 9) and CCL4 levels averaging 33% to 39% of pretreatment levels (Figure 2H; n = 9). These were consistent with published values,37 and the difference between cycles was not statistically significant. These data suggest that the 140 mg/d dose of ibrutinib is sufficient to maintain the abrogation of BCR pathway-mediated chemokine induction. Interestingly, irrespective of the dose, there was a greater relative decline in CCL3 and CCL4 in patients with higher baseline pretreatment levels (supplemental Figure 2A-D; n = 9).
Immunoblot analysis of cellular proteins in the BCR pathway in CLL cells isolated from patients during therapy is a standard method used to determine inhibition of BCR signaling (Figure 3A,C). The levels of phosphorylated BTK (Tyr223) in CLL cells were similar in all 3 cycles, declining to approximately 35% of pretreatment levels (n = 6), consistent with prior reports.29 There was also a decline in total BTK protein levels, and the mean was approximately 75% of pretreatment levels in cycles 1 and 2 and approximately 65% of the pretreatment level in cycle 3. There was a reduction of the BTK downstream target, PLCγ2 (Tyr1217), phosphoprotein levels to approximately 70% of pretreatment levels in cycles 1 and 2, and approximately 56% of the pretreatment level in cycle 3, whereas the total PLCγ2 levels remained unchanged (Figure 3A,C).
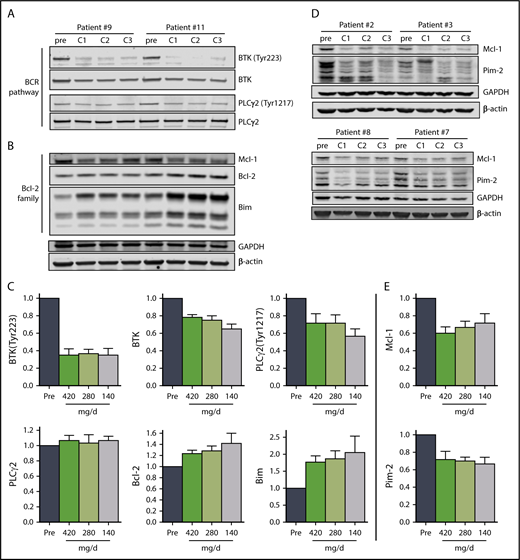
The effect of ibrutinib on BCR pathway and Bcl-2 family proteins during 3 doses of ibrutinib. Immunoblot analyses of (A) BCR pathway proteins and (B) Bcl-2 family proteins in CLL cells from patients 9 and 11 on D28 of each cycle. (C) Mean levels (n = 6) of the proteins shown in (A) and (B) normalized to both β-actin and glyceraldehyde-3-phosphate dehydrogenase (GAPDH) averaged and then expressed relative to pretreatment levels. The data are the means of the 2 values; error bars represent SEMs. (D) Immunoblot analyses of early-response gene proteins. Note: the images of these immunoblots are from the same gels shown in supplemental Figure 4A; thus, the GAPDH and β-actin loading controls are the same. (E) Mean levels (n = 4) of the proteins shown in (D) normalized to both β-actin and GAPDH averaged and then expressed relative to pretreatment levels. The data are the means of the two values; error bars represent SEMs.
The effect of ibrutinib on BCR pathway and Bcl-2 family proteins during 3 doses of ibrutinib. Immunoblot analyses of (A) BCR pathway proteins and (B) Bcl-2 family proteins in CLL cells from patients 9 and 11 on D28 of each cycle. (C) Mean levels (n = 6) of the proteins shown in (A) and (B) normalized to both β-actin and glyceraldehyde-3-phosphate dehydrogenase (GAPDH) averaged and then expressed relative to pretreatment levels. The data are the means of the 2 values; error bars represent SEMs. (D) Immunoblot analyses of early-response gene proteins. Note: the images of these immunoblots are from the same gels shown in supplemental Figure 4A; thus, the GAPDH and β-actin loading controls are the same. (E) Mean levels (n = 4) of the proteins shown in (D) normalized to both β-actin and GAPDH averaged and then expressed relative to pretreatment levels. The data are the means of the two values; error bars represent SEMs.
Previously, BCR pathway inhibitors have been shown to increase Bim and Bcl-2 with a decline in myeloid cell leukemia 1 protein levels in cells treated in vitro39 and during therapy.40-44 Alterations in the levels of Bcl-2 family proteins observed also support our conclusion that ibrutinib at 140 mg/d results in similar molecular changes as the full 420 mg/d dose. Proapoptotic Bim protein levels increased with each cycle in all patients evaluated, and were just under 2-fold of pretreatment levels in cycles 1 and 2, and approximately 2.4-fold of pretreatment levels after cycle 3, with a more pronounced increase in the BimEL isoform (Figure 3B-C; n = 6). Similarly, anti-apoptotic Bcl-2 levels increased with each successive cycle, reaching approximately 1.6-fold of the pretreatment level after cycle 3 (Figure 3B-C; n = 6). In addition, the levels of anti-apoptotic myeloid cell leukemia 1 protein decreased to 60% to 70% of pretreatment levels across the 3 cycles (Figure 3B,D-E; n = 6). Blocking BTK enzymatic activity results in reduced synthesis of Pim-1 in murine models,25 but in patients, Pim-2 rather than Pim-1 protein levels were reduced to approximately 70% of pretreatment levels over the course of the 3 cycles (Figure 3D-E; supplemental Figure 3).
In addition to attenuation of BCR signaling, mitigation of NF-κB signaling in CLL cells also contributes to ibrutinib mechanism of action.45 Our data suggest that the 140 mg/d dose in cycle 3 results in sustained inhibition of NF-κB signaling. The mean IκBα levels were between 1.7 and 2 times the pretreatment levels over the course of the 3 cycles (Figure 4A-B). In parallel, NFAT1 and SHP-1 levels decreased to varying degrees over the course of the 3 cycles (Figure 4A-B), but the decline in phosphorylation of RelA/p65 (Ser536) in 2 patients was variable (supplemental Figure 4A-B).
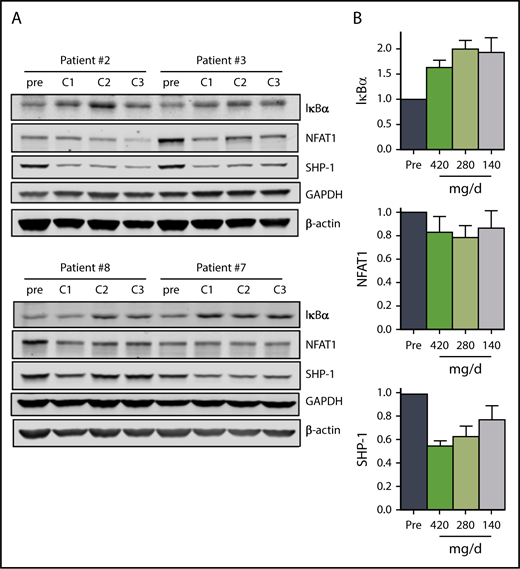
The effect of ibrutinib on NF-κB pathway during 3 doses of ibrutinib. Immunoblot analyses of (A) NF-κB pathway proteins in CLL cells from patients 2, 3, 7, and 8 on D28 of each cycle. (B) Mean levels (n = 4) of the proteins shown in (A). Protein levels were normalized to both β-actin and GAPDH, averaged and then expressed relative to pretreatment levels. Error bars represent SEMs.
The effect of ibrutinib on NF-κB pathway during 3 doses of ibrutinib. Immunoblot analyses of (A) NF-κB pathway proteins in CLL cells from patients 2, 3, 7, and 8 on D28 of each cycle. (B) Mean levels (n = 4) of the proteins shown in (A). Protein levels were normalized to both β-actin and GAPDH, averaged and then expressed relative to pretreatment levels. Error bars represent SEMs.
BCR engagement results in activation of a number of transcription factors including NF-κB, NFAT, c-Myc, and c-Jun (reviewed in Woyach et al46 ); thus, we assessed the effect of BCR signaling inhibition on the levels of total RNA levels and specific mRNA transcripts. The amount of RNA isolated from patients’ cells was on average 78%, 68%, and 60% of pretreatment levels after cycles 1, 2, and 3, respectively (Figure 5A; n = 6). BTK transcript levels declined substantially to approximately 50% of pretreatment levels after cycle 1, and remained at an average of 70% of pretreatment levels after cycle 3 (Figure 5B; n = 6). There was also a decline in MCL-1 and PIM-2 transcript levels (Figure 5C-D; n = 6).
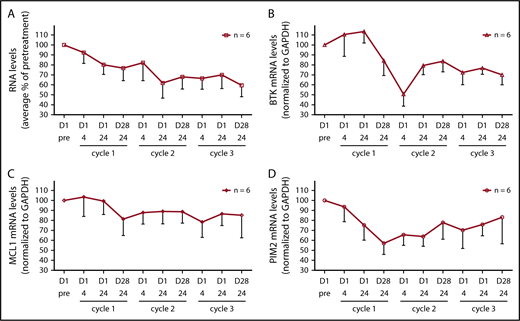
Effect of ibrutinib treatment on total RNA and specific mRNA transcript levels during dose reductions over the course of 3 cycles. (A) Total RNA levels in CLL cells from patients (n = 6) during therapy and normalized by cell number. The RNA levels are expressed as percentages of pretreatment RNA levels in CLL cells before the start of therapy in the same patient ± SEMs. (B-D) Transcript levels of (B) BTK, (C) MCL-1, and (D) PIM2 were measured using real-time reverse transcription polymerase chain reaction and normalized using GAPDH as an internal standard. The results are expressed as percentages of the gene expression levels in CLL cells from patients (n = 6) before the start of therapy and represent the means of triplicate experiments for each patient ± SEMs.
Effect of ibrutinib treatment on total RNA and specific mRNA transcript levels during dose reductions over the course of 3 cycles. (A) Total RNA levels in CLL cells from patients (n = 6) during therapy and normalized by cell number. The RNA levels are expressed as percentages of pretreatment RNA levels in CLL cells before the start of therapy in the same patient ± SEMs. (B-D) Transcript levels of (B) BTK, (C) MCL-1, and (D) PIM2 were measured using real-time reverse transcription polymerase chain reaction and normalized using GAPDH as an internal standard. The results are expressed as percentages of the gene expression levels in CLL cells from patients (n = 6) before the start of therapy and represent the means of triplicate experiments for each patient ± SEMs.
Approximately one-half of patients receiving ibrutinib have some degree of bruising and bleeding resulting from impaired platelet function.47-50 The protocol was amended after most patients had initiated therapy to enable measurement of the effects of changes in ibrutinib dose on platelet function (Figure 6A-D). Platelet-rich plasma was isolated from blood samples from 2 patients before therapy and at 24 hours after drug intake on D1 of each cycle, and stimulated with platelet agonists such as ADP (20 μM) or ristocetin (1.5 mg/mL). Both patients had greater platelet aggregation in cycles 2 and 3 than in cycle 1 after ADP (Figure 6A-B) or ristocetin (Figure 6C-D) stimulation. These data suggest that inhibition of platelet function at the standard 420 mg/d dose of ibrutinib may be diminished at the lower doses of 280 and 140 mg/d after 1 cycle at the full dose.
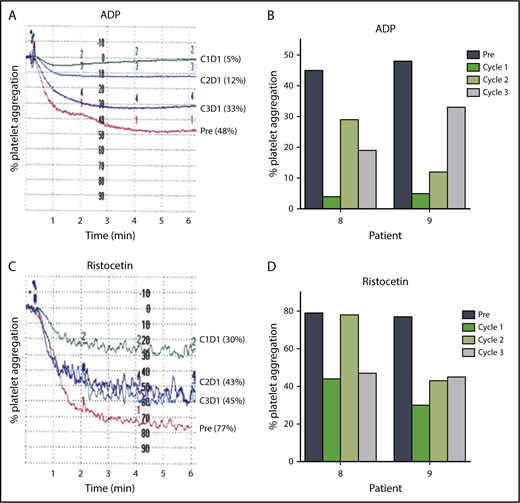
Lower doses in cycles 2 and 3 reduce inhibition of platelet function by ibrutinib. Platelet aggregation in platelet-rich plasma isolated from patients before and during ibrutinib therapy was measured by light transmission aggregometry after stimulation with 20 μM ADP in (A) patient 9 and (B) patients 8 and 9; or 1.5 mg/mL ristocetin in (C) patient 9 and (D) patients 8 and 9 before the start of therapy and on D1 24 hours of each cycle.
Lower doses in cycles 2 and 3 reduce inhibition of platelet function by ibrutinib. Platelet aggregation in platelet-rich plasma isolated from patients before and during ibrutinib therapy was measured by light transmission aggregometry after stimulation with 20 μM ADP in (A) patient 9 and (B) patients 8 and 9; or 1.5 mg/mL ristocetin in (C) patient 9 and (D) patients 8 and 9 before the start of therapy and on D1 24 hours of each cycle.
Redistribution lymphocytosis is a common feature of ibrutinib therapy, and the patients in this study had variable degrees of “redistribution lymphocytosis” during the 3 cycles (supplemental Figure 5A-B). Of the 11 patients who enrolled in the trial, 9 completed all 3 cycles and 2 patients discontinued the study. Patient 6 came off-study because of the need for surgery, and patient 10 discontinued because of intolerance (Table 1). In 2 patients, the dose of ibrutinib was increased by the treating physician, after 14 months in patient 8, to 280 mg/d, and to 420 mg/d in patient 7 on C3D8 because of arthralgia and joint swelling attributed to her CLL. All but 2 of the 11 patients that enrolled continued receiving ibrutinib after study completion (Table 1), and of those 9 patients, 8 were maintained at a dose lower than the standard 420 mg/d.
Discussion
The genesis of this project was based on 2 premises. First, during the phase 1 trial of ibrutinib, lower doses (2.5 and 5 mg/kg) resulted in similar BTK occupancy to the highest dose tested (12.5 mg/kg).1 Second, 1 cycle of full-dose ibrutinib resulted in a decline in BTK transcript and protein levels.26 The data from this pilot study demonstrate that lowered doses after 1 cycle at the standard 420 mg/d dose result in similar biological and molecular consequences in CLL cells as the standard dose. Such observations underscore a need for clinical evaluation of lower doses of ibrutinib.
Although we are planning to assess dose lowering of ibrutinib in a prospective clinical trial, several lines of evidence suggest that two-thirds or one-third the dose after 1 or more cycles at the standard dose would be clinically efficacious. For example, similar response rates were observed during phase 1 testing of ibrutinib across doses ranging from 2.5 to 12.5 mg/kg/d,1 suggesting that lower ibrutinib doses are as effective as the standard 420 mg/d dose, as long as a sufficient level of BTK occupancy is maintained.28
Real-world experiences with ibrutinib further support this notion. A US multicenter retrospective analysis of 197 patients with CLL during a 5-year period found that reducing the ibrutinib dose did not affect progression-free survival (PFS) or overall survival (OS).51 The UK CLL forum reported similar findings in 26% of 315 patients in whom dose reduction was required. The disease-free survival (90% for both) and the OS (90% vs 92%) were similar in the reduced-dose and standard-dose cohorts.52 Likewise, a study in Sweden reported no difference in PFS or OS between patients who had ibrutinib dose reductions lasting longer than 3 months and patients whose dose was not changed, or was only briefly reduced.53 Furthermore, reducing the ibrutinib dose, mainly because of AEs, did not negatively affect outcome in 165 patients in a Polish study.54 Our trial data are in line with these reports, and after 1 year poststudy, 8 of 9 patients have been maintained at ibrutinib doses lower than 420 mg/d, with 7 being at 140 mg/d and 1 at 280 mg/d. Collectively, these real-world studies demonstrate that globally, ibrutinib intolerance results in dose reduction by physicians and patients without negatively affecting PFS and OS. It is important to note that although dose reduction appears not to have a deleterious effect on OS and PFS, drug interruptions for more than 8 days affect clinical outcomes adversely.51-55 Ibrutinib-bound BTK is irreversibly inactive; however, longer interruptions may likely result in new synthesis of BTK protein not bound by ibrutinib. In addition, maintaining the initial cycle at 420 mg/d appears to be critical, as a recent report indicated that starting at doses less than 420 mg/d resulted in inferior PFS.56 Present data concur with this observation, as starting with full-dose ibrutinib results in almost complete (>98%) occupancy, which will be maintained as a result of covalent binding. During subsequent cycles, reduced doses may be sufficient to bind to any newly synthesized BTK molecules. In contrast, starting at a reduced dose may not provide enough drug to neutralize cellular BTK.
Our results provide the scientific basis for these equivalent survival outcomes at lower doses of ibrutinib. This pilot study concentrated only on CLL, and because ibrutinib is also approved for other malignancies such as mantle cell lymphoma and Waldenstrom macroglobulinemia, as well as for chronic graft versus host disease, our results may also be relevant in those settings. Lower doses may mitigate AEs in patients taking ibrutinib, reduce the financial burden associated with treatment, and provide more avenues for laboratory-based rational combination strategies.
Our study does have several limitations. The small sample size and short follow-up, as well as the lack of a comparator group treated at 420 mg/d, continuously preclude extrapolation of our findings to the clinic. Without such a comparator, it is also not discernable whether the decline in the levels of CCL3 and CCL4 in cycles 2 and 3 in our study would be different in patients treated continuously with standard 420 mg/d. In addition, CCL3/CCL4 levels during 3 contiguous cycles of standard dose ibrutinib were not reported in the studies published, rendering it challenging to compare our results with those of other studies. Further, because patients with higher-risk genomic characteristics were not evaluated in this study, it is unknown whether the results are generalizable to this subset of patients with CLL.
The current study assessed the PD of ibrutinib in CLL cells from blood and not from lymph nodes. Although intercompartmental differences in BTK occupancy and other PD parameters are possible, the currently recommended dose of ibrutinib is also based, apart from clinical efficacy, on PD assessments performed on peripheral blood.1,28 Further, BTK occupancy with ibrutinib in lymph node-resident CLL cells (n = 6 patients)45 were similar, as previously reported in peripheral blood CLL cells.1,28
Although there is no evidence for this, it could be speculated that lowering the ibrutinib dose could facilitate the development of resistance. However, the 2 most well-established mechanisms (mutations in BTK and PLCγ2) for the emergence of resistance to ibrutinib in CLL would not support this notion. Cys481 mutations in BTK that impair ibrutinib covalent binding are not detected in ibrutinib-naive CLL,57 suggesting that mutation is acquired during ibrutinib therapy. Also, this occurs not only with standard dose of 420 mg/d but also at 560 and even 840 mg/d ibrutinib.58 Regarding PLCγ2 activating mutations, ibrutinib dose, in principle, should not have an effect, as this is downstream of BTK.
In conclusion, the current PK/PD investigations establish that after 1 cycle at the prescribed 420 mg/d dose, ibrutinib dose can be reduced in subsequent cycles without loss of biological activity. A larger, more comprehensive study with clinical end points including formal response assessments as well as PK/PD investigations and lymph node biopsies in consenting patients is planned, and is needed before ibrutinib dose reduction after 1 cycle at 420 mg/d can be considered the standard of care for patients with CLL.
The online version of this article contains a data supplement.
The publication costs of this article were defrayed in part by page charge payment. Therefore, and solely to indicate this fact, this article is hereby marked “advertisement” in accordance with 18 USC section 1734.
Acknowledgments
The authors are thankful to Pharmacyclics for analyzing samples for BTK occupancy assays.
This work was funded by the Anderson CLL moonshot program. Core facilities were used for this project and are funded by Anderson Cancer Center Support Grant P30 CA016672, from the National Institutes of Health.
Authorship
Contribution: L.S.C. coordinated the collection of patient samples and their distribution for PK/PD evaluations, processed all samples, conducted experiments, analyzed data, and wrote the manuscript; P.B. participated in the design of and wrote the clinical protocol, directed the conduct of the study, identified patients, and wrote portions of the manuscript; N.D.C. discussed the clinical study with patients and coordinated sample collection; Y.J. and Q.W. quantitated plasma and intracellular ibrutinib levels and analyzed the data; S.F. conducted platelet functionality experiments and analyzed the data. M.H.K. directed S.F. and analyzed the platelet functionality data; W.Q. and X.H. performed statistical analysis; P.A.T., N.J., and W.G.W. identified patients and provided intellectual input into the design and conduct of the clinical trial; M.J.K. designed the protocol, identified most patients, and critically revised the manuscript for important intellectual content; and V.G. conceived the project, obtained funding, analyzed data, and critically revised the manuscript.
Conflict-of-interest disclosure: V.G., N.J., P.A.T., and W.G.W. have received research funding from Pharmacyclics for previous investigations. The remaining authors declare no competing financial interests.
Correspondence: Varsha Gandhi, Department of Experimental Therapeutics, The University of Texas MD Anderson Cancer Center, Unit 1950, P.O. Box 301429, Houston, TX 77230-1429; e-mail: vgandhi@mdanderson.org.

This feature is available to Subscribers Only
Sign In or Create an Account Close Modal