

Key Points
FPN on erythroid cells contributes a significant amount of iron to the blood.
FPN deficiency predisposes RBCs to oxidative injury.

Abstract
Ferroportin (FPN), the only known vertebrate iron exporter, transports iron from intestinal, splenic, and hepatic cells into the blood to provide iron to other tissues and cells in vivo. Most of the circulating iron is consumed by erythroid cells to synthesize hemoglobin. Here we found that erythroid cells not only consumed large amounts of iron, but also returned significant amounts of iron to the blood. Erythroblast-specific Fpn knockout (Fpn KO) mice developed lower serum iron levels in conjunction with tissue iron overload and increased FPN expression in spleen and liver without changing hepcidin levels. Our results also showed that Fpn KO mice, which suffer from mild hemolytic anemia, were sensitive to phenylhydrazine-induced oxidative stress but were able to tolerate iron deficiency upon exposure to a low-iron diet and phlebotomy, supporting that the anemia of Fpn KO mice resulted from erythrocytic iron overload and resulting oxidative injury rather than a red blood cell (RBC) production defect. Moreover, we found that the mean corpuscular volume (MCV) values of gain-of-function FPN mutation patients were positively associated with serum transferrin saturations, whereas MCVs of loss-of-function FPN mutation patients were not, supporting that erythroblasts donate iron to blood through FPN in response to serum iron levels. Our results indicate that FPN of erythroid cells plays an unexpectedly essential role in maintaining systemic iron homeostasis and protecting RBCs from oxidative stress, providing insight into the pathophysiology of FPN diseases.
Introduction
Iron is an essential element for almost all living organisms because of its functions in electron transport, adenosine triphosphate production, nucleotide synthesis, and oxygen transport. In a healthy adult, the majority of the iron consumed daily is derived from the recycling of senescent red blood cells (RBCs) by reticuloendothelial macrophages in the spleen and liver, while ∼10% of the iron is obtained by absorption of dietary iron by the intestinal epithelial cells. Hepatocytes, the major iron storage cell in vivo, also release iron from their intracellular iron repository when systemic iron levels decrease. Consistently, ferroportin (FPN), the only known vertebrate iron exporter identified to date, is highly expressed in splenic macrophages, Kupffer cells, hepatocytes, and intestinal epithelial cells, from which it transports iron into the blood.1,2 Cell-specific knockout (KO) of Fpn in intestinal epithelial cells led to severe iron deficiency anemia,1 and cell-specific KO of Fpn in macrophages or hepatocytes caused serum iron deficiency and mild anemia,3,4 confirming that FPN expressed in these 3 tissues plays a crucial role in maintaining systemic iron homeostasis.
Because of the essential function of FPN in cellular and systemic iron homeostasis, expression and activity of FPN are regulated at multiple levels. At the transcriptional level, FPN is regulated by the transcription factors Btb and Cnc homology 1 (BACH1) and nuclear factor erythroid 2-like 2 (Nrf2) in response to cellular heme levels and by metal transcription factor-1 (MTP1) in response to zinc and cadmium levels.5,6 At the cellular level, FPN is regulated by the iron regulatory proteins (IRPs)/iron responsive element (IRE) system.7,8 Under iron deficiency, IRPs bind to the IRE, a stem-loop structure in the 5′-untranslated region (UTR) of FPN messenger RNA (mRNA), to inhibit the translation of FPN and thereby limit iron efflux.8-10 At the systemic level, FPN activity is regulated by hepcidin, a small peptide that is secreted by hepatocytes and is positively regulated by high systemic iron levels and inflammation, and negatively regulated by increased erythropoiesis.2,11 Circulating in the blood, hepcidin binds to FPN on the plasma membrane of target cells to induce the ubiquitination, internalization, and degradation of FPN, which inhibits iron export into the blood.11 Recently, Aschemeyer et al and our group found that hepcidin binding also arrested a conformational change of FPN critical to iron export that directly inhibited its iron export activity without changing its protein levels.12-15 The conformational block mechanism potentially plays an important role in cells that do not have active FPN turnover, such as mature RBCs.15 By feedback regulation, the hepcidin-FPN axis maintains systemic iron homeostasis. Gene mutations that either decrease hepcidin expression or disrupt the hepcidin-induced FPN degradation process cause hemochromatosis, a common hereditary iron overload disease, underlining the importance of hepcidin-FPN axis in systemic iron homeostasis.16,17 Thus far, there are >50 human FPN mutations reported.16 Some FPN mutations (gain-of-function mutations) disrupt hepcidin-induced degradation and thereby increase the iron export activity of FPN, leading to phenotypes similar to typical hemochromatosis, including iron overload in parenchymal tissues and higher transferrin saturations, and causing the diseases referred to as “nonclassical FPN disease.” The majority of FPN mutations described to date are loss-of-function mutations that reduce the iron export activity, leading to iron overload in reticuloendothelial macrophages, mild anemia, and low to normal transferrin saturations, causing the “classical FPN disease.”
While we studied the regulation of FPN in the small intestine, we found that the FPN gene is transcribed using either of 2 alternative promoters to produce 2 distinct mRNA transcripts, the canonical IRE-bearing form FPN1A and the non-IRE bearing form FPN1B.18 In addition to the intestine, where FPN1B plays an important function allowing iron absorption to occur under iron deficiency conditions, FPN1B mRNA is also highly expressed in the early stages of erythroid development, which presumably enables developing red cells to return iron to the blood circulation under systemic iron deficiency by evading repression by the IRP/IRE system.18,19 Non-IRE bearing FPN mRNAs are also expressed in human erythroblasts.20
Our most recent results revealed that FPN was highly abundant in mature RBCs.15 Erythroblast-specific Fpn KO mice developed mild hemolytic anemia and were susceptible to infection by malarial parasites, indicating that FPN protected RBCs against oxidative stress and malaria infection.15 Here, because RBCs account for 25% of the total number of cells in the body and erythroblasts use up to 90% of the iron that circulates each day, we investigated how the abundant levels of FPN on erythroid cells contribute to systemic iron homeostasis. We also studied the effect of low-iron diets, phenylhydrazine (PHZ)–induced oxidative stress, and phlebotomy on the anemia of the erythroblast-specific Fpn KO mice, to gain insights into the role of FPN of erythroid cells in the pathophysiology of FPN diseases. We found that red cell FPN is an unexpectedly important cornerstone of systemic iron homeostasis that enables erythroid cells to return significant amounts of iron directly into the blood.
Materials and methods
Mice
All the mouse experiments were done following protocols approved by the Animal Care and Use Committee of the National Institute of Child Health and Human Development and met National Institutes of Health guidelines for the humane care of animals. Erythroid-specific KO mice were created by crossing Fpnfl/fl and ErCre+/− mice as previously described15 and were genotyped by polymerase chain reaction according to the original description.1,21 Littermate siblings were used as controls in all experiments to minimize genetic background differences. The mice were weaned at 3 to 4 weeks age and maintained on the normal NIH-07 diet (350 mg iron/kg) manufactured by Harlan Teklad. For the high- and low-iron diet experiments, the mice were maintained on a high-iron diet (1.6 g iron/kg) or low-iron diet (2-6 mg iron/kg) (Harlan Teklad) for at least 3 months after weaning before experiments were performed. All the experiments were done using 3- to 6-month-old mice unless otherwise mentioned.
Blood indices
Blood samples (50 μL) were collected from facial veins to heparin-coated tubes and were then analyzed with the IDEXX ProCyte Dx Hematology Analyzer. For analysis of the RBC profile of PHZ-treated mice, the blood indices files were exported into flow cytometry standard files and then were analyzed by FlowJo software.
Tissue homogenate and western blot
Tissues were snap-frozen in liquid nitrogen and then kept at −80°C before being homogenized in 10 volumes of radioimmunoprecipitation assay buffer [50 mM tris(hydroxymethyl)aminomethane (Tris) pH 7.4, 150 mM NaCl, 0.1% sodium dodecyl sulfate, 0.5% sodium deoxycholate, 1% Triton X-100, 5 mM EDTA, Halt protease inhibitor]. Homogenates were centrifuged at 7500g for 5 minutes, and the supernatant was then moved to a new tube and centrifuged at 20 000g for 5 minutes to isolate the protein lysates. The protein concentration was determined with Bradford method with Bio-Rad Protein Assay Dye Reagent (Bio-Rad) and then mixed with 2× loading buffer (50 mM Tris-HCl, pH 6.8, 2% sodium dodecyl sulfate, 10% glycerol, 1% β-mercaptoethanol, 12.5 mM EDTA, 0.02% bromophenol blue). The protein samples with loading buffer were incubated at 37°C for 15 minutes for antibodies of TfR1, FPN, DMT1, and band 3 or at 95°C for 5 minutes for the other antibodies. After mixing and briefly centrifuging, the samples were separated on 4% to 12% Bis-Tris gels (Thermo Fisher Scientific), and then transferred to nitrocellulose membranes. The membranes were blocked with 5% nonfat milk in phosphate-buffered saline with 0.1% Tween-20 for 30 minutes, and then incubated with primary antibodies overnight at 4°C. The blots were incubated with secondary antibodies for 1 hour at room temperature, and then X-ray films were developed with SuperSignal West Pico ECL substrates (Thermo Fisher Scientific). Primary antibodies: rabbit anti-mouse FPN antibody (MTP11-A, Alpha Diagnostics); mouse monoclonal anti-β−actin antibody (Sigma); mouse monoclonal anti-TfR1 antibody (Thermo Fisher Scientific); rabbit anti-HO1 antibody (Abcam); rabbit anti-band 3 antibody (Proteintech Group Inc.). Rabbit anti-l-ferritin antibody, chicken anti-H-ferritin antibody, rabbit anti-total DMT1 antibody, and rabbit anti-DMT1-IRE antibody were developed in the laboratory as described previously.18,22,23 Molecular weight markers (kDa) were labeled on the right of the blots to indicate the size of the bands.
Additional methods are in the supplemental Methods (available on the Blood Web site).
Results
FPN is highly abundant in mouse RBCs
FPN is highly expressed in macrophages, which phagocytose senescent RBCs and return most of the iron in red cells to the blood. Our recent results showed that FPN had 54 000 copies per human RBC and was ranked at 54th in the RBC membrane-associated proteins according to the relative protein abundance to band 3 that is estimated to have 1 000 000 copies per human RBC.15 Here, we evaluated the FPN abundance in mouse RBCs with mass spectrometry and found that FPN was ∼2.54% of band 3 according to their exponentially modified protein abundance index (in comparison with 5.4% of human RBCs) (Figure 1A; supplemental Table 1), confirming that FPN is an abundant membrane protein of mouse RBCs. In contrast to human RBCs, we did not detect Glut1 and Cybrd1 in mouse RBCs, highlighting several species differences between human and mouse RBCs.24,25 Next, we compared FPN protein levels of erythroblasts and RBCs with splenic macrophages. Results (Figure 1B) showed that FPN levels in erythroblasts were as high as its levels in macrophages, and FPN levels in RBCs were ∼30% of the levels in macrophages and erythroblasts. Considering the weak intensity of the actin band, an important cytoskeletal protein that helps maintain the biconcave structure of RBCs, relative FPN levels in RBCs could be higher than in macrophages and erythroblasts. By contrast, TfR1 was abundant in erythroblasts, low in macrophages, and undetectable in RBCs by western blots, consistent with its function in absorbing iron for hemoglobin synthesis in erythroblasts; whereas band 3 was highly abundant in RBCs and erythroblasts but was absent in macrophages.

Cell-specific KO of Fpn in erythroid cells decreased serum iron but increased tissue iron contents. (A) Protein abundance in mouse RBC membrane measured by mass spectrometry. The abundance of band 3, one of the most abundant RBC membrane proteins, was taken as 100%, and other proteins were normalized to band 3 according to their exponentially modified protein abundance index (emPAI). N/A, not applicable. (B) FPN, TfR1, actin, and band 3 levels in total cell lysates of purified splenic macrophages (Mac), peripheral RBCs, and bone marrow erythroblasts (n = 3). Ponceau S staining is shown as a loading control. Actin-S, short exposure; actin-L, long exposure. Serum iron (C), total iron binding capacity (TIBC) (D), transferrin (Tf) saturation levels (E), and serum ferritin (F) of WT and erythroblast-specific Fpn KO mice (Fpn KO). Nonheme iron (NHI) and ferritin levels in spleens (G), liver (H), kidneys (I), and splenic macrophages (J) of WT and Fpn KO mice. Data are presented as mean ± 95% confidence interval (CI).
Cell-specific KO of Fpn in erythroid cells decreased serum iron but increased tissue iron contents. (A) Protein abundance in mouse RBC membrane measured by mass spectrometry. The abundance of band 3, one of the most abundant RBC membrane proteins, was taken as 100%, and other proteins were normalized to band 3 according to their exponentially modified protein abundance index (emPAI). N/A, not applicable. (B) FPN, TfR1, actin, and band 3 levels in total cell lysates of purified splenic macrophages (Mac), peripheral RBCs, and bone marrow erythroblasts (n = 3). Ponceau S staining is shown as a loading control. Actin-S, short exposure; actin-L, long exposure. Serum iron (C), total iron binding capacity (TIBC) (D), transferrin (Tf) saturation levels (E), and serum ferritin (F) of WT and erythroblast-specific Fpn KO mice (Fpn KO). Nonheme iron (NHI) and ferritin levels in spleens (G), liver (H), kidneys (I), and splenic macrophages (J) of WT and Fpn KO mice. Data are presented as mean ± 95% confidence interval (CI).
Erythroid-specific Fpn KO reduced serum iron but increased tissue iron contents
Because of the high levels of FPN in erythroblasts and mature RBCs, we hypothesized that FPN in erythroid cells contributes a significant amount of iron to the blood, similar to its role in macrophages, hepatocytes, and intestinal epithelial cells. Accordingly, we measured serum iron levels of erythroblast-specific Fpn KO mice. In these mice, FPN was efficiently deleted in the erythroblasts and RBCs.15 Compared with wild-type (WT) mice, serum iron and transferrin saturation levels decreased by ∼20% in Fpn KO mice (Figure 1C-E). By contrast, serum ferritin levels increased by 80% in Fpn KO mice (Figure 1F), indicating the presence of tissue iron overload, because serum ferritin is primarily derived from tissue macrophages.26 Consistently, ferritin levels and nonheme iron contents were significantly increased in the spleen, liver, kidney, and splenic macrophages (Figure 1G-J). The tissue iron overload of Fpn KO mice was expected from the ongoing mild intravascular hemolysis of the mice and presumably resulted from the increased erythrophagocytosis of damaged RBCs and uptake of free hemoglobin.15
Investigation of FPN and hepcidin expression suggested that defective erythroid iron export contributed to the reduction of serum iron levels in Fpn KO mice
Because serum iron was previously considered to be provided mainly by FPN in the spleen, liver, and duodenum, we studied FPN expression in these 3 tissues. Immunoblots showed that FPN levels considerably increased in the spleen and liver of Fpn KO mice (Figure 2A-B). To confirm the results, we also isolated splenic macrophages, the cells responsible for recycling senescent RBCs, and results showed that FPN levels were also significantly increased in the macrophages of Fpn KO mice (Figure 2C). Consistently, the abundance of ferritins (Figures 1G-J and 2C), which are encoded by transcripts that have IREs in the 5′UTRs, similar to the Fpn 1A mRNA, significantly increased. Conversely, the expression of DMT1, which has an IRE in the 3′UTR of its mRNA, decreased in the liver (Figure 2B), indicating that IRPs were not in the IRE-binding form in these tissues, which allowed more FPN to be translated under iron overload conditions (Figure 2A-C).9,10 We also checked the mRNA levels of Fpn and other iron-related genes in the duodenum, but we did not find significant changes in mRNA levels of Fpn, Dcytb, DMT1, TfR1, and FtL (supplemental Figure 1).
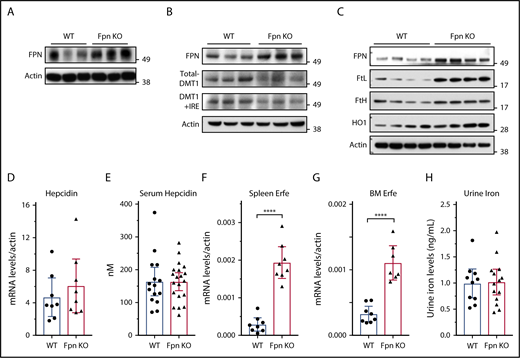
Fpn KO in erythroid cells increased FPN protein levels in spleen and liver without reducing hepcidin levels. (A) Immunoblots of FPN and actin in spleen lysates of 3 individual WT and Fpn KO mice. (B) Immunoblots of FPN, total DMT1, DMT1+IRE form, and actin in liver lysates of 3 individual WT and Fpn KO mice. (C) Immunoblots of FPN, l-ferritin (FtL), H-ferritin (FtH), and heme oxygenase 1 (HO1) and actin in splenic macrophages of 4 individual WT and Fpn KO mice. Liver hepcidin mRNA (D) and serum hepcidin (E) levels of WT and Fpn KO mice. Erythroferrone (Erfe) mRNA levels in spleen (F) and bone marrow (G) of WT and Fpn KO mice. (H) Urine iron levels of WT and Fpn KO mice measured by inductively coupled plasma mass spectrometry. Data are presented as mean ± 95% CI.
Fpn KO in erythroid cells increased FPN protein levels in spleen and liver without reducing hepcidin levels. (A) Immunoblots of FPN and actin in spleen lysates of 3 individual WT and Fpn KO mice. (B) Immunoblots of FPN, total DMT1, DMT1+IRE form, and actin in liver lysates of 3 individual WT and Fpn KO mice. (C) Immunoblots of FPN, l-ferritin (FtL), H-ferritin (FtH), and heme oxygenase 1 (HO1) and actin in splenic macrophages of 4 individual WT and Fpn KO mice. Liver hepcidin mRNA (D) and serum hepcidin (E) levels of WT and Fpn KO mice. Erythroferrone (Erfe) mRNA levels in spleen (F) and bone marrow (G) of WT and Fpn KO mice. (H) Urine iron levels of WT and Fpn KO mice measured by inductively coupled plasma mass spectrometry. Data are presented as mean ± 95% CI.
Hepcidin binds to FPN and induces its ubiquitination, internalization, and degradation, to control serum iron levels in a feedback manner.2,11 Recently, Aschemeyer et al and our group also found that hepcidin directly bound and inhibited FPN activity by arresting a conformational transition that is required for iron export activity.12-15 When we checked hepcidin expression in the Fpn KO mice, we found that neither liver hepcidin mRNA nor serum hepcidin levels changed in Fpn KO mice (Figure 2D-E), although liver iron overload usually stimulates hepcidin expression (Figure 1H). The mRNA levels of Bmp6, Bmp2, Ld1, Atoh8, and Smad7 also did not change significantly in the liver of Fpn KO mice (supplemental Figure 2). Hepcidin expression is positively regulated by liver iron overload and serum transferrin saturation, but negatively regulated by erythropoiesis.2 Accordingly, we checked the expression levels of erythroferrone (Erfe), the erythroid-produced iron regulatory hormone,27 and found that it significantly increased in both spleen and bone marrow (Figure 2F-G), which is consistent with the increased erythropoiesis of Fpn KO mice,15 suggesting that hepcidin expression was repressed by enhanced erythropoiesis, and the signal was sufficient to counteract the usual effect of high tissue iron on hepcidin expression. We also checked urine iron levels and found no difference between WT and Fpn KO mice (Figure 2H), which ruled out the possibility that urinary iron loss accounted for the decrease of serum iron levels. Collectively, the serum iron reduction of Fpn KO mice was not because of hepcidin overexpression or FPN deficiency in the spleen, liver, or intestine; had the FPN abundance not increased in spleen and liver (Figure 2A-C), serum iron levels might have been even lower. These results suggested that FPN on erythroid cells contributes ≥20% of iron to the blood circulation.
Low-iron-diet treatments did not exacerbate the anemia of Fpn KO mice
Because of the importance of FPN in erythroid cells, Fpn KO mice developed mild anemia,15 as demonstrated by low RBC counts, lower hemoglobins and hematocrits (HCTs), and increased mean corpuscular volume (MCV) and reticulocyte counts (supplemental Table 2). To study the mechanism behind these changes in red cell parameters, we challenged the mice with low-iron diets, PHZ injections, or multiple phlebotomy procedures. Compared with the mice on a high-iron diet, treatment with a low-iron diet for 3 months dramatically decreased RBC counts, hemoglobin, HCTs, and MCVs in WT mice (Figure 3A-D), indicating that iron deficiency anemia developed. By contrast, although low-iron diets decreased the MCV (Figure 3D) and mean corpuscular hemoglobin (MCH) (Figure 3F) of Fpn KO mice, the RBCs, hemoglobin, and HCT levels of the already anemic FPN KO mice did not change significantly (Figure 3A-F), suggesting that erythroblasts of Fpn KO mice had sufficient iron to support their baseline hemoglobin synthesis and RBC production levels even when total bodily iron levels were depleted. Additionally, the differences in RBC counts, hemoglobin contents, and HCTs between WT and Fpn KO mice disappeared in mice on low-iron diets (Figure 3). These results indicated that many hematologic indices of the mildly anemic Fpn KO mice did not change in response to iron deficiency, most likely because the loss of erythroid FPN resulted in retention of intracellular iron in erythroblasts.
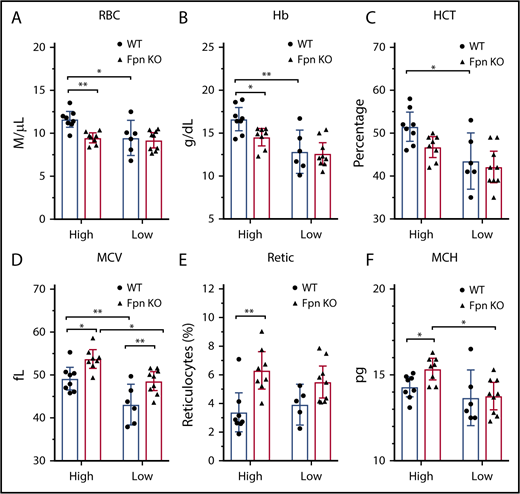
Iron deficiency diminished the differences of blood indices between WT and Fpn conditional KO mice. RBCs (A), hemoglobin (Hb) (B), HCTs (C), MCV (D), reticulocytes (Retic) (E), and MCH (F) of WT and Fpn KO mice after treatment with high-iron or low-iron diets for 3 months. There were significant differences between WT and Fpn KO mice on high-iron diets, whereas the differences between the 2 genotypes disappeared on low-iron diets for RBCs, hemoglobin, HCT, reticulocytes, and MCH. Mean ± 95% CI, statistical significance determined with 2-way analysis of variance and Sidak's multiple comparisons tests.
Iron deficiency diminished the differences of blood indices between WT and Fpn conditional KO mice. RBCs (A), hemoglobin (Hb) (B), HCTs (C), MCV (D), reticulocytes (Retic) (E), and MCH (F) of WT and Fpn KO mice after treatment with high-iron or low-iron diets for 3 months. There were significant differences between WT and Fpn KO mice on high-iron diets, whereas the differences between the 2 genotypes disappeared on low-iron diets for RBCs, hemoglobin, HCT, reticulocytes, and MCH. Mean ± 95% CI, statistical significance determined with 2-way analysis of variance and Sidak's multiple comparisons tests.
Fpn KO mice were sensitive to PHZ-induced oxidative stress but maintained normal RBC production
Next, we treated the mice with PHZ to study the response of the Fpn KO mice to oxidative stress (Figure 4A). PHZ accumulates in RBCs and induces oxidative stress, which oxidizes hemoglobin and damages plasma membranes, leading to hemolytic anemia.28 As we expected, PHZ treatment dramatically reduced the RBCs, HCTs, and MCV measurements, and increased the MCH, mean corpuscular hemoglobin contents, and reticulocyte counts of WT mice (Figure 4A-H), indicating that hemolytic anemia developed. Notably, as new RBCs replaced PHZ-damaged RBCs (Figure 4E,I), these indices started to slowly recover starting on day 3. Compared with WT mice, Fpn KO mice had fewer RBCs, lower hemoglobin and HCT levels, and higher reticulocyte counts after PHZ treatment (Figure 4B-E). Moreover, Fpn KO mice died more frequently than WT mice (supplemental Figure 3), indicating that Fpn KO mice were sensitive to PHZ-induced RBC oxidative stress. RBC analyses (Figure 4I) showed that upon PHZ treatment, RBC volumes diminished and shifted from the R1 region (healthy RBCs) to the R2 region (PHZ-loaded RBCs), and some severely damaged RBCs broke into cell fragments (R3 region). Compared with the RBCs of WT mice, PHZ-loaded Fpn KO RBCs quickly disappeared (Figure 4I-J) and broke into more fragments (Figure 4K), indicating that Fpn KO RBCs were prone to oxidative damage. When we measured the activities of antioxidant enzymes, we found that glutathione peroxidase (GPx) activity was dramatically reduced in RBCs of Fpn KO mice (supplemental Figure 4), perhaps because oxidative stress deactivated its activity. Notably, Fpn KO mice quickly generated more reticulocytes than WT mice within 3 days (Figure 4E), and the differences in RBCs, hemoglobin, and HCTs between WT and Fpn KO mice (Figure 4B-D) disappeared by days 6 and 10, suggesting that Fpn KO mice are fully capable of generating RBCs.
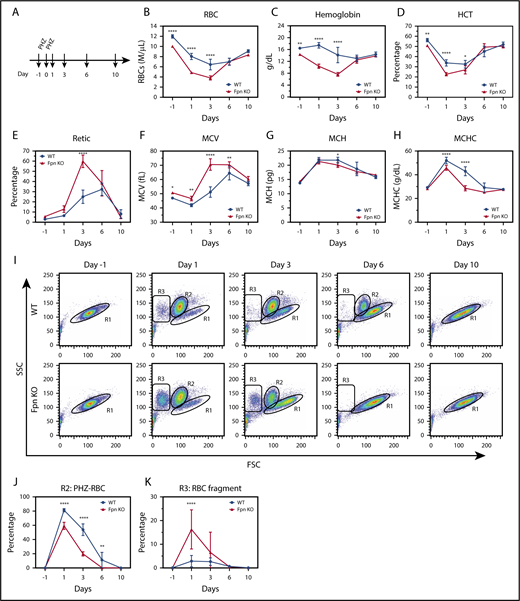
RBCs of conditional Fpn KO mice were sensitive to PHZ-induced oxidative stress. (A) Scheme of PHZ treatment. The mice were given 2 doses of phenylhydrazine hydrochloride (PHZ) solution (60 mg/kg body weight) via intraperitoneal injection on 2 consecutive days, and 50 μL blood samples were subsequently collected and analyzed on days 1, 3, 6, and 10 after treatment. RBCs (B), hemoglobin (C), HCT (D), reticulocytes (E), MCV (F), MCH (G), and mean corpuscular hemoglobin contents (MCHC) (H) were measured. (I) Representative dot plots of blood profiles showed the dynamic changes of RBCs after PHZ treatment. Before PHZ treatment, all healthy RBCs were in the R1 region; PHZ treatment shifted RBCs from the R1 region (healthy RBCs) to the R2 region (PHZ-loaded RBCs); some RBCs broke into cell fragments (R3 region). FSC, forward scatter; SSC, side scatter. Numbers of intact PHZ-loaded RBCs diminished faster compared with WT (J), whereas RBC fragments of PHZ-loaded RBCs increased significantly relative to WT (K). The PHZ-loaded RBCs were cleared from the circulation much faster in Fpn KO mice than WT mice, and there were more RBC fragments in Fpn KO mice than WT mice, indicating that the RBCs of Fpn KO mice were sensitive to oxidative stress. Mean ± 95% CI, n = 10 for each group; statistical significance determined with 2-way analysis of variance and Sidak's multiple comparisons tests.
RBCs of conditional Fpn KO mice were sensitive to PHZ-induced oxidative stress. (A) Scheme of PHZ treatment. The mice were given 2 doses of phenylhydrazine hydrochloride (PHZ) solution (60 mg/kg body weight) via intraperitoneal injection on 2 consecutive days, and 50 μL blood samples were subsequently collected and analyzed on days 1, 3, 6, and 10 after treatment. RBCs (B), hemoglobin (C), HCT (D), reticulocytes (E), MCV (F), MCH (G), and mean corpuscular hemoglobin contents (MCHC) (H) were measured. (I) Representative dot plots of blood profiles showed the dynamic changes of RBCs after PHZ treatment. Before PHZ treatment, all healthy RBCs were in the R1 region; PHZ treatment shifted RBCs from the R1 region (healthy RBCs) to the R2 region (PHZ-loaded RBCs); some RBCs broke into cell fragments (R3 region). FSC, forward scatter; SSC, side scatter. Numbers of intact PHZ-loaded RBCs diminished faster compared with WT (J), whereas RBC fragments of PHZ-loaded RBCs increased significantly relative to WT (K). The PHZ-loaded RBCs were cleared from the circulation much faster in Fpn KO mice than WT mice, and there were more RBC fragments in Fpn KO mice than WT mice, indicating that the RBCs of Fpn KO mice were sensitive to oxidative stress. Mean ± 95% CI, n = 10 for each group; statistical significance determined with 2-way analysis of variance and Sidak's multiple comparisons tests.
To further test the function of Fpn KO mice to generate RBCs, we challenged the mice with multiple phlebotomies (supplemental Figure 5A). Results showed that phlebotomies reduced the RBC counts, hemoglobin contents, and HCTs of both WT and Fpn KO mice in the first 3 days, but then these indices gradually recovered even though phlebotomies continued (supplemental Figure 5B-D). Notably, the difference between WT and Fpn KO mice for hemoglobin and HCTs narrowed and disappeared, probably because phlebotomies reduce the hemolysis of Fpn KO mice (supplemental Figure 5B-D). These results supported that Fpn KO mice are fully able to produce RBCs.

The correlation of the RBC MCV with serum transferrin saturation in patients with gain-of-function or loss-of-function FPN mutations. (A) MCV vs transferrin (Tf) saturation plot of FPN loss-of-function (blue) and gain-of-function (red) mutations. (B) Linear regression of MCV vs Tf saturation showed that the MCVs of gain-of-function mutations increased as serum Tf saturations increased, whereas MCVs of loss-of-function mutations did not. The MCV and Tf saturation data of patients were obtained from literature, and the mutations were classified as gain-of-function mutations or loss-of-function mutations based on reports also.10,36,38-40 Consistent with our hypothesis, these results suggest that erythroblasts with loss-of-function FPN mutations use retained intracellular iron to synthesize hemoglobin and were relatively insensitive to serum iron perturbations, leading to higher MCV values relative to low Tf saturations. By contrast, erythroblasts with gain-of-function mutations readily export iron out of cells and are sensitive to serum iron fluctuations.
The correlation of the RBC MCV with serum transferrin saturation in patients with gain-of-function or loss-of-function FPN mutations. (A) MCV vs transferrin (Tf) saturation plot of FPN loss-of-function (blue) and gain-of-function (red) mutations. (B) Linear regression of MCV vs Tf saturation showed that the MCVs of gain-of-function mutations increased as serum Tf saturations increased, whereas MCVs of loss-of-function mutations did not. The MCV and Tf saturation data of patients were obtained from literature, and the mutations were classified as gain-of-function mutations or loss-of-function mutations based on reports also.10,36,38-40 Consistent with our hypothesis, these results suggest that erythroblasts with loss-of-function FPN mutations use retained intracellular iron to synthesize hemoglobin and were relatively insensitive to serum iron perturbations, leading to higher MCV values relative to low Tf saturations. By contrast, erythroblasts with gain-of-function mutations readily export iron out of cells and are sensitive to serum iron fluctuations.
MCVs of gain-of-function FPN mutation patients correlated with serum transferrin saturation levels, but MCVs of loss-of-function mutation patients did not, consistent with the function of FPN in erythroid cells
We speculated that our findings probably were essential for understanding the pathophysiology of FPN disease, which represents the second largest cause of hereditary hemochromatosis, with >50 FPN mutations reported to date.16 The classic FPN diseases are caused by the loss-of-function FPN mutations and are characterized by hyperferritinemia, low-to-normal transferrin saturations, iron overload in reticuloendothelial macrophages, and intolerance to venesection.16,29 By contrast, nonclassical FPN diseases are caused by the gain-of-function FPN mutations. Those mutations render FPN resistant to hepcidin-induced degradation, and the resultant FPN overexpression leads to hyperferritinemia, high transferrin saturations, iron deficiency in reticuloendothelial macrophages, and iron overload in parenchymal cells. Because levels of FPN are as high in erythroblasts as macrophages (Figure 1B), loss-of-function FPN mutations presumably would cause iron to accumulate inside erythroblasts, leading to high hemoglobin synthesis and high MCVs. By contrast, gain-of-function FPN mutations would export more iron out of erythroblasts and hence leave less iron for hemoglobin synthesis, presumably leading to lower MCVs (at least until the effects are partially blunted by the high transferrin saturation values that occur in the older patients).
To assess our predictions, we analyzed the MCVs of the patients with FPN mutations that have been reported in the literature. A total of 55 patients with MCV data were found in the literature, including 37 patients with 12 distinct loss-of-function mutations, and 18 patients with 7 distinct gain-of-function mutations (Figure 5; supplemental Table 3).16,30-40 As shown in Figure 5A, loss-of-function FPN patients had normal-to-high MCVs (91 fL, 89.5-94fL, median interquartile range) and low-to-normal transferrin saturations (31%, 24% to 38.3%, median interquartile range); conversely, the gain-of-function mutation patients had MCVs of large variations (93fL, 82.9-102fL, median interquartile range), likely because of variations of patient transferrin saturations (89%, 42% to 95%, median, interquartile range). Linear regression analysis (Figure 5B) showed that MCVs of loss-of-function mutation patients did not correlate with transferrin saturation (r2 = 0.08, P = .1), likely because of the fact that iron is retained intracellularly and used for hemoglobin production, regardless of serum iron levels. By contrast, MCVs of gain-of-function patients positively correlated with transferrin saturation levels (r2 = 0.67, P < .0001); they displayed low MCVs when transferrin saturations were lower, presumably because they constitutively exported more iron out of cells and therefore had less iron for hemoglobin synthesis, and they displayed higher MCVs only when serum transferrin was nearly saturated. In accordance with our finding, McNamara et al analyzed 220 subjects including 56 gain-of-function FPN Q248H mutation carriers and found that the Q248H mutation was associated with smaller MCVs compared with subjects that lacked this mutation, whereas their transferrin saturations were similar to those of normal subjects.41 These results supported that FPN of human erythroid cells can donate iron to the blood circulation and patients with FPN deficiency would be expected to accumulate relatively more iron in erythroid cells.
Discussion
Prior to our recent studies, it was well accepted that FPN on reticuloendothelial macrophages, intestinal epithelial cells, and hepatocytes transported iron into the bloodstream to meet the daily iron needs of the whole body, and these 3 sources represented iron derived from recycling, absorption, and storage, respectively (Figure 6). In accordance with this notion, macrophage-specific Fpn KO reduced serum iron levels by ∼20% in 2-month-old mice and by ∼50% in 10-month-old mice, and hepatocyte-specific Fpn KO reduced the serum iron by ∼30% in 3-week-old mice but not thereafter.3,4 Here we found that erythroblast-specific Fpn KO reduced the serum iron in adult mice by ∼20%, similar to results observed in mice with cell-specific Fpn KO in macrophages, in hepatocytes, or in intestinal epithelial cells, suggesting that FPN in erythroid cells also contributes a significant amount of iron to the bloodstream.1,3,4
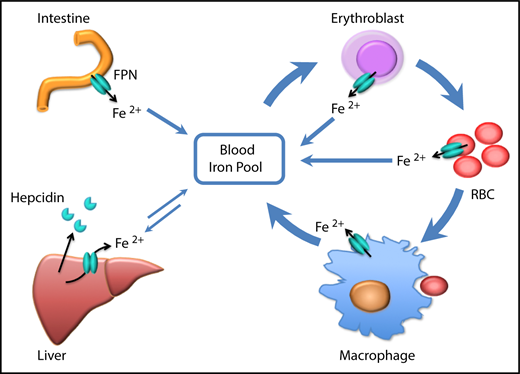
Scheme of the function of erythrocytic FPN in systemic iron homeostasis. FPN on reticuloendothelial macrophages exports iron recycled from senescent RBCs into the blood and contributes the majority of the daily iron influx. FPN on intestinal epithelial cells transports iron absorbed from diets into the blood to compensate for the iron loss via skin and epithelium shredding, which is estimated to account for ∼10% daily iron consumption. FPN on hepatocytes also exports iron into the blood when blood iron levels are lower, from the iron deposits that are stored under iron-replete conditions. Here we found that FPN on erythroblasts and RBCs also contributed a significant amount of iron into the blood. Considering that the levels of FPN on erythroblasts are as abundant as on macrophages, the contribution of iron from erythroid cells could exceed that from intestine or hepatocytes under homeostatic conditions. Thus, FPN on erythroblasts plays an essential role in maintaining systemic iron homeostasis, especially under iron deficiency conditions, and FPN on RBCs protects RBCs against oxidative stress and malaria infection.
Scheme of the function of erythrocytic FPN in systemic iron homeostasis. FPN on reticuloendothelial macrophages exports iron recycled from senescent RBCs into the blood and contributes the majority of the daily iron influx. FPN on intestinal epithelial cells transports iron absorbed from diets into the blood to compensate for the iron loss via skin and epithelium shredding, which is estimated to account for ∼10% daily iron consumption. FPN on hepatocytes also exports iron into the blood when blood iron levels are lower, from the iron deposits that are stored under iron-replete conditions. Here we found that FPN on erythroblasts and RBCs also contributed a significant amount of iron into the blood. Considering that the levels of FPN on erythroblasts are as abundant as on macrophages, the contribution of iron from erythroid cells could exceed that from intestine or hepatocytes under homeostatic conditions. Thus, FPN on erythroblasts plays an essential role in maintaining systemic iron homeostasis, especially under iron deficiency conditions, and FPN on RBCs protects RBCs against oxidative stress and malaria infection.
FPN protein levels in erythroblasts were as abundant as FPN in splenic macrophages (Figure 1B), and use of erythroid iron reservoirs might constitute a protective mechanism to maintain systemic iron homeostasis under iron deficiency conditions.18,19 Because 90% of daily iron consumption was attributable to use by erythroblasts to synthesize hemoglobin and produce RBCs, limiting erythropoiesis under iron deficiency could allow distribution of more iron to other cells and tissues before low systemic iron levels endanger some vital tissues such as cardiomyocytes and neurons. In accordance with this notion, the majority of FPN protein of erythroblasts is translated from the non-IRE bearing Fpn1B isoform and thus is not translationally repressed by intracellular IRP/IRE network, instead relying on the regulation by the systemic iron regulatory hormone hepcidin.18,19 Of note, FPN1B is also specifically expressed in intestinal epithelial cells to facilitate iron absorption under iron deficiency conditions.18 At the systemic level, iron deficiency would activate the IRE-binding activity of IRP1, which inhibits the translation of hypoxia inducible factor-2α and thereby represses the transcription of erythropoietin and RBC production, permitting iron usually consumed by erythropoiesis to other tissues and cells and representing a safety mechanism at the systemic level.42-44 At the cellular level, FPN of erythroblasts would directly export iron from erythroblasts to the blood to limit hemoglobin synthesis, likely representing another safety mechanism that redirects iron to less robust tissues under iron deficiency conditions.
Because iron is an essential element for many vital enzymes, intracellular iron concentrations must remain in an optimal range to support protein synthesis while avoiding generating oxidative stress. Overexpression of FPN would be expected to deplete intracellular iron and induce growth arrest and cell death. RBCs might be the only cell type that does not need to maintain a labile iron pool, but rather benefit from maximally lowering free iron levels. Otherwise, free iron would readily react with H2O2 generated by auto-oxidation of hemoglobin to produce reactive oxygen species that could damage the red cell membranes, as was observed in the Fpn KO mice.15,45 RBCs have 20 mM hemoglobin, and it is estimated that >3% of these hemoglobins will be auto-oxidized daily in vivo, a process that would lead to the release of free iron from hemoglobin.46-48 Not surprisingly, antioxidant enzymes including catalase, superoxide dismutase, GPx, and peroxiredoxins are abundant in RBCs, and deficiency of methemoglobin reductase that reduces methemoglobin (Fe3+) to hemoglobin (Fe2+) causes methemoglobinemia.49-51 Hence, FPN exports the free iron generated in the hemoglobin auto-oxidation process and plays an essential role in protecting RBCs from oxidative stress. Notably, activity of the antioxidant enzyme GPx activity was significantly reduced in Fpn KO RBCs (supplemental Figure 4). Considering that RBCs account for 25% of the total number of cells in the body, the iron exported from RBCs likely represents a significant amount of iron.
Our findings also provide valuable insight into the pathogenesis of the FPN diseases. The linear correlation between MCV and serum transferrin saturation in gain-of-function FPN mutations but not loss-of-function mutations was consistent with the function of FPN in erythroid cells (Figure 5). The shorter life span and mild hemolysis of Fpn KO RBCs highlight the essential function of FPN in protecting RBCs from oxidative stress and also suggest that loss-of-function FPN mutations potentially predispose the mutation carriers to oxidative stresses and red cell hemolysis. Considering the lethality of conventional Fpn KO in mice, the residual iron export activity of loss-of-function human FPN mutations might be enough to allow the survival of most cells. Additionally, some FPN mutations could represent an intermediate mutation that shows both reduced iron export activity and resistance to hepcidin-induced degradation. The influence of these mutations on the survival of RBCs and especially under oxidative stress warrants further investigation. In conclusion, our results indicated that FPN exports iron out of erythroid cells to support systemic iron homeostasis and to protect RBCs against iron-mediated oxidative stress (Figure 6). Our results can explain why loss-of-function FPN patients had relatively higher MCVs than gain-of-function FPN patients especially under low transferrin saturation conditions, and our results suggested that patients with loss-of-function FPN mutations may be prone to oxidative stress of RBCs, suggesting that the influence of these mutations on RBCs should be studied.
The online version of this article contains a data supplement.
The publication costs of this article were defrayed in part by page charge payment. Therefore, and solely to indicate this fact, this article is hereby marked “advertisement” in accordance with 18 USC section 1734.
Acknowledgments
The authors thank Nancy Andrews for providing us the FPN-flox mice, and Stuart Orkin for providing us ErCre mice.
This work was supported by the intramural program of the Eunice Kennedy Shriver National Institute of Child Health and Human Development, National Institutes of Health.
Authorship
Contribution: D.-L.Z. designed the project, performed the experiments, analyzed the data, and wrote the manuscript; T.A.R. supervised the project and wrote the manuscript; M.C.G. did the inductively coupled plasma mass spectrometry experiments, supervised the mouse colonies, and reviewed the manuscript; H.O. performed the mouse experiments and reviewed the manuscript; and Y.L. did the mass spectrometry experiments, analyzed the data, and reviewed the manuscript.
Conflict-of-interest disclosure: The authors declare no competing financial interests.
Correspondence: Tracey A. Rouault, Section on Human Iron Metabolism, Metals Biology and Molecular Medicine Group, Eunice Kennedy Shriver National Institute of Child Health and Human Development, National Institutes of Health, Building 35A Room 2D824, Bethesda, MD 20892; e-mail: rouault@mail.nih.gov.

This feature is available to Subscribers Only
Sign In or Create an Account Close Modal