

Key Points
BGLT3 is a developmental stage-specific lncRNA encoded downstream of HBG1 that positively regulates γ-globin genes.
BGLT3 locus and transcript have distinct functions in looping and mediator interaction to increase γ-globin transcription.

Abstract
Long noncoding RNAs (lncRNAs) are increasingly being appreciated as participants in regulation of important cellular processes, including transcription. Because lncRNAs are highly cell type specific, they have the potential to contribute to the unique transcriptional repertoire of diverse cells, but underlying mechanisms are unclear. We studied BGLT3, an erythroid lncRNA encoded downstream of Aγ-globin (HBG1). BGLT3 and γ-globin genes are dynamically cotranscribed in erythroid cells in vivo. Deletion of BGLT3 using CRISPR/Cas9 editing shows that it specifically contributes to regulation of γ-globin genes. We used reduction or overexpression of the RNA and inhibition of transcription through the locus by CRISPRi to distinguish functions of the transcript vs the underlying sequence. Transcription of the BGLT3 locus is critical for looping between the γ-globin genes and BGLT3 sequences. In contrast, the BGLT3 transcript is dispensable for γ-globin/BGLT3 looping but interacts with the mediator complex on chromatin. Manipulation of the BGLT3 locus does not compromise γ-globin gene long-range looping interactions with the β-globin locus control region (LCR). These data reveal that BGLT3 regulates γ-globin transcription in a developmental stage-specific fashion together with the LCR by serving as a separate means to increase RNA Pol II density at the γ-globin promoters.
Introduction
Long noncoding RNAs (lncRNAs) are emerging as significant factors in critical cellular processes including nuclear organization, modulation of chromatin state, and regulation of gene expression.1-3 Most lncRNAs are transcribed in a cell- and tissue-specific fashion.4,5 For example, hundreds of lncRNAs are expressed specifically during erythropoiesis.6,7 This suggests that lncRNAs may play an important role in the generation of diverse cell types and in cell-specific functions. However, much remains to be learned about the mechanisms underlying such a role.8
LncRNAs arise principally from intergenic sequences, including from enhancer regions where they have been called enhancer RNAs (eRNAs).9-11 Enhancers increase transcription of target genes by establishing close contact with these genes despite being located at long linear distances.12,13 High-throughput studies have shown an association between eRNAs, enhancer/gene communication, and gene activation.14,15 Nevertheless, there is a remarkable functional diversity in vivo among eRNAs. The eRNA transcript per se may recruit transcription factors, mediator, or cohesin to promote enhancer looping to a target gene to activate transcription.16-21 In other cases, the eRNA transcript functions to activate target genes through mechanism other than enhancer looping22-24 . Alternatively, the underlying eRNA locus, but not the transcript, can be required for target gene activation.25
The human β-globin locus contains 5 genes: embryonic ε (HBE1), duplicated and highly homologous fetal Aγ and Gγ (HBG1 and HBG2), and adult δ and β (HBD and HBB). The β-globin locus control region (LCR) is a strong enhancer of these genes and loops to establish proximity at the developmental stage when each is expressed.26 The switch from fetal γ- to adult β-globin during development is of clinical importance because elevated levels of fetal hemoglobin in adults moderate the severity of symptoms in sickle cell disease and β-thalassemia.27 Normally occurring mutations in the intergenic region between the γ-globin and δ-globin genes increase γ-globin expression, suggesting the presence of negative regulators.28 One negative regulatory region, near the 5′ end of the adult δ-globin gene, is occupied by the γ-globin repressor BCL11A in adult cells.29 Also in this interval is a pseudogene (HBBP1) that recent molecular studies have shown influences LCR interactions with globin genes at specific developmental stages and is important for γ-globin silencing in adults.30
Between HBBP1 and HBG1 is the gene for lncRNA BGLT3 (originally BGL3; GenBank AY034471). Using chromosome conformation capture (3C), we previously observed looping from BGLT3 sequences to HGB1 and HBG2 in human erythroleukemia K562 cells and in erythroid progenitor CD34+ cells differentiated to transcribe high levels of γ-globin.31 Here, we determined that the deletion of BGLT3 resulted in loss of looping to the γ-globin genes, and both reduced Pol II recruitment and γ-globin transcription. Mechanistic studies have indicated that the BGLT3 lncRNA and transcription through its locus are each positive regulators of γ-globin gene expression. Transcription through the BGLT3 locus is required for looping to the γ-globin genes, whereas the BGLT3 transcript is not. Instead, the BGLT3 transcript interacts with the mediator complex. Collectively, these approaches establish that the BGLT3 lncRNA and transcription of its locus have distinct functions as positive γ-globin regulators and reveal that BGLT3 functions at multiple levels in transcription activation.
Materials and methods
Cell culture
Primary human umbilical cord CD34+ cells (Lonza) were cultured in a 2-phase serum-free regimen for 14 days as described.32 Human peripheral blood mononuclear cells from thalassemia patients were collected at Athens University, Agia Sophia Children’s Hospital, Athens, Greece, after informed consent in accordance with the Declaration of Helsinki. Samples were processed and cultured as described.33 K562 cells were cultured in RPMI 1640 medium with 10% fetal bovine serum at 37°C in 5% carbon dioxide. K562 cells were induced with 30 µM of hemin (Sigma) for 3 days.
Mice
Human β-globin transgenic mice34 were maintained in a National Institutes of Health research animal facility in accordance with American Association for Laboratory Animal Care specifications. Mice were mated to obtain embryonic tissues. Yolk sacs and fetal livers were dissected from E10.5 and E12.5 embryos, respectively, washed in phosphate-buffered saline, and flash frozen in liquid nitrogen. Total RNA was prepared using the RNeasy mini kit (Qiagen) following manufacturer’s instructions.
RNA FISH
RNA fluorescence in situ hybridization (FISH) was performed as described.35 A mixture of 3 dinitrophenol-labeled oligonucleotides was used to detect HBG intron 2 and visualized with Texas Red–conjugated antibodies. BGLT3 was detected using a 1-kb single-stranded probe labeled with digoxigenin followed by fluorescein isothiocyanate–labeled antibodies. A minimum of 200 cells were scored for the presence of a BGLT3 signal associated with HBG-transcribing loci.
5′ and 3′ RACE
Total RNA from K562 cells was extracted and treated twice with DNAse, and poly(A)+ RNA was selected using the Dynabeads mRNA Purification Kit (Ambion). Rapid amplification of complementary DNA ends (RACE) was performed with First Choice RLM-RACE kit (Ambion) following manufacturer’s protocols. 5′ RACE was performed with 250 ng of poly(A)+–selected RNA and 3′ RACE with 10 μg of total RNA. Polymerase chain reaction (PCR) products were separated on a 1% agarose gel, purified using the QIAquick gel extraction kit (Qiagen), and cloned into the pCR4-TOPO vector (Invitrogen, Life Technologies) for sequencing. Primers are listed in supplemental Table 1, available on the Blood Web site. Primers were designed using Primer Express 2.0 software (Applied Biosystems).
qRT-PCR
RNA was isolated from 106 K562 or cord blood CD34+ cells with the RNeasy mini kit. RNA (1 μg) was treated with DNAse I for 15 minutes at 25°C and reverse transcribed using SuperScript III first-strand synthesis system following manufacturer’s instructions. Quantitative reverse transcription PCR (qRT-PCR) was performed using SYBR chemistry (IQ SYBR Green Supermix; BioRad) in the ABI 7900HT system (Applied Biosystems). Data were normalized to the actin signal. Relative enrichment of complementary DNA was calculated against a genomic DNA standard by the comparative Ct method. Primers specific for Aγ- and Gγ-globin genes were from intron 2 sequences of each gene. Primers are listed in supplemental Table 1.
BGLT3 RNA subcellular localization
Nuclear and cytoplasmic RNAs were extracted using Trizol (Invitrogen) and Nucleospin RNA II (Clontech) according to manufacturers’ protocols, with minor modification. 107 cells were washed with ice-cold phosphate-buffered saline and lysed with 500 μL of hypotonic lysis buffer (25 mM of HEPES, 2 mM of EDTA, 0.5% Tween 20 in DEPC water). Cytoplasmic and nuclear fractions were obtained by centrifugation at 700 ×g of 1.5 mL of Trizol, and 400 μL of chloroform was added to each fraction. The aqueous phase containing RNA was used for further purification with Nucleospin RNA II. Primers are listed in supplemental Table 1.
ASO studies
Locked nucleic acid antisense oligonucleotides (ASOs) to reduce BGLT3 RNA were designed using Exiqon software (www.exiqon.com), and the predesigned negative control A gapmer was used (Exiqon). The Nucleofector system (Lonza) was used following manufacturer’s instructions (Lonza). K562 cells were transfected with ASO vectors at a final concentration of 2 µM using kit V and program T-016. Cells were harvested for analysis 72 hours post transfection. Human umbilical cord CD34+ cells (Lonza) were transfected with ASO vectors on day 9 of culture at a final concentration of 500 nM using the CD34+ kit and program U-008. Cells were harvested for analysis 48 hours postelectroporation.
ChIP
Chromatin immunoprecipitation (ChIP) was performed as described.31 Samples were amplified by real-time qPCR using SYBR green chemistry (SYBR Green Supermix) with the ABI 7900HT. The data for histones H3K27ac, H3K4me, H3K4me3, and H3K36me3 were normalized to histone H3 signal. Primers and antibodies are listed in supplemental Tables 1 and 2, respectively.
RNA-ChIP
The RNA ChIP-IT Kit (Active Motif) was used according to the proprietary methods to validate protein-binding partners for the lncRNA BGLT3. Immunoprecipitated RNA was reverse transcribed using the SuperScript III First-Strand Synthesis SuperMix (ThermoFisher Scientific) and analyzed using SYBR green chemistry (SYBR Green Supermix) with the ABI 7900HT. Primers and antibodies are listed in supplemental Tables 1 and 2, respectively.
3C
3C was performed as described.36 Relative crosslinking between the anchor fragment and fragments of interest was analyzed using SYBR green chemistry (SYBR Green Supermix) with the ABI 7900HT. Interaction between 2 fragments within the α-tubulin gene was used as the internal normalization control. Primers are listed in supplemental Table 1.
CRISPR/Cas9 genome editing and CRISPRi
For CRISPR/Cas9 editing, guide RNAs (gRNAs) with the lowest off-target hit scores were selected (http://crispr.mit.edu/) (supplemental Table 1). gRNAs were cloned into pSpCas9(BB)-2A-GFP (PX458; gift of Feng Zhang; Addgene plasmid #48138) as described.37 K562 cells were electroporated with the Nucleofector system kit V, and single-cell clones were isolated after 48 hours of drug selection and FACS ARIA II (BD Bioscience) sorting for EGFP expression. Clonal lines were genotyped using Emerald AMP-GT-PCR master mix (TAKARA) and validated by sequencing. For CRISPRi, stable K562 clones expressing HA-dCAS9 were generated by electroporation (as described for CRISPR/Cas9) with lenti dCAS-VP64_Blast plasmid (gift from Feng Zhang; Addgene plasmid # 61425) in which HA replaced VP64. Selection was with blasticidin for 1 week. HA-dCas9–expressing K562 cells were transfected with lenti Guide-Puro (gift of Feng Zhang; Addgene plasmid #52963).37
Data-sharing statement
Plasmids and cell lines may be obtained from anndean@helix.nih.gov.
Results
BGLT3 encodes a long noncoding nuclear transcript of 1.6 kb that is dynamically cotranscribed with fetal γ-globin genes in erythroid cells in vitro and in vivo
Expression of BGLT3 is erythroid specific and parallels that of the γ-globin genes in various cell models.30,31 To compare BGLT3 and γ-globin transcriptions in an in vivo model, we used transgenic mice carrying human β-globin locus YAC.34 At E10.5, primitive erythroid yolk sac cells transcribed both BGLT3 and γ-globin, as expected, whereas levels of both had decreased strongly in definitive erythroid E12.5 fetal liver cells (Figure 1A). BGLT3 and γ-globin expression kinetics were similar in CD34+ human umbilical cord erythroid progenitor cells, becoming notable by day 11 of differentiation (Figure 1B). Both transcripts also increased in parallel upon hemin treatment of K562 erythroleukemia cells, as did ε-globin transcripts (Figure 1C). BGLT3 transcription was at least 100-fold lower than γ-globin. Double-label RNA FISH analysis of fetal hemoglobin–expressing erythroid cells from patients carrying the 7.2-kb Corfu δβ-thalassemia deletion38 indicated that HBG-transcribing loci almost always (85%) have a BGLT3 signal (Figure 1D). Thus, BGLT3 and γ-globin transcripts are coregulated in a stage-specific fashion in erythroid cells in vitro and in vivo.
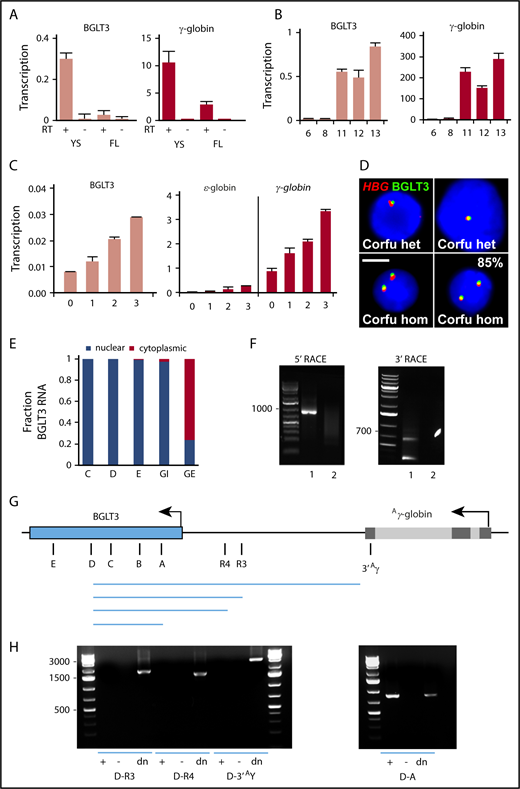
BGLT3 encodes a 1.6-kb transcript that is dynamically cotranscribed with fetal γ-globin genes in erythroid cells in vitro and in vivo. Expression of BGLT3 and γ-globin determined by qRT-PCR in mouse E10.5 yolk sac (YS) and E12.5 fetal liver (FL) (A), CD34+ umbilical cord blood cells during expansion (days 6 and 8) and differentiation in culture (days 11, 12, and 13) (B), and K562 cells during treatment with hemin (C). (D) RNA FISH analysis of fetal hemoglobin–expressing erythroid cells from patients with the Corfu deletion; scalebar, 5 µm. (E) BGLT3 RNA as a fraction of total RNA in K562 nuclear and cytoplasmic fractions determined by qRT-PCR with primer pairs across BGLT3 (panel G shows locations). Intron and exon GAPDH primers (GI, GE) served as control. (F) 5′ and 3′ RACE of messenger RNA from K562 cells; lane 1, RNA; lane 2, control; n = 2 biological replicates. (G) Schematic diagram of Aγ-globin and BGLT3. Black lines show location of primers for panels E and H and Figures 3 and 5. (H) PCR products generated with (+) or without (−) complementary DNA or genomic DNA (dn) from differentiated (day 11) CD34+ cells. Primer sequences listed in supplemental Table 1. het, heterozygous carrier; hom, homozygous patient; RT+/−, with or without reverse transcriptase.
BGLT3 encodes a 1.6-kb transcript that is dynamically cotranscribed with fetal γ-globin genes in erythroid cells in vitro and in vivo. Expression of BGLT3 and γ-globin determined by qRT-PCR in mouse E10.5 yolk sac (YS) and E12.5 fetal liver (FL) (A), CD34+ umbilical cord blood cells during expansion (days 6 and 8) and differentiation in culture (days 11, 12, and 13) (B), and K562 cells during treatment with hemin (C). (D) RNA FISH analysis of fetal hemoglobin–expressing erythroid cells from patients with the Corfu deletion; scalebar, 5 µm. (E) BGLT3 RNA as a fraction of total RNA in K562 nuclear and cytoplasmic fractions determined by qRT-PCR with primer pairs across BGLT3 (panel G shows locations). Intron and exon GAPDH primers (GI, GE) served as control. (F) 5′ and 3′ RACE of messenger RNA from K562 cells; lane 1, RNA; lane 2, control; n = 2 biological replicates. (G) Schematic diagram of Aγ-globin and BGLT3. Black lines show location of primers for panels E and H and Figures 3 and 5. (H) PCR products generated with (+) or without (−) complementary DNA or genomic DNA (dn) from differentiated (day 11) CD34+ cells. Primer sequences listed in supplemental Table 1. het, heterozygous carrier; hom, homozygous patient; RT+/−, with or without reverse transcriptase.
BGLT3 is unidirectionally transcribed from the same strand as the β-globin RNAs and is associated with chromatin.5 In accordance, we observed BGLT3 RNA only in the K562 nuclear fraction using GAPDH intronic and exonic transcripts as controls for nuclear and cytoplasmic fractions, respectively (Figure 1E). To map the ends of the BGLT3 transcript, we performed RACE using primers within BGLT3. 5′ and 3′ RACE revealed major bands (Figure 1F), which, when cloned and sequenced, indicated that the primary BGLT3 transcript is 1684 nt in length, begins 690 bp upstream of the annotated sequence, and terminates at the reported poly(A) site (GenBank AY034471; with a potential minor additional poly(A) site farther downstream).
To confirm these results, we carried out RT-PCR with BGLT3 forward primer D and reverse primers across and upstream of BGLT3 as far as the Aγ-globin 3′ untranslated region using RNA from differentiated CD34+ progenitor cells (Figure 1G-H). Transcription termination in the Aγ-globin gene is weak, and run-on transcripts are known to be produced.39,40 However, we observed no products with reverse primers upstream of the 5′ end of BGLT3 as determined by RACE, supporting the idea that BGLT3 is not part of a read-through transcript from the Aγ-globin gene. The same result was obtained in experiments using RNA from K562 cells (supplemental Figure 1A-B). In agreement, northern blotting showed no evidence in total RNA or poly(A) RNA of K562 cells for substantial stable γ-globin transcripts longer than the canonical 600-nt length (supplemental Figure 1C). These data indicate that BGLT3 is an independent, 1.6-kb nuclear transcript starting 2.3 kb downstream of the Aγ-globin gene.
BGLT3 locus regulates γ-globin expression
To investigate a role for BGLT3 in γ-globin transcription, we deleted the BGLT3 gene by CRISPR/Cas9 gene editing in K562 cells, because stable deletion clones cannot be obtained from primary CD34+ cells (Figure 2A; supplemental Figure 2A-C). HBBP1 is intact in BLGT3 deletion clones. qRT-PCR analysis indicated almost complete loss of BGLT3 transcripts in homozygous deletion clones, with commensurate reduction of γ-globin expression (Figure 2B). Although ε-globin is induced by hemin in K562 cells with the same kinetics as BGLT3 and γ-globin (Figure 1C), deletion of BGLT3 had no effect on ε-globin transcription (supplemental Figure 2D). To investigate whether BGLT3 differentially modulates Aγ-globin (HGB1) and Gγ-globin (HBG2) 2.3 kb and 5.6 kb upstream of BGLT3, respectively, we quantified the expression of their unspliced transcripts by qRT-PCR using gene-specific intronic probes. The relative levels of Gγ- and Aγ-globin nascent transcripts were similarly reduced in K562 cells by BGLT3 deletion, compared with wild-type cells (Figure 2C). Together, these data strongly suggest that the BGLT3 locus specifically contributes to regulation of transcription of both Gγ- and Aγ-globin genes.
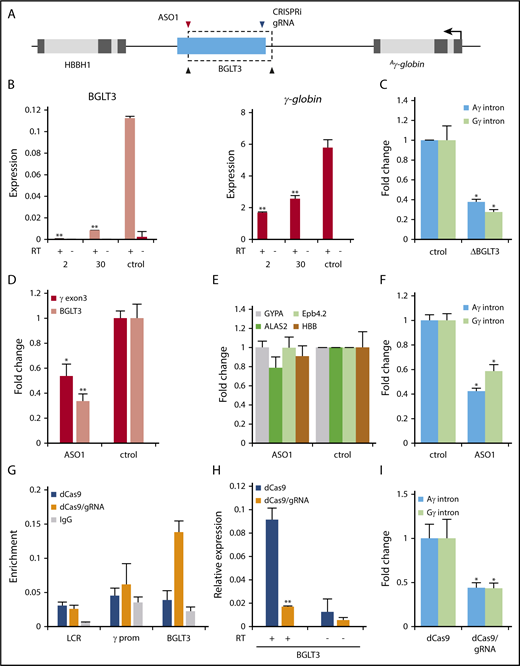
Regulation of γ-globin expression by the BGLT3 locus and transcript. (A) Schematic diagram of BGLT3 deletion (dotted rectangle) generated by CRISPR/Cas9 with gRNAs (black arrows) targeting the 5′ and 3′ ends of the BGLT3 gene. Blue arrow indicates position of gRNA used for CRISPRi. Red arrow indicates position of ASO used to reduce BGLT3 transcript. (B) Expression of BGLT3 and γ-globin in homozygous BGLT3 deletion clones 2 and 30 and control cells (ctrol; no gRNA) determined by qRT-PCR. The results were normalized to actin. (C) Expression of Aγ- and Gγ-globin determined with gene-specific intronic primers for BGLT3-deleted clone 2 compared with control cells. (D) Expression of BGLT3 and γ-globin monitored by qRT-PCR after transfection of CD34+ cells with an ASO directed against BGLT3 or control oligonucleotide. (E) Transcription of erythroid marker genes monitored by qRT-PCR after transfection of CD34+ cells with a BGLT3 ASO or control. (F) Aγ- and Gγ-globin expression using gene-specific intron probes after transfection of CD34+ cells with a BGLT3 ASO or control. (G) ChiP-qPCR was performed with an HA antibody and primers within BGLT3 and at nontargeted control loci 3′ HS1 and the γ-globin promoter. (H) Expression of BGLT3 after CRISPRi and for control cells (no gRNA). (I) Aγ- and Gγ-globin expression using gene-specific intron probes in dCas9 cells and dCas9/BGLT3 gRNA cells. Error bars indicate standard deviation; n = 3 biological replicates. Primer sequences listed in supplemental Table 1; antibodies listed in supplemental Table 2. **P < .01 by Student t test. IgG, immunoglobulin G.
Regulation of γ-globin expression by the BGLT3 locus and transcript. (A) Schematic diagram of BGLT3 deletion (dotted rectangle) generated by CRISPR/Cas9 with gRNAs (black arrows) targeting the 5′ and 3′ ends of the BGLT3 gene. Blue arrow indicates position of gRNA used for CRISPRi. Red arrow indicates position of ASO used to reduce BGLT3 transcript. (B) Expression of BGLT3 and γ-globin in homozygous BGLT3 deletion clones 2 and 30 and control cells (ctrol; no gRNA) determined by qRT-PCR. The results were normalized to actin. (C) Expression of Aγ- and Gγ-globin determined with gene-specific intronic primers for BGLT3-deleted clone 2 compared with control cells. (D) Expression of BGLT3 and γ-globin monitored by qRT-PCR after transfection of CD34+ cells with an ASO directed against BGLT3 or control oligonucleotide. (E) Transcription of erythroid marker genes monitored by qRT-PCR after transfection of CD34+ cells with a BGLT3 ASO or control. (F) Aγ- and Gγ-globin expression using gene-specific intron probes after transfection of CD34+ cells with a BGLT3 ASO or control. (G) ChiP-qPCR was performed with an HA antibody and primers within BGLT3 and at nontargeted control loci 3′ HS1 and the γ-globin promoter. (H) Expression of BGLT3 after CRISPRi and for control cells (no gRNA). (I) Aγ- and Gγ-globin expression using gene-specific intron probes in dCas9 cells and dCas9/BGLT3 gRNA cells. Error bars indicate standard deviation; n = 3 biological replicates. Primer sequences listed in supplemental Table 1; antibodies listed in supplemental Table 2. **P < .01 by Student t test. IgG, immunoglobulin G.
To determine whether the BGLT3 transcript per se is necessary for γ-globin expression, we used ASO technology to reduce BGLT3 RNA levels during differentiation of CD34+ cord blood cells and in K562 cells. BGLT3-specific ASOs effectively reduced BGLT3 transcripts compared with control cells, with concomitant reduction in γ-globin transcription in both types of cells (Figures 2D; supplemental Figure 3A-B). Importantly, BGLT3 ASO treatment did not affect differentiation of CD34+ cells as judged by normal transcription of erythroid marker genes (Figure 2E). Expression of both Aγ- and Gγ-globin genes was reduced by BGLT3 depletion (Figure 2F). These experiments solidify a role for the BGLT3 transcript in positive regulation of γ-globin genes.
To investigate whether the BGLT3 lncRNA is sufficient for transcription activation of γ-globin, we transiently overexpressed BGLT3 in K562 cells. BGLT3 transcripts were significantly elevated over control cells and resulted in increased γ-globin transcription, although the proportional change was less than that for BGLT3 (supplemental Figure 3C). This suggests the BGLT3 RNA is important for γ-globin expression but that the transcript may need to function locally to its site of transcription. When we overexpressed BGLT3 in the background of ∆BGLT3 cells, we found that γ-globin transcription was unaffected compared with ΔBGLT3 control cells. This result indicates that the BGLT3 transcript alone is insufficient to rescue γ-globin transcription and that either the locus sequence or its transcription is also necessary (supplemental Figure 3D).
To distinguish these possibilities, we used a specific gRNA to target HA-dCAS9 to the 5′ end of BGLT3 in K562 cells to prevent transcription elongation through BGLT3 sequences (Figure 2A). Targeting was specific as judged by ChIP using an antibody to the HA tag of dCAS9 (Figure 2G). Transcription of BGLT3 was strongly reduced after dCAS9 targeting (Figure 2H). Transcription of both γ-globin genes was affected by BGLT3 CRISPRi, invoking the importance of transcription of the underlying BGLT3 sequence in γ-globin upregulation (Figure 2I). Finally, overexpression of BGLT3 in the CRISPRi K562 background did not rescue γ-globin transcription (supplemental Figure 3E). Collectively, these experiments show that transcription through the BGLT3 gene and the BGLT3 transcript are both positive regulators of the duplicated γ-globin genes.
BGLT3 coding sequences have enhancer characteristics
Epigenetic modifications across BGLT3 are consistent with potential enhancer function.31,41 Additionally, ChIP studies have identified a site near the 3′ end of BGLT3 that is occupied by members of the LDB1 complex: GATA1, TAL1, and LMO2.31 The LDB1 complex is the primary mediator of enhancer activity in erythroid cells through stabilization of contacts between globin and other erythroid genes and their enhancers.42-44
ChIP indicated that BGLT3 is occupied by CBP/p300, which is enriched at enhancers, to the same extent as the HS2 enhancer in the β-globin LCR (Figure 3A). H3K27ac, which marks both enhancers and promoters, was enriched at the γ-globin promoters and within BGLT3 (Figure 3B). BGLT3 sequences were also enriched for the H3K36me3 transcription elongation-related mark, similar to the LCR and γ-globin promoter (Figure 3C). Next, given that a high H3K4me1/H3K4me3 ratio is a characteristic of enhancers, whereas the reverse is true for promoters,45 we determined the ratio of these histone marks at the BGLT3 locus (Figure 3D). BGLT3 has a sixfold higher H3K4me1/H3K4me3 ratio than does the γ-globin promoter, supporting enhancer function. However, the ratio is not as high as at the β-globin LCR HS2 enhancer. These results indicate that sequences encoding BGLT3 have attributes consistent with enhancer function.
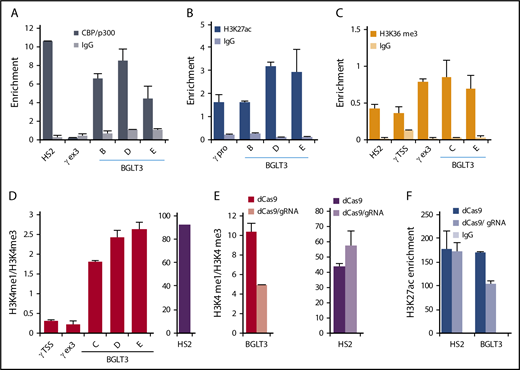
The BGLT3 locus is marked by chromatin signatures associated with enhancers. ChIP-qPCR for K562 cells with primers across BGLT3 using antibodies to CBP/p300 (A), H3K27ac (B), and H3K36me3 (C). (D) Ratio of the H3K4me1/H3K4me3 signal was determined from data obtained by ChIP-qPCR with antibodies to these modifications. Locations of BGLT3 primers are shown in Figure 1G; primer sequences are listed in supplemental Table 1; antibodies are listed in supplemental Table 2. (E) Ratio of the H3K4me1/H3K4me3 signal at BGLT3 or LCR HS2 was determined from data obtained by ChIP-qPCR with antibodies to these modifications using CRISPRi K562 cells targeted with (dCAS9/gRNA) or without (dCAS9) a specific gRNA. (F) ChIP-qPCR with primers for BGLT3 or LCR HS2 and antibodies to H3K27ac using CRISPRi K562 cells with (dCAS9/gRNA) or without (dCAS9) a specific gRNA. IgG, immunoglobulin G.
The BGLT3 locus is marked by chromatin signatures associated with enhancers. ChIP-qPCR for K562 cells with primers across BGLT3 using antibodies to CBP/p300 (A), H3K27ac (B), and H3K36me3 (C). (D) Ratio of the H3K4me1/H3K4me3 signal was determined from data obtained by ChIP-qPCR with antibodies to these modifications. Locations of BGLT3 primers are shown in Figure 1G; primer sequences are listed in supplemental Table 1; antibodies are listed in supplemental Table 2. (E) Ratio of the H3K4me1/H3K4me3 signal at BGLT3 or LCR HS2 was determined from data obtained by ChIP-qPCR with antibodies to these modifications using CRISPRi K562 cells targeted with (dCAS9/gRNA) or without (dCAS9) a specific gRNA. (F) ChIP-qPCR with primers for BGLT3 or LCR HS2 and antibodies to H3K27ac using CRISPRi K562 cells with (dCAS9/gRNA) or without (dCAS9) a specific gRNA. IgG, immunoglobulin G.
Because we had determined that transcription through the BGLT3 locus is required for positive regulation of γ-globin expression, we were interested in whether enhancer characteristics of BGLT3 are dependent on transcription. We determined the ratio of H3K4me/ H3K4me3 in cells where dCAS9 targeting interrupted BGLT3 transcription. Indeed, the ratio of H3K4me1/ H3K4me3 at BGLT3 was reduced by half after dCAS9 targeting, whereas the ratio at LCR HS2 was not significantly affected (Figure 3D). Likewise, H3K27ac was reduced at BGLT3 but not at LCR HS2 after dCAS9 targeting (Figure 3F). Thus, transcription through the BGLT3 locus is associated with maintenance of histone marks associated with enhancer activity driving γ-globin expression.
BGLT3 locus is a positive regulator of γ-globin genes through contributing to chromatin organization and recruitment of RNA Pol II to the γ-globin promoters
The β-globin LCR loops to the γ-globin genes at the developmental stage when they are expressed.26 In this locus, forced looping causes transcription activation.46-48 Therefore, it was surprising that although deletion of BGLT3 reduced γ-globin transcription to 25% to 40% of the wild-type level, 3C analysis showed only minimal effect on interaction between the anchor LCR fragment and the γ-globin genes (Figure 4A). The LCR also contacts BGLT3 sequences,30,31 and this interaction was likewise little affected by BGLT3 deletion. We next used BGLT3 as the anchor fragment, which had revealed loops between BGLT3 and the γ-globin genes in K562 cells and in erythroid progenitor CD34+ cells differentiated to transcribe high levels of γ-globin31 (Figure 4B). Strikingly, this interaction was almost entirely lost upon deletion of BGLT3 sequences from the anchor fragment.
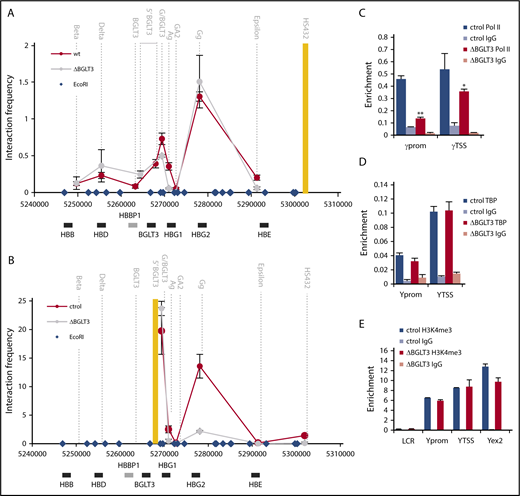
BGLT3 deletion affects interaction of γ-globin genes with BGLT3 but not with the LCR. (A) 3C was carried out for ΔBGLT3 K562 cells and control cells with no gRNA (ctrol). The interaction frequency of each fragment with the LCR anchor fragment (yellow bar) is plotted in the middle of the fragment (dotted vertical lines). Blue diamonds, EcoR1 sites. (B) 3C was carried out as in panel A except the anchor fragment was BGLT3. Primer sequences listed in supplemental Table 1. Note that the Gg primer does not distinguish between Gγ and Aγ, and the values presented represent the average normalized signals from both31 (supplemental Figure 4). (C) Control and ∆BGLT3 K562 cells were subjected to ChiP using antibodies against total RNA Pol II (N20) and primers amplifying regions as indicated below the graph. (D) ChIP was carried out as in panel A with antibodies to TBP. (E) ChIP was carried out as in panel A with antibodies to H3K4me3. The results were normalized to the ChIP signal for total histone H3. Error bars indicate standard deviation; n = 3 biological replicates. **P < .01 by Student t test. Primer sequences are listed in supplemental Table 1; antibodies are listed in supplemental Table 2.
BGLT3 deletion affects interaction of γ-globin genes with BGLT3 but not with the LCR. (A) 3C was carried out for ΔBGLT3 K562 cells and control cells with no gRNA (ctrol). The interaction frequency of each fragment with the LCR anchor fragment (yellow bar) is plotted in the middle of the fragment (dotted vertical lines). Blue diamonds, EcoR1 sites. (B) 3C was carried out as in panel A except the anchor fragment was BGLT3. Primer sequences listed in supplemental Table 1. Note that the Gg primer does not distinguish between Gγ and Aγ, and the values presented represent the average normalized signals from both31 (supplemental Figure 4). (C) Control and ∆BGLT3 K562 cells were subjected to ChiP using antibodies against total RNA Pol II (N20) and primers amplifying regions as indicated below the graph. (D) ChIP was carried out as in panel A with antibodies to TBP. (E) ChIP was carried out as in panel A with antibodies to H3K4me3. The results were normalized to the ChIP signal for total histone H3. Error bars indicate standard deviation; n = 3 biological replicates. **P < .01 by Student t test. Primer sequences are listed in supplemental Table 1; antibodies are listed in supplemental Table 2.
To further examine how the BGLT3 locus might be affecting γ-globin transcription, we determined recruitment of RNA Pol II, TBP, and H3K4me3, the active transcription epigenetic mark, at the γ-globin promoters before and after deletion of BGLT3. Deleting BGLT3 diminished recruitment of RNA Pol II to the γ-globin promoters, consistent with transcription reduction (Figure 4C). However, TBP recruitment and H3K4me3 were not affected by BGLT3 deletion (Figure 4D-E). These results indicate that the γ-globin promoters are not in a closed chromatin state in ∆BGLT3 cells, consistent with maintenance of looping between the γ-globin genes and the LCR. However, the γ-globin genes lose contact with BGLT3 sequences in ΔBGLT3 cells, and there is a defect in RNA Pol II recruitment to the genes. Together, these results show that BGLT3 provides a unique function, beyond the LCR, contributing to γ-globin chromatin organization and RNA Pol II recruitment.
Distinct functions of the BGLT3 locus and transcript
To begin to dissect molecular functions of the BGLT3 locus and transcript in activating γ-globin genes, we examined the effect on looping to the genes after targeting of HA-dCAS9 to the 5′ end of BGLT3. Elimination of transcription through the locus provoked a dramatic reduction of the interaction between BGLT3 and the γ-globin genes (Figure 5A). Next, we reduced only the transcript using ASO KD of BGLT3. Interestingly, the results indicated that the lncRNA product of transcription was not required for this looping (Figure 5B). Thus, 3C reinforces that transcription through the BGLT3 locus is required for looping to the γ-globin genes and for their transcription activation. The BGLT3 lncRNA per se does not contribute to the looping interaction.
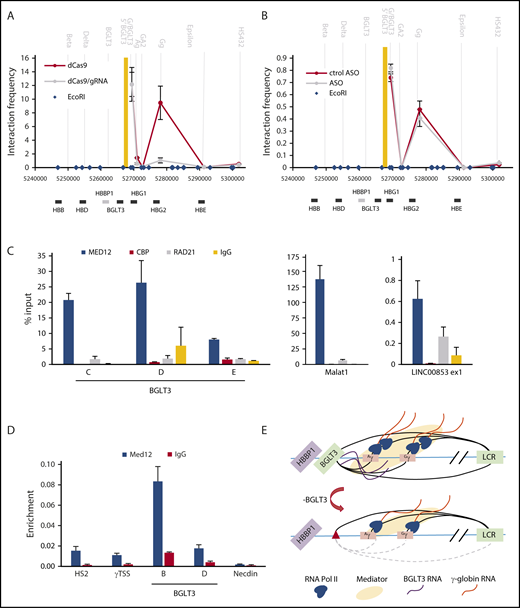
Loss of BGLT3 affects RNA Pol II recruitment to γ-globin genes. (A) 3C was carried out using CRISPRi K562 cells targeted with (dCAS9/gRNA) or without (dCAS9) a specific gRNA with anchor fragment BGLT3. (B) 3C was carried out as in panel A except using K562 cells treated with a BGLT3 specific ASO or a control version (ctrol). Primer sequences are listed in supplemental Table 1. Note that the Gg primer does not distinguish between Gγ and Aγ, and the values presented represent the average normalized signals from both (supplemental Figure 4). (C) RNA-ChIP was carried out using K562 cells and antibodies to CBP, MED12, or RAD21. MALAT1, highly expressed in erythroid cells, and eRNA LINC00853, lowly expressed in K562 cells, served as positive controls for MED12 binding.18,21,55 (D) ChIP-qPCR was carried out for K562 cells with primers across BGLT3 using antibodies to MED12. Locations of BGLT3 primers shown in Figure 1G; primer sequences are listed in supplemental Table 1; antibodies are listed in supplemental Table 2. (E) Model of the BGLT3-containing locus interaction (solid lines) with the γ-globin genes and with the LCR before or after deletion of BGLT3 sequences. Dotted lines represent lost interactions; red triangle represents deletion of BGLT3; wavy orange lines, γ-globin transcripts; wavy purple lines, BGLT3 transcripts.
Loss of BGLT3 affects RNA Pol II recruitment to γ-globin genes. (A) 3C was carried out using CRISPRi K562 cells targeted with (dCAS9/gRNA) or without (dCAS9) a specific gRNA with anchor fragment BGLT3. (B) 3C was carried out as in panel A except using K562 cells treated with a BGLT3 specific ASO or a control version (ctrol). Primer sequences are listed in supplemental Table 1. Note that the Gg primer does not distinguish between Gγ and Aγ, and the values presented represent the average normalized signals from both (supplemental Figure 4). (C) RNA-ChIP was carried out using K562 cells and antibodies to CBP, MED12, or RAD21. MALAT1, highly expressed in erythroid cells, and eRNA LINC00853, lowly expressed in K562 cells, served as positive controls for MED12 binding.18,21,55 (D) ChIP-qPCR was carried out for K562 cells with primers across BGLT3 using antibodies to MED12. Locations of BGLT3 primers shown in Figure 1G; primer sequences are listed in supplemental Table 1; antibodies are listed in supplemental Table 2. (E) Model of the BGLT3-containing locus interaction (solid lines) with the γ-globin genes and with the LCR before or after deletion of BGLT3 sequences. Dotted lines represent lost interactions; red triangle represents deletion of BGLT3; wavy orange lines, γ-globin transcripts; wavy purple lines, BGLT3 transcripts.
The results so far raise the question of the mechanism underlying the contribution of the BGLT3 transcript to γ-globin transcription activation. eRNAs have been reported to interact with epigenetic regulators such as the histone acetyltransferase CBP, with the mediator complex to promote preinitiation complex formation, and with cohesin to influence long-range chromatin interactions.17,18,21,49,50 To investigate whether the BGLT3 transcript interacts with any of these proteins, we carried out RNA-ChIP with antibodies to CBP, mediator component MED12, and cohesin component RAD21. BGLT3 was observed to interact on chromatin with MED12 but not with CBP or RAD21 (Figure 5C).
Earlier reports indicated that MED1 and MED12 occupy the LCR and active β-globin gene in MEL cells and that MED1 occupies the γ-globin promoter in K562 cells.16,51 Interestingly, ChIP revealed that MED12 occupies the LCR and γ-globin gene and is robustly detected at BGLT3 (Figure 5D). Taken together, these data suggest a model in which BGLT3 locus transcription is crucial for its active enhancer function and for looping to the γ-globin genes, juxtaposing BGLT3 and the genes, whereas the BGLT3 lncRNA contributes to γ-globin transcriptional assembly by interacting with mediator (Figure 5E). Both activities may contribute to optimal RNA Pol II recruitment to the promoter of the γ-globin genes.
Discussion
The eRNA subset of lncRNAs has engendered considerable interest because of the potential relationship of these molecules to enhancer long-range activation of target genes. However, mechanistic studies have only begun to dissect the separate or joint functions in gene activation of the eRNA transcript, the gene encoding the transcript, and/or transcription through that gene. Collectively, our data provide evidence that the BGLT3 transcript and transcription through BGLT3 sequences are positive regulators of the duplicated γ-globin genes. The function of BGLT3 is carried out through looping of the locus to the γ-globin genes, which requires its transcription, and through interaction of the BGLT3 lncRNA with MED12 subunit. Both the looping and the mediator interaction may favor RNA Pol II recruitment or stabilization of RNA Pol II at the γ-globin genes. The BGLT3-mediated increase in RNA Pol II density and transcription of the genes, beyond the level contributed by the LCR, support a novel contribution of BGLT3 to γ-globin gene activation.
The BGLT3 gene is closely flanked downstream by the HBBP1 pseudogene. Chromatin interaction profiles revealed that HBBP1 engages in long-range interactions with locus flanking CTCF sites to favor LCR/γ-globin gene contact and transcription in fetal cells or with ε-globin sequences physically separating the LCR and γ-globin genes to disfavor their looping and transcription in adult cells.30 Our precise deletion of BGLT3 in fetal-like K562 cells left HBBP1 intact and had no effect on LCR/γ-globin gene contacts, suggesting that BGLT3 is not contributing to the locus-wide functions of HBBP1 that affect LCR interactions. Rather, 3C visualizes how BGLT3/γ-globin contacts and γ-globin transcription are compromised by BGLT3 deletion. Therefore, reciprocally, the functional importance of BGLT3 for looping to the γ-globin genes cannot be substituted by HBBP1. The specific deletion of each of these elements using different approaches supports their independent function. It seems likely that there are dynamic and independent interactions engaged in by these elements within the complex γ/δ-globin intergenic region, the preponderance of which may determine transcriptional outcome. This issue awaits single-cell structural information for resolution.
Transcription of the BGLT3 locus is required separately from the lncRNA for proper activation of γ-globin genes. Therefore, it is reasonable to propose that transcription through the locus maintains an open chromatin conformation conducive to looping and Pol II recruitment/occupancy at the γ-globin promoters.52 Indeed, targeting HA-dCAS/9 to the locus to interrupt BGLT3 locus transcription resulted in reduced H3K27ac at BGLT3 sequences and a reduced H3K4me1/me3 ratio, indicative of reduced enhancer capacity. This result likely explains why HA-dCAS9 targeting results in loss of looping to the γ-globin genes. Although K562 cells have undetectable BCL11A, we speculate that in vivo, such transcription may also have the consequence of evicting the γ-globin repressor BCL11A from BGLT3 chromatin, which it occupies when γ-globin transcription is repressed in CD34+ cells.31,53
Positive regulation of γ-globin genes by BGLT3 requires its lncRNA product. By contrast, negative regulation of the genes by HBBP1, upstream of BGLT3, does not require its transcript.30 What is the role of the BGLT3 lncRNA? Low copy number eRNAs may be most simply assumed to act locally,5 which is consistent with our observation that BGLT3 regulates the adjacent γ-globin genes but not the more distant ε-globin gene. It has been reported that certain run-on transcripts from the Aγ-globin gene regulate Aγ- but not Gγ-globin.40 The relationship between these transcripts and BGLT3 is unclear, but further mechanistic study is warranted.
Intriguingly, the BGLT3 transcript interacted with mediator MED12 on chromatin. MED12-eRNA interaction correlated with looping of eRNAs to target promoters and their transcription at some loci.18 However, in contrast, we found that the BGLT3 transcript was not required for BGLT3 looping to γ-globin genes. This is consistent with observations that although mediator occupies the β-globin LCR and globin genes when they are active, it is not required to form a loop, at least between the LCR and β-globin gene.16 The BGLT3 transcript interaction with MED12 could initially facilitate local occupancy and later activate γ-globin gene transcription after looping has occurred, by promoting full PIC formation.24,54 Additional mechanistic studies are needed to elucidate how BGLT3 is functionally engaged at multiple levels in enhancer-mediated transcriptional activation.
The online version of this article contains a data supplement.
The publication costs of this article were defrayed in part by page charge payment. Therefore, and solely to indicate this fact, this article is hereby marked “advertisement” in accordance with 18 USC section 1734.
Acknowledgments
The authors thank Benjamin Leadem, Xiang Guo, and Elissa Lei for critical reading of the manuscript and helpful comments. This work was supported by the Intramural Program of the National Institute of Diabetes and Digestive and Kidney Diseases, National Institutes of Health (DK075033; A.D.).
Authorship
Contribution: M.S.I. and A.D. conceived the project; M.S.I., I.K., L.F.D., L.C., and J.L. performed experiments; and M.S.I. and A.D. wrote the paper, which was edited by all authors.
Conflict-of-interest disclosure: The authors declare no competing financial interests.
Correspondence: Ann Dean, Laboratory of Cellular and Developmental Biology, Building 50, Room 3154, 50 South Dr, MSC 8028, Bethesda, MD 20892; e-mail: anndean@helix.nih.gov.

This feature is available to Subscribers Only
Sign In or Create an Account Close Modal