

Key Points
Elevated epigenetic age is associated with an altered hemostatic factor profile and lower clotting time.
DNA methylation age is associated with mRNA levels of fibrinogen in multiple tissues.

Abstract
Many hemostatic factors are associated with age and age-related diseases; however, much remains unknown about the biological mechanisms linking aging and hemostatic factors. DNA methylation is a novel means by which to assess epigenetic aging, which is a measure of age and the aging processes as determined by altered epigenetic states. We used a meta-analysis approach to examine the association between measures of epigenetic aging and hemostatic factors, as well as a clotting time measure. For fibrinogen, we performed European and African ancestry–specific meta-analyses which were then combined via a random effects meta-analysis. For all other measures we could not estimate ancestry-specific effects and used a single fixed effects meta-analysis. We found that 1-year higher extrinsic epigenetic age as compared with chronological age was associated with higher fibrinogen (0.004 g/L/y; 95% confidence interval, 0.001-0.007; P = .01) and plasminogen activator inhibitor 1 (PAI-1; 0.13 U/mL/y; 95% confidence interval, 0.07-0.20; P = 6.6 × 10⁻⁵) concentrations, as well as lower activated partial thromboplastin time, a measure of clotting time. We replicated PAI-1 associations using an independent cohort. To further elucidate potential functional mechanisms, we associated epigenetic aging with expression levels of the PAI-1 protein encoding gene (SERPINE1) and the 3 fibrinogen subunit-encoding genes (FGA, FGG, and FGB) in both peripheral blood and aorta intima-media samples. We observed associations between accelerated epigenetic aging and transcription of FGG in both tissues. Collectively, our results indicate that accelerated epigenetic aging is associated with a procoagulation hemostatic profile, and that epigenetic aging may regulate hemostasis in part via gene transcription.
Introduction
Hemostatic factors are circulating proteins that are critical factors in, or indicators of, the blood clotting/coagulation process. They include, but are not limited to, fibrinogen, factor VII (FVII), factor VIII (FVIII), von Willebrand factor (vWF), plasminogen activator-inhibitor 1 (PAI-1), and D-dimer. Dysregulation and/or deficiency of hemostatic factors can cause bleeding events and thrombotic disorders,1-5 and elevated levels of some hemostatic factors are associated with cardiovascular outcomes such as coronary heart disease,6,7 incident and recurrent myocardial infarction,8-10 peripheral arterial disease,9,11,12 and venous thrombosis.13,14
Advancing age is often associated with an altered hemostatic factor profile typified by heightened plasma concentrations of hemostatic factors such as fibrinogen and coagulation FVII.15-17 This age-associated “prothrombotic” hemostatic profile may contribute to associations between age and cardiovascular disease.18,19 Typically, studies of aging are performed by comparing the hemostatic/clinical profiles of patients with their chronological age. Although effective, this approach does not inform on the underlying biological changes linking aging and altered hemostatic profiles.
Biomarkers of molecular aging have been developed in recent years, using epigenetic20,21 and transcriptomic22 data. In the case of epigenetics, these biomarkers appear to be weakly correlated with telomere length,23-25 a traditional molecular biomarker of aging, and independently associated with both age and mortality.24 Epigenetic age acceleration effects are often tissue specific20,26 and associated with a number of clinical outcomes including mortality,24,27 obesity,26 cancer,28,29 cardiovascular disease,29 HIV-1 infection,30 and traumatic stress.31 However, the association between epigenetic aging biomarkers and hemostatic factors has yet to be investigated.
Here, we present the first study into the relationship between epigenetic aging biomarkers and hemostatic factors. Accelerated epigenetic aging may underlie the association between alterations in the hemostatic profile and aging and reveal novel mechanisms of hemostatic regulation.
Methods
Participating cohorts
A total of 11 studies from the Cohorts for Heart & Aging Research in Genomic Epidemiology (CHARGE) Hemostasis Working Group participated in these analyses (supplemental Table 1, available on the Blood Web site).32 The Framingham Heart Study (FHS) and Cardiovascular Health Study (CHS) contributed multiple sets of data that were analyzed separately. Data sets from CHS were nonoverlapping in participants, whereas data from FHS were longitudinal and collected over the course of 3 consecutive examinations of the Offspring cohort (1991-1995, 1995-1998, and 1998-2001). Plasma levels of 5 hemostatic factors and 1 measure of clotting time were examined (units used for analysis are given in parentheses): fibrinogen (g/L), PAI-1 (U/mL), d-dimer (ng/mL), FVII (%), vWF (%), and activated partial thromboplastin time (aPTT; seconds), selected according to their availability in at least 3 independent cohorts. Fibrinogen and PAI-1 were also assessed in an independent sample of 1427 individuals from the FHS Generation 3 (FHS Gen3) cohort, which were held out of discovery analyses to be used for replication. These samples were treated and analyzed in an identical manner as the discovery FHS samples. A complete description of each study and the methods used to measure each hemostatic factor are given in the supplemental Methods.
Epigenetic aging assessment
All cohorts assessed DNA methylation via the Illumina Infinium HumanMethylation450 array, using methods described in the supplemental Materials. To assess epigenetic aging, an online calculator was used (https://dnamage.genetics.ucla.edu/), which takes as input methylation β values, chronological age, sex, and tissue type and estimates multiple epigenetic aging measures.20 We primarily used 2 epigenetic measures for this analysis, both of which assess deviations of epigenetic age from chronological age: Extrinsic Epigenetic Age Acceleration Difference (EEAD) and Intrinsic Epigenetic Age Acceleration Difference (IEAD). IEAD is a blood-specific measure of aging that adjusts the “standard” tissue agnostic measure20 for the following blood immune cell counts imputed from methylation data: naive CD8+ T cells, exhausted CD8+ T cells, plasma B cells, CD4+ T cells, natural killer cells, monocytes, and granulocytes.33 EEAD is calculated by weighting the global epigenetic age measure by imputed blood immune cell counts, and is thus designed to track aging of the immune system as assessed by DNA methylation changes. The term “difference” in IEAD and EEAD refers to taking the difference between the epigenetic aging measures and chronological age. Differences between epigenetic and chronological age are associated with outcomes such as mortality34 and may indicate accelerated aging. Cell counts for IEAD and EEAD were estimated on the basis of methylation data after the Houseman35 and Horvath36 methods.
As EEAD and IEAD are blood-specific measures, we used age acceleration difference (AAD) to assess differences between epigenetic and chronological age in nonblood tissues (ie, aorta intima-media). AAD is calculated as the difference between the original, tissue agnostic DNA methylation age measure20 and chronological age. AAD and IEAD are correlated in blood.27 For AAD, EEAD, and IEAD, the cohorts performed a common filtering approach used in previous meta-analyses of epigenetic aging measures.27 This approach removed individuals whose sex from their epigenetic profile differed from their reported sex, samples in which the estimated cell type was not peripheral blood, and samples whose correlation with internal standards used by the online calculator was ≤0.80.
Statistical analyses
We used 2 models to understand the relationship between our measures of epigenetic aging and hemostatic factors. For each model, the hemostatic factor was the outcome, whereas the epigenetic aging measure was the predictor. The first model was a basic model that adjusted for chronological age, chronological age squared, and sex. The second (full) model adjusted for the basic model terms plus body mass index (kg/m2), physical activity (active vs inactive), and smoking status (current, former, never). The terms in the full model were chosen to provide an adjustment for potential confounders from lifestyle without including alternative cardiovascular outcomes of interest, such as blood pressure or history of cardiovascular disease, as including these colliders could introduce bias.37 For studies that did not have a specific variable (eg, physical activity), it was left out of the model. The basic model was our primary model, and all cohorts had the complete covariate information necessary for this model.
In FHS, CHS, and ARIC, the epigenetic age measures were based on methylation assessed at a different examination than the hemostatic factor measurement; thus, an age difference term was calculated as the difference between the chronological age at methylation assessment and chronological age when the hemostatic factors were assessed. Linear and quadratic age difference terms were added to the models. We evaluated the effect of this approach on the observed associations by comparing the association between epigenetic age at a single point and the same hemostatic factor assessed over multiple points in FHS. Because FHS had hemostatic measures taken at multiple points but DNA methylation data only at a single point (FHS exam 8), we used the assessment closest to the methylation assessment. For CHS and ARIC, there was a single assessment of DNA methylation and a single assessment of the hemostatic factors available, each performed at a different point. For cohorts with family data only, independent probands were used. The exception to this is the French-Canadian Family study on Factor V Leiden Thrombophilia (F5L), which is a study sample composed of 5 large multigenerational families. For this cohort, family structure was adjusted for in the models via a variance components model implemented in the pedigreemm package in R.38
We used the metafor package39 in R40 to perform meta-analyses. We required that hemostatic factors have at least 3 cohorts reporting for the meta-analysis. For all outcomes except PAI-1, we had both European ancestry and African ancestry cohorts (supplemental Table 1); however, fibrinogen was the only outcome with at least 3 cohorts reporting for both ethnicities. Thus, fibrinogen was the only hemostatic factor for which we performed race-specific meta-analyses. Initial analyses suggested there was some heterogeneity in the European ancestry fibrinogen estimates (Cochran’s Q P value < .05); thus, for fibrinogen, we used a random-effects meta-analysis for the European ancestry and combined ethnicity meta-analyses. For all other analyses, a fixed effects meta-analysis was used, as little evidence of heterogeneity was observed. To facilitate comparison with the fixed effects models for other outcomes, we also performed a fixed effects meta-analysis for fibrinogen as a sensitivity analysis. We considered associations statistically significant after a Bonferroni correction but also report associations that achieved a nominal statistical significance level of P < .05, as these may also be of interest. Previous analyses have observed sex-specific associations with epigenetic aging.27 We used a multiplicative interaction model to determine whether there was an interaction between sex and epigenetic aging measures.
Associations with peripheral blood gene expression
To better understand the role of transcriptional regulation in our associations, we used data from the Cooperative Health Research in the Region of Augsburg S4 examination (KORA S4) and the Rotterdam Study (RS) to examine the association between our epigenetic aging measures and the peripheral blood expression of genes for the significant hemostatic factors. For KORA41 and RS, gene expression was assessed on the Illumina HumanHT-12v3 and Illumina HT-12v4 Expression BeadChip arrays, respectively. Both studies isolated RNA from whole blood, using PAXGene Blood RNA kits (Qiagen, Hilden, Germany). For both cohorts, samples with a RNA quality score lower than 7 were excluded from amplification and analysis, and the final gene expression values were log2-transformed. A total of 731 gene expression samples passed quality control and had epigenetic aging assessed in RS, whereas 439 samples were included in the analysis for KORA S4. Full details are available in the supplemental Materials. In addition to the cross-sectional gene expression analyses performed using gene expression from KORA S4 and RS, we performed a prospective gene expression analysis using KORA F4, as prospective analyses are less influenced by reverse confounding. In this analysis, we examined the association between epigenetic aging measures assessed in KORA S4 samples and gene expression from the same individuals measured during the follow-up KORA F4 study.
We used the same variables for confounder adjustment, in basic and full models, as previously described for all gene expression analyses, and as included terms for RNA integrity number and amplification plate. The log2-transformed gene expression was the outcome in all models. For the cross-sectional analyses in KORA S4 and RS, we examined the results from a fixed-effects meta-analysis. Given the limited number of genes assessed and the high correlation between probes for the same gene, associations were considered significant at the P < .05 level. We refer to the gene expression results according to the study in which the gene expression was assessed; thus, KORA F4 gene expression results refer exclusively to the prospective gene expression analyses, whereas KORA S4 gene expression results refer exclusively to the cross-sectional analyses, using KORA S4 gene expression and epigenetic aging measures.
Aortic intima-media expression
We also examined the association between epigenetic aging and gene expression in aortic intima-media samples to both validate peripheral blood associations and evaluate tissue-specific associations. We used samples from 22 patients with overlapping methylation and gene expression from the Advanced Study of Aortic Pathology biobank. Methylation was assessed on the Illumina Infinium HumanMethylation450 array, and gene expression was assayed using the Affymetrix GeneChip Human Exon 1.0 ST array from RNA isolated using the RNeasy Mini Kit (QIAGEN).42 Full details for the Advanced Study of Aortic Pathology biobank are available in the supplemental Materials. The same adjustment models as before were used, with the exception that amplification plate and RNA Integrity Number were not included; smoking was assessed as current, former, or never; and physical activity was assessed as the number of days exercised per week. Smoking and physical activity were included as linear variables. Clinical covariates for all gene expression analyses are given in supplemental Table 2.
Results
Baseline characteristics of all studies are given in supplemental Table 1. For the discovery analyses, for each of the 5 hemostatic factors examined, we had between 3 and 11 cohorts participating in the meta-analyses. PAI-1 was the only hemostatic factor not measured in any of the African ancestry studies. Distributions of the hemostatic factors were comparable across the ancestries except for the African Americans in ARIC, who had higher d-dimer values and lower FVII values. The age range of participating studies was from 36.9 to 79.1 years, and studies varied from 28.6 to 60.7 in percentage of male participants. The sample size for each of the assessed outcomes ranged from 3875 (aPTT) to 16 545 (fibrinogen). For the replication in the 3rd Generation Framingham Heart Study (FHS Gen3), the mean age was 45.5 years, and 48.6% of the cohort were men. The 2 hemostatic factors assessed in FHS Gen3 were fibrinogen (n = 1388) and PAI-1 (n = 1402). In using FHS to evaluate the assessment of epigenetic age at different points from the hemostatic factor, exam closest in time to the hemostatic measurement had the strongest (by magnitude of the effect estimate) association, but the confidence intervals for all estimates largely overlapped (supplemental Figure 1).
Associations between epigenetic aging and hemostasis measures
We examined 6 outcomes and 2 measures of epigenetic aging in the analyses; thus, the Bonferroni cutoff was set at P < .0042 (0.05/12). Results for all outcomes are given in supplemental Tables 3 and 4, which also contain summary statistics of regressions of the hemostatic factors on AAD for reference purposes. The basic model was considered the primary model on which we based determinations of statistical significance.
PAI-1 was significantly associated with epigenetic age acceleration measures in both the basic and full models (Table 1; Figure 1). Fibrinogen was the most widely available hemostatic factor, with both European ancestry (8 cohorts, n = 13 183) and African ancestry (3 cohorts, n = 3362) cohorts represented. We observed significant associations between both measures of blood DNA methylation age and fibrinogen in the African ancestry cohorts (supplemental Tables 3 and 4). In the combined-ethnicity analyses, we observed a significant association for EEAD and fibrinogen in the basic model, which was attenuated slightly in the full model (Figure 2; Table 1). To facilitate comparison with fixed-effects models used for the other hemostatic factors, we also performed fixed-effects meta-analysis for fibrinogen for both EEAD and IEAD (supplemental Table 5). Results mirrored the random effects meta analyses with slightly smaller standard errors and evidence of heterogeneity in some models. The clotting time measure aPTT was significantly associated with EEAD in the basic model. This association was somewhat attenuated in the full model (Table 1).
Significant meta-analysis associations between accelerated epigenetic aging and hemostatic factors
| Outcome | Aging measure, y | Basic | Full | ||||||||
|---|---|---|---|---|---|---|---|---|---|---|---|
| β | SE | CI | P | P(Q) | β | SE | CI | P | P(Q) | ||
| PAI-1, U/mL | EEAD | 0.18 | 0.04 | 0.11-0.25 | 2.4 × 10⁻⁷ | 0.10 | 0.13 | 0.03 | 0.07-0.20 | 6.6 × 10⁻⁵ | .18 |
| PAI-1, U/mL | IEAD | 0.18 | 0.05 | 0.09-0.27 | 1.4 × 10⁻⁴ | 0.78 | 0.16 | 0.04 | 0.07-0.25 | 2.6 × 10⁻⁴ | .79 |
| Fibrinogen, g/L* | EEAD | 0.01 | 0.002 | 0.002-0.009 | .002 | 0.004 | 0.004 | 0.002 | 9.5E-04 to 0.007 | .01 | .03 |
| aPTT, s | EEAD | −0.02 | 0.01 | −0.04 to −0.007 | .003 | 0.08 | −0.02 | 0.01 | −0.03 to −0.006 | .005 | .12 |
Basic and full model associations for hemostatic factor – epigenetic aging associations that were Bonferroni significant, P < 4.16 × 10⁻³, in the basic model associations. Effect estimates (β) are given per 1 year higher epigenetic age as compared with chronological age. Basic model adjusted for age, age squared, and sex. Full model adjusted for age, age squared, sex, body mass index, physical activity, and smoking. For fibrinogen estimates are given for the random effects meta-analysis.
β, effect estimate; CI, 95% confidence interval; EA, European ancestry population; P(Q), heterogeneity (Cochran’s Q) P value; SE, standard error.
Combined-race meta-analysis
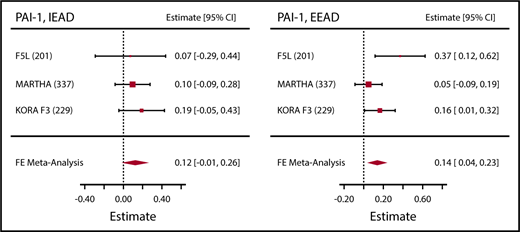
Association between epigenetic aging and PAI-1. Sample sizes are given in parentheses next to the abbreviated cohort names. Effect estimates (Estimate) represent the association per 1 year higher epigenetic age as compared with chronological age, as observed in the full model. FE, fixed effects.
Association between epigenetic aging and PAI-1. Sample sizes are given in parentheses next to the abbreviated cohort names. Effect estimates (Estimate) represent the association per 1 year higher epigenetic age as compared with chronological age, as observed in the full model. FE, fixed effects.
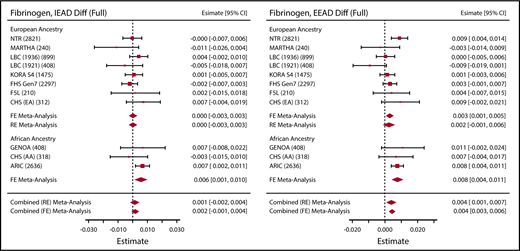
Association between epigenetic aging and fibrinogen. Sample sizes are given in parentheses next to the abbreviated cohort names. Effect estimates (Estimate) represent the association per 1 year higher epigenetic age as compared with chronological age, as observed in the full model. RE, random effects.
Association between epigenetic aging and fibrinogen. Sample sizes are given in parentheses next to the abbreviated cohort names. Effect estimates (Estimate) represent the association per 1 year higher epigenetic age as compared with chronological age, as observed in the full model. RE, random effects.
A summary of all associations is given in Table 2. Overall, accelerated epigenetic aging was associated with higher clotting factor concentration (fibrinogen and PAI-1) and decreased clotting time (aPTT). For fibrinogen and aPTT, associations were attenuated in the confounder-adjusted full model. As a sensitivity analysis, we removed all cohorts with hemostatic measures and DNA methylation arrays not performed on the same sample. This restriction removed all the African American ancestry cohorts and left 7 European ancestry cohorts with fibrinogen measured (N = 6461) and 3 European ancestry cohorts with PAI-1 measured (N = 767). The results were basically unchanged in this sensitivity analysis (supplemental Figures 2 and 3). Despite ARIC having higher values of d-dimer and lower values of FVII than the other cohorts, little to no heterogeneity was seen in the meta-analyses of these outcomes (supplemental Tables 3 and 4). Although all epigenetic aging measures were strongly associated with sex (supplemental Table 6), there were no significant sex interactions in the meta-analysis after a multiple test correction (supplemental Table 7).
Summary of associations with P < .05
| Basic | Full | |||
|---|---|---|---|---|
| EEAD | IEAD | EEAD | IEAD | |
| Fibrinogen* | ++ | + | ||
| PAI-1 | ++ | ++ | ++ | ++ |
| D-dimer | ||||
| FVII | ||||
| vWF | ||||
| aPTT | −− | − | ||
| Basic | Full | |||
|---|---|---|---|---|
| EEAD | IEAD | EEAD | IEAD | |
| Fibrinogen* | ++ | + | ||
| PAI-1 | ++ | ++ | ++ | ++ |
| D-dimer | ||||
| FVII | ||||
| vWF | ||||
| aPTT | −− | − | ||
Overall summary of associations with those Bonferroni significant in either the basic or full model marked. Blank cells indicate outcomes that did not achieve Bonferroni significance in either the basic or full model. Associations that were Bonferroni significant in the basic model but only nominally (P < .05) significant in the full model are marked with a single “+” or “−”. A blank cell indicates that the observed association had P > .05. Effect estimates and P values for all associations are given in supplemental Tables 3 and 4.
AA, African ancestry population; ++(−−), Bonferroni significant positive (negative) association. +(−), nominal (P < .05) significant positive (negative) association.
Combined race random effects meta-analysis.
Replication in FHS Gen3
We used an independent cohort of individuals from FHS Gen3 to attempt to replicate associations with PAI-1 and fibrinogen. We successfully replicated the PAI-1 associations with IEAD and EEAD, but fibrinogen was not associated with epigenetic aging in FHS Gen3 (Table 3).
Results from replication of fibrinogen and PAI-1 in FHS Gen3 cohort.
| Aging measure | Hemostatic factor | Model | β | SE | LCI | UCI | P |
|---|---|---|---|---|---|---|---|
| EEAD | Fibrinogen | Basic | 6.4 × 10⁻³ | 3.4 × 10⁻³ | −3.0 × 10⁻⁴ | 1.3 × 10⁻² | .06 |
| IEAD | Fibrinogen | Basic | 4.0 × 10⁻³ | 4.5 × 10⁻³ | −4.7 × 10⁻³ | 1.3 × 10⁻² | .37 |
| EEAD | Fibrinogen | Full | −8.6 × 10⁻⁵ | 3.2 × 10⁻³ | −6.4 × 10⁻³ | 6.2 × 10⁻³ | .98 |
| IEAD | Fibrinogen | Full | −8.6 × 10⁻⁵ | 4.2 × 10⁻³ | −8.3 × 10⁻³ | 8.1 × 10⁻³ | .98 |
| EEAD | PAI-1 | Basic | 0.17 | 0.05 | 0.07 | 0.28 | .001 |
| IEAD | PAI-1 | Basic | 0.16 | 0.07 | 0.03 | 0.29 | .01 |
| EEAD | PAI-1 | Full | 0.05 | 0.05 | −0.04 | 0.14 | .27 |
| IEAD | PAI-1 | Full | 0.09 | 0.06 | −0.03 | 0.20 | .16 |
All aging measures were assessed in years while fibrinogen was measured in g/L and PAI-1 in U/mL. Replicated associations are given in bold. Basic model adjusted for age, age squared, and sex. Full model adjusted for age, age squared, sex, body mass index, smoking, and physical activity (where available). Additional linear and quadratic time difference terms were included in both models to represent the time between sample collection for the hemostatic factor assessment and assessment of DNA methylation. Effect estimates (β) are given per 1 year higher epigenetic age as compared with chronological age.
LCI, lower 95% confidence interval; UCI, upper 95% confidence interval.
Gene expression analyses
Given the observed associations with fibrinogen and PAI-1, we examined associations between epigenetic aging measures and whole-blood gene expression for the 3 genes (FGA, FGB, FGG) that encode the fibrinogen subunits, as well as SERPINE1, which encodes PAI-1. In a meta-analysis of cross-sectional associations from KORA S4 and RS, we observed associations for FGA and SERPINE1. EEAD was associated with FGA gene expression for both the basic and full models, whereas SERPINE1 was negatively associated with IEAD in the basic model (Table 4).
Association between epigenetic aging and gene expression
| Gene | Aging measure | Estimate | SE | P | Adjustment | P(Q) |
|---|---|---|---|---|---|---|
| Cross-sectional meta-analysis (KORA F4 + RS)* | ||||||
| FGA | EEAD | 0.002 | 0.001 | .05 | Full | 0.10 |
| SERPINE1 | IEAD | −0.002 | 0.001 | .04 | Full | 0.57 |
| Prospective associations (KORA S4)† | ||||||
| FGG | IEAD | 0.004 | 0.002 | .04 | Full | |
| Aorta intima-media (ASAP) | ||||||
| FGG | AAD | 0.009 | 0.004 | .046 | Full |
We examined the association between epigenetic age acceleration and gene expression using both cross-sectional and prospective models in both peripheral blood and aorta intima-media samples. Participating cohort abbreviated names are given in parentheses.
Estimates from the meta-analysis of the cross-sectional associations between epigenetic age acceleration and log2-transformed gene expression for KORA and RS. Both cohorts used different version of the same gene expression microarray, which contained identical gene expression probe designs allowing for direct comparisons.
For the prospective associations, accelerated epigenetic aging was estimated in baseline (KORA S4) samples and gene expression measured in samples collected during follow-up 4 to 5 years later (KORA F4). Only associations with P < .05 in the full (age, age squared, sex, body mass index, smoking, and physical activity) adjusted model are shown. Effect estimates (β) are given per 1 year higher epigenetic age as compared with chronological age. ASAP, Advanced Study of Aortic Pathology biobank.
Given the potential for reverse causation when examining epigenetics and gene expression, we examined, in a prospective model, the association between epigenetic aging assessed in KORA S4 with gene expression measured in KORA F4, a follow-up survey of KORA S4 participants. We did not observe associations with FGA or SERPINE1 in the prospective model, but did observe an association between IEAD and FGG (Table 4).
To understand the tissue specificity of the associations, we examined associations between gene expression and epigenetic aging in aortic intima-media, a second tissue type we had access to that had the necessary DNA methylation and hemostatic factor measurements. All the genes considered are primarily expressed in tissues other than whole blood, as indicated by data from the human genotype tissue expression consortium43,44 (supplemental Figure 4). We only examined AAD in these tissue samples, as EEAD and IEAD are blood-specific measures because of their dependence on blood immune cell counts. We observed an association between AAD and both FGG and FGB gene expression, although the association with FGB was negative. The FGG association was similar to prospective KORA F4 associations with IEAD (Table 4).
Discussion
Hemostatic factors, such as fibrinogen and PAI-1, are risk factors for multiple adverse cardiovascular outcomes.7,9,10,14 As hemostatic factor measures are associated with age, it is possible that age-related biological mechanisms influence the regulation, and thus concentration, of hemostatic factors. Here, our results show that higher epigenetic age as compared with chronological age is associated with higher concentrations of fibrinogen and PAI-1, as well as decreased clotting time. These associations mirror the alterations in the hemostatic profile seen with advancing age. Although coagulation and thrombosis is a balance between pro- and anti-coagulation, as well as pro- and anti-thrombolysis, higher fibrinogen and PAI-1, along with lower clotting time, may indicate a shift toward a “prothrombotic” hemostatic profile.
PAI-1
PAI-1 is a serine protease inhibitor that slows the cleavage of plasminogen to plasmin by inhibiting urokinase plasminogen activator. PAI-1 is a risk factor for cardiovascular disease and thrombosis.45 In mice, PAI-1 deficiencies are protective against liver fibrosis and carotid artery atherosclerosis progression.46,47 However, in humans, individuals homozygous for a PAI-1 frame-shift mutation experienced abnormal bleeding, but no other abnormalities. Heterozygous individuals did not experience abnormal bleeding events.48 Similar to other hemostatic factors, PAI-1 is strongly associated with age and may partly underlie associations between advanced age and cardiovascular outcomes.18 All epigenetic biomarkers of accelerated aging we examined were associated with higher PAI-1 concentrations. We did not find evidence that the epigenetic regulation of PAI-1 is influenced by the regulation of mRNA levels of SERPINE1, its coding gene, as none of the accelerated epigenetic aging measures were associated with SERPINE1 gene expression in peripheral blood or in aortic intima-media. However, this may be a result of SERPINE1 being only moderately expressed in blood as compared with other tissues such as endothelial cells, and arteries, and thus blood transcriptomic levels may not properly reflect PAI-1 regulation.
Fibrinogen
Fibrinogen is an essential hemostatic factor and primary phase inflammation marker. As such, fibrinogen dysregulation plays a causal role in multiple bleeding disorders,49 is a risk factor for cardiovascular disease,6,7 and is associated with mortality.7,50 Fibrinogen was associated with multiple measures of accelerated epigenetic aging, most strongly and consistently with EEAD, which strongly correlates with epigenetic aging of the immune system. We also found evidence that accelerated epigenetic aging was associated with transcription of the fibrinogen gene cluster (FGA, FGB, FGG). As with PAI-1, the associations observed here would be proxies, as fibrinogen is primarily expressed in the liver (supplemental Figure 4). In a study of liver biopsy samples from German individuals with nonalcoholic fatty liver disease and controls (biopsy samples from exclusion of liver malignancy), there was no association between FGA, FGB, or FGG gene expression and Horvath epigenetic age acceleration.26 However, this should still be examined in a population free of disease, as nonalcoholic fatty liver disease is known to affect hemostasis.51,52 In a prospective analysis, higher baseline IEAD was associated with higher levels of FGG transcription at follow-up. This association mirrored cross-sectional associations in aortic tissue where higher AAD, a tissue agnostic epigenetic aging measure correlated with IEAD, was also associated with higher FGG transcription. Given that mortality and other health outcomes have associations with both accelerated epigenetic aging and fibrinogen, future studies should evaluate whether associations between epigenetic aging and health outcomes are partially mediated by fibrinogen.
Strengths and limitations
A strength of these analyses is the large sample size of the discovery data sets. For the analysis of fibrinogen, 11 cohorts participated, including both European- and African-ancestry cohorts, allowing us to estimate ancestry-specific associations. For the other outcomes, we were limited and could not estimate ancestry-specific effects. Future meta-analyses should include cohorts representing a diverse array of ethnicities, particularly underrepresented ancestry groups. Another limitation is the cross-sectional design, which is not robust to reverse confounding as a prospective design would be. However, we demonstrated associations between epigenetic aging and the transcription of FGG using a prospective design that is robust to reverse confounding, suggesting that our observations are not entirely driven by bias introduced from reverse confounding effects. Estimates of the association between epigenetic aging and the hemostatic factors were in many cases modest. This is to be expected, given other modest associations between DNA methylation age and outcomes such as mortality,27 although it does not eliminate the possibility of substantial increased population health burden from modest individual effects, or large individual effects for persons with severe epigenetic aging.
Another strength of this study was our ability to evaluate associations between accelerated epigenetic aging and gene expression in multiple human tissues. This yielded important clues into the links between accelerated epigenetic aging and transcriptomic regulation of the genes for PAI-1 and fibrinogen. Notably, we were also able to use prospective analyses, which are robust to reverse confounding, to show that associations in blood are similar to those observed in aortic intima-media tissue. We were limited in our analysis of epigenetic aging in aorta intima-media tissue, as we had only a few samples (N = 22). Expanding both the number of samples and the diversity of tissues should be a key focus for future studies, particularly given the tissue-specific nature of both DNA methylation and gene expression. These studies should particularly collect tissue samples in which the hemostatic measures are primarily expressed, such as liver for fibrinogen.
In conclusion, we observed multiple associations between epigenetic markers of accelerated aging and hemostatic factors, which together suggest that accelerated epigenetic aging is associated with a prothrombotic hemostatic profile. Advanced age has long been associated with a prothrombotic state, which may underlie associations between age and clinical outcomes, and these analyses suggest that DNA methylation may play an important role in understanding associations between aging, hemodynamics, and clinical outcomes. In the case of fibrinogen, we found evidence that accelerated aging drives gene transcription in multiple tissue types. Given these observations, as the overlap between the outcomes associated with hemostatic factors and those associated with epigenetic aging increase, researchers should evaluate whether altered hemostatic regulation is a means by which epigenetic aging associates with adverse health outcomes.
The online version of this article contains a data supplement.
The publication costs of this article were defrayed in part by page charge payment. Therefore, and solely to indicate this fact, this article is hereby marked “advertisement” in accordance with 18 USC section 1734.
Acknowledgments
The authors thank the families that participated in the Genetic Epidemiology Network of Arteriopathy study.
The work was supported by the Swedish Research Council (12660), the Swedish Heart-Lung Foundation (201202729), the Leducq Foundation (MIBAVA, 12CVD03), Fundació La Marató de TV3 (20151332), and a donation by Fredrik Lundberg. Infrastructure for the CHARGE Consortium is supported in part by National Institutes of Health (NIH), National Heart, Lung, and Blood Institute (NHLBI) grant R01HL105756. The CHARGE Hemostasis Working Group and aspects of this paper were in part supported by NIH grant R01HL134894. The CHS research was supported by NIH, NHLBI contracts HHSN268201200036C, HHSN268200800007C, N01HC55222, N01HC85079, N01HC85080, N01HC85081, N01HC85082, N01HC85083, and N01HC85086, and NHLBI grants U01HL080295, U01HL130114, K08HL116640, R01HL087652, R01HL092111, R01HL103612, R01HL105756, R01HL103612, R01HL111089, R01HL116747, and R01HL120393 with additional contribution from the NIH, National Institute of Neurological Disorders and Stroke. Additional support was provided through R01AG023629 from the NIH, National Institute on Aging, Merck Foundation/Society of Epidemiologic Research, Laughlin Family, Alpha Phi Foundation, and Locke Charitable Foundation. The provision of genotyping data were supported in part by the National Center for Advancing Translational Sciences, CTSI grant UL1TR001881, and the NIH, National Institute of Diabetes and Digestive and Kidney Disease Diabetes Research Center grant DK063491 to the Southern California Diabetes Endocrinology Research Center. The Framingham Heart Study is funded by National Institutes of Health contract N01-HC-25195. The laboratory work for this investigation was funded by the Division of Intramural Research, NHLBI, NIH, Bethesda, MD. The analytical component of this project was funded by the Division of Intramural Research, NHLBI, and the Center for Information Technology, NIH, Bethesda, MD. A portion of this research used the Linux Cluster for Genetic Analysis, funded by the Robert Dawson Evans Endowment of the Department of Medicine at Boston University School of Medicine and Boston Medical Center. Support for the Genetic Epidemiology Network of Arteriopathy was provided by the NIH, NHLBI (HL054464, HL054457, HL054481, HL100185, HL119443, and HL133221). The KORA study was initiated and financed by the Helmholtz Zentrum München-German Research Center for Environmental Health, which is funded by the German Federal Ministry of Education and Research and by the State of Bavaria. Furthermore, KORA research was supported within the Munich Center of Health Sciences, Ludwig-Maximilians-Universität, as part of LMUinnovativ. This work was undertaken in the University of Edinburgh Centre for Cognitive Ageing and Cognitive Epidemiology, supported by the cross-council Lifelong Health and Wellbeing initiative (MR/K026992/1). Funding from the Biotechnology and Biological Sciences Research Council, the Medical Research Council (MRC), and the University of Edinburgh is gratefully acknowledged. University of Edinburgh Centre for Cognitive Ageing and Cognitive Epidemiology funding supports I.J.D. W.D.H. is supported by a grant from Age UK (Disconnected Mind Project). The MARTHA project was supported by a grant from the Program Hospitalier de Recherche Clinique and the ICAN Institute for Cardiometabolism and Nutrition (ANR-10-IAHU-05). The Human450Methylation epityping was funded by the Canadian Institutes of Health Research (grant MOP 86466) and by the Heart and Stroke Foundation of Canada (grant T6484). The NTR received funding from the BBRMI-NL-financed BIOS Consortium (NWO 184.021.007), and the Netherlands Organization for Scientific Research (genotype/phenotype database for behavior genetic and genetic epidemiological studies; ZonMwMiddelgroot 911–09–032). J.v.D. is supported by ACTION. ACTION receives funding from the European Union Seventh Framework Program (FP7/2007-2013) under grant agreement no 602768. The Rotterdam Study is supported by Erasmus MC (Erasmus Medical Center Rotterdam), the Erasmus University Rotterdam, the Netherlands Organization for Scientific Research, the Netherlands Organization for Health Research and Development, the Research Institute for Diseases in the Elderly, the Ministry of Education, Culture and Science, and the Ministry of Health, Welfare and Sports.
Please see the supplemental Materials for complete cohort-specific acknowledgments.
The views expressed in this publication are those of the authors and do not necessarily represent the views of the National Heart, Lung, and Blood Institute; the National Institutes of Health; the US Department of Health and Human Services; or the US Environmental Protection Agency.
Authorship
Contribution: C.K.W.-C., D.-A.T., S.L.R.K., J.B.J.V.M., A.G.U., O.H.F., F.G., A.D., P.-E.M., J.A.S., N.L.S., and A.P. provided the study concept and design; M.W., P.W., H.P., W.K., D.L., C.L., P.S.W., D.-A.T., W.T., A.C.M., E.B., X.G., B.M.P., N.S., D.I.B., G.W., L.L., S.L.R.K., P.E., A.F.-C., J.S.P., F.G., P.-E.M., E.J.C.d.G., J.A.S., and H.M.B., provided data acquisition; C.K.W.-C., J.E.H., and P.S.d.V. drafted the manuscript; C.K.W.-C., J.E.H., W.D.H., M.A.J., J.A.B., N.S.R., C.J.O., D.-A.T., W.T., A.C.M., E.B., K.L.W., B.M., X.G., B.M.P., N.S., I.J.D., W.Z., E.B.W., J.S.P. A.D.J., P.-E.M., J.M.S., J.A.S., and N.L.S., provided critical revision; C.G., H.P., W.K., C.J.O., D.L., D.-A.T., D.I.B., I.J.D., S.L.R.K., J.B.J.V.M., A.G.U., O.H.F., P.E., A.D.J., F.G., P.-E.M., E.J.C.d.G., J.M.S., J.A.S., and A.P. provided funding; and C.K.W.-C., J.E.H., K.E., M. Germain, J.v.D., W.D.H., M.A.J., J.A.B., M. Ghanbari, L.D., N.S.R., C.L., V.T., K.L.W., B.M., W.Z., E.B.W., P.-E.M., A.D., and H.M.B. provided data analysis/statistics.
Conflict-of-interest disclosure: B.M.P. serves on the DSMB for a clinical trial funded by the manufacturer (Zoll LIfeCor) and on the Steering Committee of the Yale Open Data Access Project funded by Johnson & Johnson. A.D. has received consultancy and research support from Metagenics Inc. (outside the scope of submitted work). Metagenics Inc. had no role in design and conduct of the study; collection, management, analysis, and interpretation of the data; or preparation, review, or approval of the manuscript. The remaining authors declare no competing financial interests.
Correspondence: Cavin K. Ward-Caviness, US Environmental Protection Agency, National Health and Environmental Effects Research Laboratory, Environmental Public Health Division, 104 Mason Farm Rd, Chapel Hill, NC 27517; e-mail: ward-caviness.cavin@epa.gov.

This feature is available to Subscribers Only
Sign In or Create an Account Close Modal