

TO THE EDITOR:
Progressive white matter disease, especially silent cerebral infarction (SCI), is a major problem in sickle cell disease (SCD).1,2 Although the risk of symptomatic ischemic stroke has been reduced by chronic transfusion therapy and hydroxyurea, the prevalence of SCI in SCD patients continues to be 1% to 2% per age year with no plateau.2 Many studies have focused on the structural and hemodynamic aspects of SCI,3-5 but few have examined brain iron accumulation6,7 and its possible role in reinforcing white matter injury. Brain iron has been shown to increase with recurrent ischemia-reperfusion injuries,8,9 chronic hypoxia,10,11 and microvasculature damage,12 which are common conditions in SCD.13,14 As a consequence, excessive brain iron could potentially aggravate white matter damage15,16 and accelerate neurodegeneration.12
To test the hypothesis that brain iron is increased in SCD patients, we compared quantitative susceptibility mapping (QSM)17,18 and R2*-based brain iron quantification in SCD patients and healthy controls. Both magnetic susceptibility (in units of parts per billion [ppb]) and R2* (1/T2*, in units of per second) increase with elevated iron concentration. We also investigated the factors of age, hematological markers, and SCI presence on brain iron deposition.
Three-dimensional magnetic resonance imaging (MRI) images and blood samples were collected from 26 clinically asymptomatic SCD patients (mean age, 24 years; age range, 14-42 years; 11 female; genotype, SS:Sβ0:SC = 19:3:4) and 25 age- and race-matched healthy controls (mean age, 26 years; age range, 14-45 years; 15 female; genotype, AA:AS = 16:9). Five SCD patients were receiving chronic blood transfusions, 2 patients had history of chronic transfusion, and the other 19 were nontransfused patients prescribed hydroxyurea. Comprehensive subject demographics, including transfusion history and somatic iron burdens, are included in supplemental Methods (available on the Blood Web site). MRI scans were performed on a 3T Philips Achieva scanner. Data acquisition included the following: (1) T1-weighted images for anatomical referencing; (2) T2-weighted fluid-attenuated inversion recovery images for the identification of white matter hyperintensities3 ; (3) magnetic resonance angiography for the assessment of vasculopathy; and (4) multiecho gradient echo images for QSM and R2* mapping. All T1, T2, and angiographic images were interpreted by a board-certified neuroradiologist (B.T.) blinded to the disease status. QSM and R2* maps were measured using standard MRI methods detailed in the supplemental Methods. Regions of interest (ROIs) referenced to the splenium of the corpus callosum included bilateral caudate nucleus, putamen, globus pallidus, substantia nigra, red nucleus, and dentate nucleus (supplemental Figure 1).
The effects of age (log transformed) and sex were removed from the entire cohort by linear regression prior to group comparisons with unpaired Student t tests. Complete step-wise multivariate regression was performed for each brain region using the following independent variables: age, sex, peripheral oxygen saturation, hemoglobin, the product of oxygen saturation and hemoglobin, hematocrit, hemoglobin S (HbS)–containing cells (%), fetal hemoglobin, cell-free hemoglobin, mean corpuscular volume, white blood cell count, reticulocytes, and lactate dehydrogenase. Additional details on statistical analysis are presented in the supplemental Methods. The study was approved by the Institutional Review Board at Children's Hospital Los Angeles (CCI#11-00083).
Susceptibility values increased significantly with age in all deep gray matter ROIs (supplemental Figure 2). R2* measurements exhibited a similar pattern in all ROIs except the caudate nucleus (supplemental Figure 3). No effect of sex was observed on the susceptibility or R2* measurement of any ROI. Susceptibility measurements were found to be significantly higher in the SCD patient group in the regions of putamen, substantia nigra, and red nucleus after controlling for age and sex (Figure 1A). Effect sizes of the disease on susceptibility measurements, represented by Cohen’s d value, ranged from 0.70 to 0.86. R2* values were significantly higher in the substantia nigra and the dentate nucleus (Figure 1A). No group difference was observed in the other nuclei. Qualitative comparison of susceptibility and R2* maps is illustrated in Figure 1B.
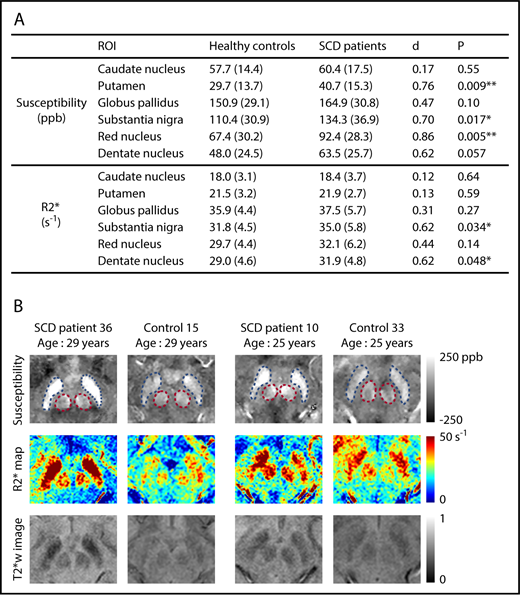
SCD patients exhibit higher susceptibility and R2* in multiple subcortical nuclei, compared with age-matched controls. (A) Average susceptibility (ppb) and R2* (per second) of deep gray matter ROIs in SCD patients and healthy controls. Values are reported as mean (standard deviation). All values were corrected for age and sex; d is Cohen’s effect size, which is defined as the difference between group means divided by the pooled standard deviation. **P < .01; *P < .05. (B) Examples of susceptibility and R2* maps in the regions of substantia nigra and red nucleus. Susceptibility maps (top), R2* maps (middle), and T2*-weighted images at an echo time of 20 ms (bottom) are shown. Blue and pink dashed boxes highlight the regions of substantia nigra and red nucleus, respectively. The left 2 columns compare an SCD patient with a control, both of whom are 29 years old, and the right 2 columns compare 2 subjects who are both 25 years old.
SCD patients exhibit higher susceptibility and R2* in multiple subcortical nuclei, compared with age-matched controls. (A) Average susceptibility (ppb) and R2* (per second) of deep gray matter ROIs in SCD patients and healthy controls. Values are reported as mean (standard deviation). All values were corrected for age and sex; d is Cohen’s effect size, which is defined as the difference between group means divided by the pooled standard deviation. **P < .01; *P < .05. (B) Examples of susceptibility and R2* maps in the regions of substantia nigra and red nucleus. Susceptibility maps (top), R2* maps (middle), and T2*-weighted images at an echo time of 20 ms (bottom) are shown. Blue and pink dashed boxes highlight the regions of substantia nigra and red nucleus, respectively. The left 2 columns compare an SCD patient with a control, both of whom are 29 years old, and the right 2 columns compare 2 subjects who are both 25 years old.
In the multivariate analysis, log-transformed age was the strongest predictor for the susceptibility and R2* measurements. Besides age, significant negative correlation with hemoglobin was found in the susceptibility measurements of substantia nigra, red nucleus, and dentate nucleus (Figure 2A). The product of hemoglobin and peripheral oxygen saturation (as a surrogate for oxygen content) did not strengthen the association of susceptibility with hemoglobin. Susceptibility and R2* values of the substantia nigra and red nucleus also showed negative correlation with hematocrit and positive correlation with HbS-containing cells, but they are not shown because these variables were highly correlated with hemoglobin. Susceptibility of the caudate nucleus, putamen, or globus pallidus did not correlate with any laboratory measurement.
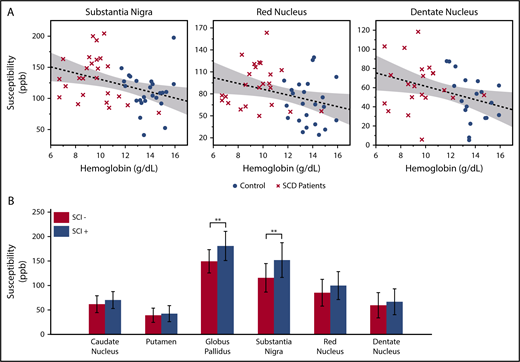
Susceptibility values of multiple subcortical nuclei correlate with hemoglobin and white matter damage. (A) Age corrected susceptibility measurements present significant negative correlation with hemoglobin in substantia nigra (P = .008, r2 = 0.14), red nucleus (P = .028, r2 = 0.10), and dentate nucleus (P = .023, r2 = 0.13). Dotted lines show the linear regression of the data, and shaded areas delimit the 95% confidence interval. (B) Susceptibility of the globus pallidus and substantia nigra (after correction for age and sex) is higher in SCD patients with silent infarcts (SCI+), compared with patients with normal appearing white matter (SCI−). Mean and standard deviation of globus pallidus susceptibility are 180.5 ± 29.8 ppb in the SCI+ group and 149.3 ± 23.7 ppb in the SCI− group. **P = .007. Mean and standard deviation of substantia nigra susceptibility are 151.7 ± 35.5 ppb in the SCI+ group and 115.3 ± 29.1 ppb in the SCI− group. **P = .010
Susceptibility values of multiple subcortical nuclei correlate with hemoglobin and white matter damage. (A) Age corrected susceptibility measurements present significant negative correlation with hemoglobin in substantia nigra (P = .008, r2 = 0.14), red nucleus (P = .028, r2 = 0.10), and dentate nucleus (P = .023, r2 = 0.13). Dotted lines show the linear regression of the data, and shaded areas delimit the 95% confidence interval. (B) Susceptibility of the globus pallidus and substantia nigra (after correction for age and sex) is higher in SCD patients with silent infarcts (SCI+), compared with patients with normal appearing white matter (SCI−). Mean and standard deviation of globus pallidus susceptibility are 180.5 ± 29.8 ppb in the SCI+ group and 149.3 ± 23.7 ppb in the SCI− group. **P = .007. Mean and standard deviation of substantia nigra susceptibility are 151.7 ± 35.5 ppb in the SCI+ group and 115.3 ± 29.1 ppb in the SCI− group. **P = .010
Compared with patients with normal appearing white matter (SCI−), patients with silent infarcts (SCI+) exhibited higher susceptibility in all gray matter nuclei, but only the globus pallidus and substantia nigra reached statistical significance (Figure 2B). R2* measurement of the substantia nigra also had higher values in the SCI+ group (SCI+: 37.5 ± 5.5/s; SCI−: 32.5 ± 5.0/s; P = .022, not shown). There was no significant difference of R2* between the 2 patient subgroups in the other gray matter structures.
This study is the first systematic assessment of brain iron deposition in patients with SCD across a broad range of ages. We did not observe increased brain iron in children, consistent with prior abstracts,6,7 but differences became apparent in middle age. Although no effect of sex was observed, we might be underpowered to detect sex differences because of the small sample size. Although 5 out of 26 patients had significant transfusional iron overload, brain iron levels were independent of somatic iron burden.
Low hemoglobin and presence of SCI are associated with small-vessel disease and regional cerebral hypoxia5,19 in SCD patients. Hypoxia is a well-known stimulus for brain iron uptake.9-11 The correlation between brain iron with hemoglobin and with SCI suggests that brain iron may be a biomarker of cerebral hypoxic exposure. However, we could not completely exclude the possibility that the relationship between susceptibility measurements and hemoglobin levels represented a group effect. In the present study, anemia and SCD severity were inexorably linked; future studies using non-SCD anemia patients are needed to determine whether anemia, itself, is associated with elevated brain iron.
In such an early stage of investigation, it is impossible to know whether the increased brain iron deposition represents an incidental biomarker of SCD severity or reinforces cerebral damage or neurocognitive dysfunction. To place our observations in context, the amounts of increased substantia nigra susceptibility and R2* in the SCI+ patient group are comparable to those observed in patients with symptomatic Parkinson disease.20,21 In Parkinson disease and other brain iron disorders, iron accelerates neurological degeneration by exacerbating ischemia-reperfusion injury and neural inflammation, even though iron dysregulation is not the primary disease process. Iron-chelation therapy using deferiprone has been shown to improve neurological function in Parkinson disease,22 Friedreich ataxia,23 and pantothenate kinase deficiency.24 Thus, we believe it is critical to determine the functional role of brain iron in SCD and other anemia syndromes, because it is potentially treatable if it contributes to the progressive neurological complications observed in these patients.
In summary, SCD patients demonstrated increased brain iron accumulation in multiple subcortical nuclei compared with age- and ethnicity-matched control subjects. Iron concentrations in the substantia nigra, red nucleus, and dentate nucleus negatively correlated with hemoglobin, suggesting potential interaction between iron metabolism and chronic hypoxia in the brain. Substantia nigra and globus pallidus iron was elevated in patients with SCI, consistent with an ischemic etiology. Future studies will focus on the functional correlates of brain iron in SCD patients as well as additional clinical predictors.
The online version of this article contains a data supplement.
Acknowledgments
The authors thank Anna Lopez for her assistance with the manual corrections on anatomical labels and Bertin Valdez for patient recruiting, schedule management, and assistance with data collection.
This work was supported by grants from the National Institutes of Health (NIH), National Heart, Lung, and Blood Institute (1U01HL117718-01, 1R01HL136484-01A1, and a Minority Supplement to grant 1U01HL117718-01); the NIH, National Institute of Diabetes and Digestive and Kidney Diseases (1R01DK097115-01A1); the NIH, National Center for Advancing Translational Sciences (5UL1TR000130-05) through the Clinical Translational Science Institute at Children’s Hospital Los Angeles; the NIH, National Institute of Neurological Disorders and Stroke (R01NS074980); the NIH Predoctoral Training in Interdisciplinary Neurosciences (1T32MH111360-1A1) from the National Institute of Mental Health; and the NIH, National Institute of Environmental Health Sciences (R01ES024936). Philips Healthcare provided support for protocol development and applications engineering on a support-in-kind basis.
X.M. is a PhD candidate at University of Southern California. This work is submitted in partial fulfillment of the requirement for the PhD.
Authorship
Contribution: X.M., T.D.C., and J.C.W. designed the experiments; X.M., S.C., B.T., Y.C., and C.V. collected the data; X.M., S.C., and B.T. analyzed the data; and X.M., S.C., T.D.C., and J.C.W. interpreted the data and prepared the manuscript.
Conflict-of-interest disclosure: J.C.W. receives research support in kind from Philips Healthcare. The remaining authors declare no competing financial interests.
Correspondence: John C. Wood, Division of Cardiology, Children’s Hospital Los Angeles, 4650 Sunset Blvd, MS 34, Los Angeles, CA 90027; e-mail: jwood@chla.usc.edu.

This feature is available to Subscribers Only
Sign In or Create an Account Close Modal