Key Points
HTS identifies MRD at the conventional clinical cutoff in more patients than FC, and these patients have worse outcomes.
A subset of B-ALL patients essentially cured using current chemotherapy is identified at end of induction by HTS.
Abstract
Early response to induction chemotherapy is an important prognostic factor in B-lymphoblastic leukemia (B-ALL). Here, we compare high-throughput sequencing (HTS) of IGH and TRG genes vs flow cytometry (FC) for measurable residual disease (MRD) detection at the end of induction chemotherapy in pediatric patients with newly diagnosed B-ALL. Six hundred nineteen paired pretreatment and end-of-induction bone marrow samples from Children’s Oncology Group studies AALL0331 (clinicaltrials.gov #NCT00103285) (standard risk [SR]; with MRD by FC at any level) and AALL0232 (clinicaltrials.gov #NCT00075725) (high risk; with day 29 MRD <0.1% by FC) were evaluated by HTS and FC for event-free (EFS) and overall survival (OS). HTS and FC showed similar 5-year EFS and OS for MRD-positive and -negative patients using an MRD threshold of 0.01%. However, there was a high discordant rate with HTS identifying 55 (38.7%) more patients MRD positive at this threshold. These discrepant patients have worse outcomes than FC MRD-negative patients. In addition, the increased analytic sensitivity of HTS permitted identification of 19.9% of SR patients without MRD at any detectable level who had excellent 5-year EFS (98.1%) and OS (100%). The higher analytic sensitivity and lower false-negative rate of HTS improves upon FC for MRD detection in pediatric B-ALL by identifying a novel subset of patients at end of induction who are essentially cured using current chemotherapy and identifying MRD at 0.01% in up to one-third of patients who are missed at the same threshold by FC.
Introduction
B-lymphoblastic leukemia (B-ALL) is the most common malignancy of childhood and also one of the most successfully treated because of advances in empirically developed combination chemotherapy regimens over the past 50 years.1-3 Current therapeutic regimens result in long-term survival of >85% of affected individuals.2-6 An important prognostic factor in the outcome for patients with B-ALL is the initial response to therapy as determined by the level of “measurable” also referred to as “minimal” residual disease (MRD) at the end of combination chemotherapeutic induction therapy.2,7,8 At this time point, 98% to 99% of patients are in clinical remission with >5% blasts by morphologic examination of a bone marrow sample. More sensitive measurement of end-of-induction (EOI) response is currently achieved through the use of multiparametric flow cytometry (FC) and/or allele-specific oligonucleotide polymerase chain reaction (ASO-PCR), which is used in clinical practice and research trials by many study groups to evaluate postinduction therapeutic response. The analytic sensitivity for FC is conventionally 0.01% depending on the immunophenotype of the neoplastic lymphoblast, the background of regenerating hematogones, and, of course, the number of cells available for analysis. The analytic sensitivity of molecular monitoring by ASO-PCR is ∼10-fold higher at ∼0.001%, but requires the customized development and validation of patient-specific probes. It is therefore less comprehensive and inherently less standardizable than the high-throughput sequencing (HTS) method described in this study. In addition, comparisons of HTS with ASO-PCR have demonstrated the superiority of the HTS method.9-12
In recent studies, the MRD threshold of 0.01% of nucleated mononuclear cells by FC has been shown by the Children’s Oncology Group (COG) and others to be the single most predictive marker for identifying patients who have a worse clinical outcome and who may benefit from more intensive or alternate therapy.13,14 Although FC has proven clinical utility in guiding therapeutic decisions, is rapid, and can be applied to ∼100% of patients, it has limitations. First, the analytic sensitivity is difficult to extend past 0.01% unless a significantly greater number of events are acquired,15 which may not be practical or routinely achievable. Second, clinical standardization of the assay for MRD detection has been challenging because it can be dependent on hard-to-qualify reagents and individual operator technique. Third, antigen expression of leukemic B lymphoblasts may change posttherapy obscuring phenotypic MRD detection by FC. For example, some leukemic clones can have significant antigenic change posttreatment such that FC may miss detection of these clones posttreatment.16 Moreover, recent immunotherapeutic approaches in B-ALL, including the use of chimeric antigen receptor T cells or monoclonal antibodies that target B-cell lineage antigens commonly used in MRD assessment by FC, such as CD19 and CD22,17,18 make FC detection of MRD challenging when these antigens may be selected against by the therapy itself.
The feasibility of using HTS of immunoglobulin and T-cell receptor loci for the determination of MRD in acute lymphoblastic leukemia (ALL) has been demonstrated.19-21 However, the clinical significance of these studies was not definitively demonstrated because of a lack of clinical outcome data. A few studies have since evaluated the relationship between B-ALL MRD detected by immunosequencing and clinical outcome in relatively small or select patient populations.22-24
In this study, we compared MRD detection by HTS and FC at the EOI with clinical outcome in a large retrospective cohort of pediatric B-ALL nearly equally derived from COG standard-risk (SR) (AALL0331) and high-risk (AALL0232) trials. We investigated the ability of HTS to risk-stratify children with B-ALL at the EOI in comparison with FC, evaluated the significance of MRD discordance between HTS and FC, and assessed the impact of increased MRD sensitivity on risk group assignment, and outcome.
Methods
Clinical samples
Paired pretreatment and EOI (day 29) samples from 619 patients enrolled in the (COG) trials AALL0331 (SR B-ALL, N = 304) (clinicaltrials.gov #NCT00103285) or AALL023225 (high-risk B-ALL, N = 315) (clinicaltrials.gov #NCT00075725) were identified from the COG tissue bank for immunosequencing analysis. Patients from the “high-risk” protocol AALL0232 were not included if they had either ≥0.1% leukemic blasts by prior FC measured at the EOI or, from either protocol, if there was insufficient residual banked material. All patients had a diagnosis of B-ALL established locally, with pre- and posttreatment bone marrow aspirate samples submitted for flow cytometric MRD analysis to either the University of Washington or Johns Hopkins University reference laboratories, as required by the treatment study protocol. In parallel, additional aliquots of bone marrow were sent at both time points to the COG tissue repository (Columbus, Ohio) and stored at −20°C. These banked samples were subsequently sent to Adaptive Biotechnologies (Seattle, Washington) for DNA extraction and immunosequencing.
FC
Multiparametric FC was performed as described.26 Briefly, samples were stained with 2 different 6-color antibody combinations (CD20-FITC/CD10-PE/CD38-PerCPCy5.5/CD19-PECy7/CD58-APC/CD45-APCH7 and CD9/CD13+33/CD34/CD19/CD10/CD45). A third tube with SYTO-16 was used for quantification of nucleated cells. A target of 750 000 events was analyzed per reagent combination, resulting in analytic sensitivity of at least 0.01% in >95% of cases and MRD reported as a percentage of leukemic cells of nucleated mononuclear cells.
HTS
IGH and TRG CDR3 regions were amplified and sequenced from 400 ng of pretreatment and up to 8 µg of day 29 postinduction DNA samples (∼60% had the full 8 μg), or, in a subset of cases (∼40%), using all available extracted DNA (range of DNA: 407 ng to 8 µg). Amplification and sequencing of IGH and TRG CDR3 regions were carried out using the ImmunoSEQ platform (Adaptive Biotechnologies, Seattle, WA), as described.19,20,27 Briefly, these assays use multiplexed forward primers matching V and D (IGH) or V alone (TRG) segment sequences combined with reverse primers matching J gene segment sequences to amplify both VDJ and DJ IGH rearrangements and VJ TRG rearrangements. Sequencing was performed from the J gene segment and extending through the CDR3 region into FR2. Sequences for IGH CDR3 regions were delineated according to criteria established by the International ImMunoGeneTics.28,29 Potential bias in this multiplex PCR assay was addressed as previously described.27
Clonality assessment and sequence tracking
IGH and TRG sequences from the pretreatment samples of all patients were assessed for clonality with dominant index sequence(s) defined as meeting all of the following 4 criteria: (1) ≥5% frequency within all the recombined molecules of the assay, (2) ≥1% frequency within all the input cells (as determined by total input DNA), (3) ≥200 observed templates in the reaction, and (4) sufficient separation in distribution of each trackable sequence from lower-frequency sequences, defined by there being no >4 sequences in the decade of frequency below the dominant sequence(s). These metrics were applied to all putative dominant sequences (based on the first 3 criteria), starting with the highest-frequency sequence and working iteratively down in frequency until the conditions were not met for a given sequence. When this occurred, the given sequence and all sequences lower in frequency were not considered to be dominant. Estimated template numbers of sequences from 2 different loci in the diagnostic samples were required to be within fivefold of each other for both to be considered “dominant.” In that situation, the generally more unique IGH sequence was used as the value of the subsequent MRD evaluation.
In the postinduction samples, MRD was identified by searching for index sequences identical to previously defined dominant CDR3 sequences from the pretreatment samples, requiring a complete nucleotide sequence match. The presence and the frequency of this clone relative to total nucleated cells were determined. Analysis by HTS was performed blinded to the FC results.
Quantifying the fraction of total nucleated cells
The amount of DNA input into the assay was quantified and converted to the equivalent total number of nucleated cells, assuming ∼6.5 pg genomic DNA per diploid cell. To estimate the number of starting templates with IGH and TRG rearrangements in the sample, synthetic control templates were spiked into each sample by limiting dilution such that each template was designed to be present at most as a single copy. The average number of sequence reads for each amplified sequence was then measured, and the number of starting templates was derived as the average number of template sequencing reads divided by the average reads per spiked synthetic template (fold-coverage). Thus, the fraction of any given sequence of the total nucleated cellular population is the number of starting templates divided by the total number of input nucleated cells as determined by quantity of input DNA.
Statistical methods
We evaluated event-free survival (EFS) and overall survival (OS) using the method of Kaplan-Meier.30 EFS was defined as time from study enrollment to first event (induction failure, relapse, second malignant neoplasm, or remission death) or date of last contact for those who were event free. OS was defined as time from study enrollment to death or date of last contact. Comparison of survival curves was performed using the log-rank test. Multivariate analysis was performed using a Cox proportional hazards model.
Results
Clonal sequence assessment
Of the 619 patients selected for study, 315 were high risk (AALL0232) and 304 were SR (AALL0331). Twelve diagnostic samples did not meet quality assurance/quality control criteria for DNA quantity or quality (too few sequences generated for reliable analysis because of either the quality or the quantity of DNA available), and these patients were not further analyzed, leaving 607 diagnostic samples. Table 1 shows the clonal rearrangements identified in these 607 samples using the IGH (VDJ/DJ) and TRG assays. Of the 607 evaluable samples, a trackable clonal index sequence(s) was found in 282 SR and 297 high-risk samples for a total of 579 (95.4%) informative samples. Eighty-nine percent of the samples had 1 or more trackable IGH sequences. Of the samples, 59.5% had 1 or more trackable TRG sequences (Table 1). The TRG assay for cross-lineage rearrangements allowed tracking of an additional 6.4% of the samples that would have been uninformative if only the IGH assay were employed for MRD monitoring, in concert with our prior study.20 The remaining 4.6% of patients whose leukemic cells did not show evidence of an IGH or TRG rearrangement are likely neoplastic lymphoblasts transformed prior to immune receptor rearrangement.
Clonal rearrangements detected in the pretreatment samples
| . | Number of cases . |
|---|---|
| TRG rearrangement | 361 (59.5%) |
| IGH rearrangement | 540 (89.0%) |
| “Germline” for both IGH and TRG rearrangements | 28 (4.6%) |
| TRG only | 39 (6.4%) |
| IGH only | 218 (35.9%) |
| IGH and TRG | 322 (53.0%) |
| Quality control failed | 12 |
| Total | 619 |
Correlation of HTS and FC for clinical outcome
Of the 579 patients for whom index trackable sequences were identified, 434 (75.0%) were found to have detectable clonal index sequences at EOI (day 29).
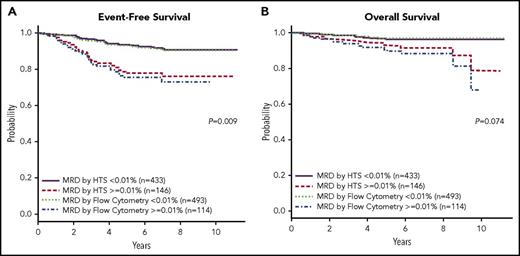
Using a threshold of 0.01% (1 in 10 000), HTS showed similar 5-year EFS and OS compared with FC (Figure 1A-B; Figure 1A: P = .009, 95% confidence interval [CI] 1.057, 1.471; Figure 1B: P = .074, 95% CI 0.976, 1.627). HTS was able to significantly stratify patients for 5-year EFS in both SR and high-risk cohorts (supplemental Figure 1A-B, available on the Blood Web site; Figure 1A: P = .0009, 95% CI 1.503, 5.592; Figure 1B: P = .0002, CI 1.746, 7.813), and for OS (supplemental Figure 1C-D; Figure 1C: P = .0199, 95% CI 1.133, 7.005; Figure 1D: P = .0694, 95% CI 0.851, 11.80). In addition, a strong correlation between MRD values determined by HTS or FC was observed when both technologies identified MRD (supplemental Figure 2; correlation coefficient 0.7035).
EFS and OS for HTS and FC at a threshold of 0.01%. The Kaplan-Meier estimates of EFS (A) and OS (B) at an analytical cutoff of 0.01% for MRD as measured by both HTS and FC. HTS showed similar 5-year EFS and OS to that of FC.
EFS and OS for HTS and FC at a threshold of 0.01%. The Kaplan-Meier estimates of EFS (A) and OS (B) at an analytical cutoff of 0.01% for MRD as measured by both HTS and FC. HTS showed similar 5-year EFS and OS to that of FC.
Discordant HTS and FC MRD have an intermediate prognosis
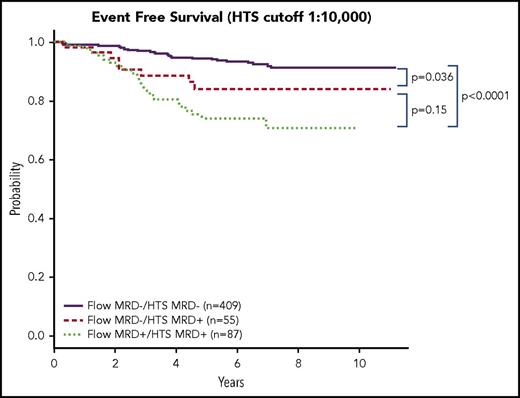
HTS identified 55 patients whose level of MRD was >0.01%, but who were negative for residual disease as measured by FC. This represents 38.7% of all patients with MRD values >0.01% and 9% of the entire study population. These 55 patients had poorer 5-year EFS than those whose MRD was <0.01% by HTS (P = .036, 95% CI 1.016, 2.224) (Figure 2). Most, if not all, of the influence on the poorer performance of this 0.01% FC−/HTS+ group was from the SR subgroup (P = .0017, 95% CI 1.591, 11.66). By contrast, a smaller number of patients (n = 17) was determined to have residual disease >0.01% by FC, but <0.01% by HTS; however, 11 of those 17 patients had residual disease within the next lower decile (from 0.001% to 0.01%) by HTS. The small number of patients in this FC+/HTS− group does not allow further statistical assessment.
Discordant HTS and FC MRD have an intermediate prognosis. A Kaplan-Meier estimate of EFS between patients who were negative for MRD as measured by both HTS and FC, positive for HTS and FC, and HTS positive/FC negative at a threshold of 0.01% identified a cohort of 55 patients who were negative for MRD by FC and positive by HTS. These patients had an intermediate prognosis between patients who were negative by both HTS and Flow and patients who were positive by both HTS and Flow. For the Flow-negative group, the outcome was worse for patients who were HTS positive (P = .036).
Discordant HTS and FC MRD have an intermediate prognosis. A Kaplan-Meier estimate of EFS between patients who were negative for MRD as measured by both HTS and FC, positive for HTS and FC, and HTS positive/FC negative at a threshold of 0.01% identified a cohort of 55 patients who were negative for MRD by FC and positive by HTS. These patients had an intermediate prognosis between patients who were negative by both HTS and Flow and patients who were positive by both HTS and Flow. For the Flow-negative group, the outcome was worse for patients who were HTS positive (P = .036).
Risk stratification
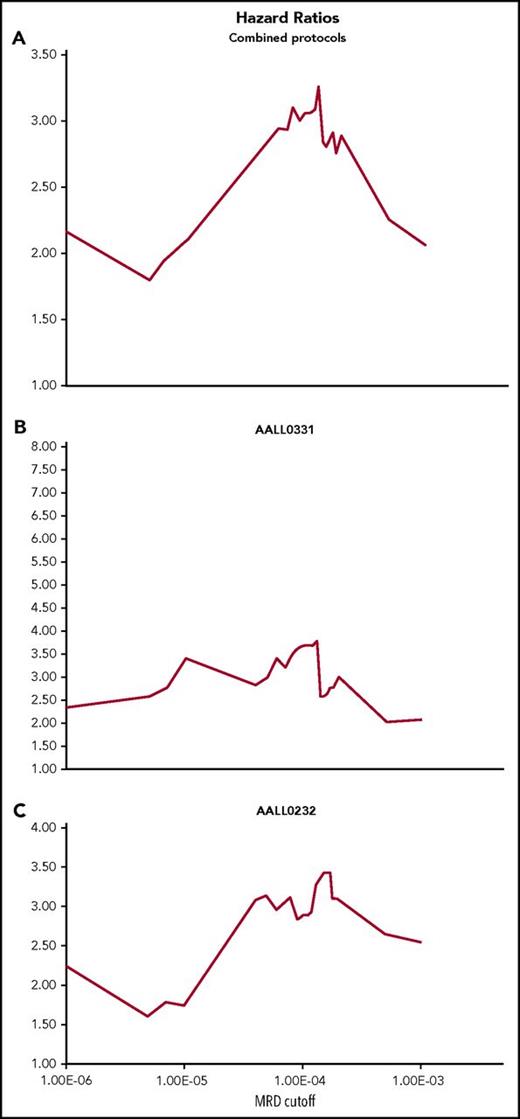
Adverse outcomes were concentrated in the subgroup of patients having MRD >0.01% for both SR and high-risk patients (high risk P = .0057, 95% CI 1.111, 1.939; SR P = .0011, 95% CI 1.243, 2.648; data not shown). For SR, all other strata showed indistinguishable 5-year EFS, whereas for high-risk patients, MRD between 0.01% and 0.001% also suggested poorer 5-year EFS than for patients with MRD at lower levels. Lowering the HTS MRD cutoff from 0.01% to 0.001% resulted in reduced separation in 5-year EFS between poor- and better-risk groups largely because of an improvement in EFS for the poor-risk group (data not shown), suggesting inclusion of a higher proportion of MRD low positive patients having relatively good clinical outcome. To determine the optimal MRD cutoff for risk stratification for these particular treatment regimens, we next computed hazard ratios over the range of MRD levels for the total cohort (Figure 3A) as well as for SR (Figure 3B) and high-risk cohorts (Figure 3C) separately. For the cohort as a whole, the maximal hazard ratio is obtained at an MRD cutoff of ∼0.01%. A similar result is obtained for the high-risk cohort. The SR group lacks a clear optimal hazard ratio, being a broad distribution centered ∼0.01%. Overall, hazard ratio analysis of HTS MRD suggests that at EOI, for these combination chemotherapeutic regimens, an MRD cutoff of 0.01% is reasonable for patient risk stratification at the population level.
Cox proportional hazard ratios at different HTS MRD cutoff thresholds. Hazard ratios were calculated at different thresholds using the Cox Proportional model for the whole cohort (A) and separately for the SR group (B) and the high-risk group (C). The ratios were plotted over the range of HTS MRD levels to determine an optimal cutoff for risk stratification. For the whole group, the hazard ratio was maximal at a level close to 0.01%, and similarly for the high-risk group (C). The SR group showed a broader distribution around a 0.01% cutoff.
Cox proportional hazard ratios at different HTS MRD cutoff thresholds. Hazard ratios were calculated at different thresholds using the Cox Proportional model for the whole cohort (A) and separately for the SR group (B) and the high-risk group (C). The ratios were plotted over the range of HTS MRD levels to determine an optimal cutoff for risk stratification. For the whole group, the hazard ratio was maximal at a level close to 0.01%, and similarly for the high-risk group (C). The SR group showed a broader distribution around a 0.01% cutoff.
HTS identifies a subset of SR patients having excellent outcome
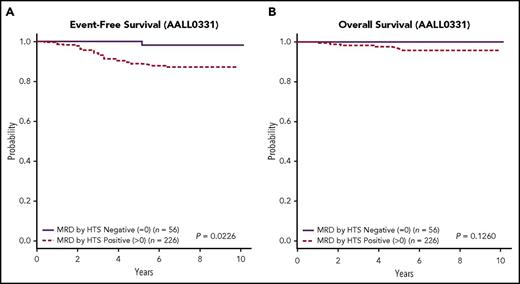
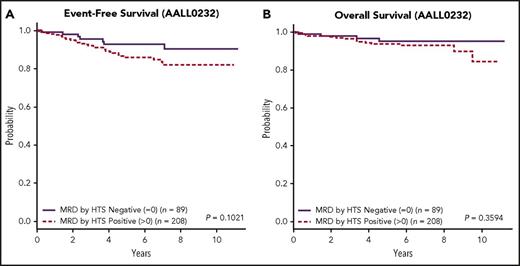
The presence or absence of any detectable clonal sequence by HTS divides the total cohort into better and worse prognostic groups using 5-year EFS (P = .0118, 95% CI 1.195, 5.252; data not shown). This effect is most pronounced for the COG-SR group, where 56 (19.9%) patients having no detectable clonal sequence by HTS had a 5-year EFS of 98.1% ± 2% and OS of 100% (Figure 4A-B; Figure 4A: P = .0226, 95% CI 0.9858, 53.4; Figure 4B: P = .1260 95% CI 0, cannot be calculated). This subset of SR patients was not otherwise distinguished by any cytogenetic risk parameters (supplemental Table 1). Specifically, MRD as determined by HTS was found to be a prognostic indicator independent of other known factors such as favorable chromosome trisomies or ploidy.31,32 By contrast, the patients lacking a detectable clonal sequence in the high-risk cohort (Figure 5A-B; Figure 5A: P = .1021, 95% CI 0.8613, 4.469; Figure 5B: P = .3594, 95% CI 0.5526, 5.023) had a 5-year EFS of 92.7% ± 4% and OS of 95.1% ± 3%. Although a subset of these MRD-negative patients in both cohorts had less than the targeted input DNA of 1 000 000 cell equivalents, this did not change the good outcome for this subset of patients.
EFS and OS for HTS MRD positive at any level vs negative for the SR group. Kaplan-Meier estimates of EFS (A) and OS (B) for patients in the SR group who were positive for MRD by HTS at any level vs negative demonstrated better EFS for the HTS negative cohort (P = .0226) and a better OS. In the latter group, the OS of HTS-negative patients was 100%.
EFS and OS for HTS MRD positive at any level vs negative for the SR group. Kaplan-Meier estimates of EFS (A) and OS (B) for patients in the SR group who were positive for MRD by HTS at any level vs negative demonstrated better EFS for the HTS negative cohort (P = .0226) and a better OS. In the latter group, the OS of HTS-negative patients was 100%.
EFS and OS for HTS MRD positive at any level vs negative for the high-risk group. Kaplan-Meier estimates of EFS (A) and OS (B) for patients in the high-risk group who were positive for MRD by HTS at any level vs negative demonstrated better EFS and OS for the HTS-negative cohort, although the P values did not demonstrate statistical significance.
EFS and OS for HTS MRD positive at any level vs negative for the high-risk group. Kaplan-Meier estimates of EFS (A) and OS (B) for patients in the high-risk group who were positive for MRD by HTS at any level vs negative demonstrated better EFS and OS for the HTS-negative cohort, although the P values did not demonstrate statistical significance.
Patients without a trackable IGH rearrangement have a poorer prognosis
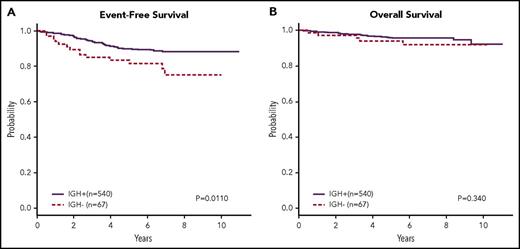
It has been previously described that neoplastic lymphoblasts in some B-ALL patients, commonly infants, lack immunoglobulin gene rearrangements because of presumed leukemic transformation prior to normal developmental B-cell receptor gene rearrangement.33,34 These patients have previously been shown to have a worse outcome than those patients whose leukemic blasts have rearrangements.33,34 In our cohort, patients lacking clonal IGH rearrangements (n = 67, 11%) are found to have a significantly poorer 5-year EFS of 78.5% ± 8% vs 89.3% ± 2% (P = .011, 95% CI 1.173, 3.776; Figure 6A) but without an observable difference in OS (P = .340, 95% CI 0.6084, 4.157; Figure 6B). Cytogenetics, ploidy, and presentation white blood cell count did not distinguish the IGH+ from the IGH− subgroup, but although the majority of patients in the IGH− subgroup were <10 years old, those patients >10 were disproportionately represented in that subgroup (χ2P = .013).
An EFS and OS for patients with or without clonal IGH rearrangements. Kaplan-Meier estimates of EFS (A) and OS (B) for patients from both risk groups combined who did not have a dominant clonal IGH rearrangement by HTS. A subset of 67 patients had no IGH rearrangements and had a worse prognosis than those in whom IGH rearrangements were detected (P = .0110). There was no discernible difference in OS for these patients.
An EFS and OS for patients with or without clonal IGH rearrangements. Kaplan-Meier estimates of EFS (A) and OS (B) for patients from both risk groups combined who did not have a dominant clonal IGH rearrangement by HTS. A subset of 67 patients had no IGH rearrangements and had a worse prognosis than those in whom IGH rearrangements were detected (P = .0110). There was no discernible difference in OS for these patients.
Discussion
A recent meta-analysis has underscored the importance of MRD as a predictor of clinical outcome in both pediatric and adult patients with ALL regardless of therapy, methods of and times of assessment, cutoff levels, and disease subtypes.35 Early response to induction chemotherapy is the most significant prognostic factor in children with B-ALL. Currently, the MRD threshold used by the COG for risk stratification at EOI is 0.01% (1/10 000) by FC26 and is similar to that used by other study groups, although more sensitive values are in consideration.36 At this MRD threshold, our data show that HTS is comparable to FC, being capable of reproducing risk stratification using 5-year EFS in both high-risk and SR patients. HTS also identifies an additional 9% of total patients (38.6% of MRD-positive patients) with MRD at >0.01% by HTS, but negative by FC, and this group has worse EFS compared with those identified as concordantly negative for MRD. This subset should be considered as higher risk, and these patients are likely to benefit from more intensive or newly developed therapeutic regimens as already employed for such high-risk patients as previously delineated by FC.37 This finding is similar to that reported by Gaipa et al, who showed that patients with detectable MRD by PCR but not FC had an intermediate prognosis (5-year EFS 80%) between those who were positive by both PCR and FC (50.9% 5-year EFS) and those concordantly negative for MRD (91.6% 5-year EFS).38 Thus, HTS as described in this study is a suitable direct replacement for the flow cytometric detection of MRD in pediatric B-ALL for the identification of higher-risk patients.
The higher analytical sensitivity of HTS allowed us to determine the MRD threshold that optimally balances clinical sensitivity and specificity to identify poor outcome patients. For the B-ALL cohort as a whole, the MRD threshold that provided the maximum hazard ratio was ∼0.01%, confirming the validity of the threshold at EOI evaluation for current intensive combination chemotherapeutic regimens and consistent with the evolution of therapeutic alternatives focused on this particular cutoff. Evaluation of SR and high-risk patients separately does not suggest major differences in MRD threshold between the 2 groups, although the relatively small number of relapsing patients in the groups does not allow definitive assessment. The use of lower MRD thresholds of 0.001% or 0.0001% by HTS resulted in the inclusion of a larger fraction of MRD-positive patients with relatively good outcome that reduced clinical specificity. This likely is the result of the combined effects of on-going leukemic cell death at this early time point and the effect of additional therapy yet to be delivered during consolidation and maintenance. At time points further from therapy, lower levels of MRD may be more clinically significant, and the high sensitivity of HTS may be of greater advantage.
Within the SR cohort, we identified a significant subset of patients at EOI (19.9%) in whom MRD was not detected at any level by HTS down to 0.0001%. This subset of patients had an outstanding outcome with 100% being alive after 8 years’ average follow-up and having a 5-year EFS of 98.1% with only a single clinical event recorded (relapse off therapy). This appears to represent a novel subset of patients, consistent with suggestions from previous studies13,39 that we can identify at EOI by HTS and predict will be cured with COG SR ALL therapy, hence requiring no further therapy intensification to attain cure. This has important implications for future clinical trial design because these patients will not contribute events to randomized questions and may also be ideal candidates for reduction in therapy questions. Reduction of therapy based on low levels of MRD has been described in previous clinical trials.37,40 Interestingly, the similar HTS-negative subset in the high-risk population does not show the same uniformly excellent outcome, suggesting that there are other biologic and/or genetic features of this subset not captured by assessment of MRD at this early time point that are responsible for relapse.
Current posttreatment management of B-ALL patients is directed by the presence or absence of MRD. Bone marrow examination is the currently accepted standard for such evaluation, and, as previously noted, flow cytometric stratification based on an MRD determination at the level of 0.01% has become an accepted convention. Because tumor burden in the bone marrow in B-ALL appears for a given patient to be anywhere between 5- and 100-fold higher than the tumor burden seen in the blood at least prior to frank clinical relapse,36 there has been some limited effort devoted to systematic analysis of blood MRD.21,24,41,42 However, the 10- to 100-fold higher sensitivity of HTS compared with other modalities suggests that studies directed at the monitoring of blood by HTS might allow peripheral blood sampling instead of bone marrow.
There are some limitations of immunosequencing for MRD detection. MRD detection by HTS requires initial access to material containing significant leukemic involvement to identify the index sequence for subsequent monitoring. A recent update of the National Comprehensive Cancer Network ALL guidelines (NCCN Clinical Practice Guidelines in Oncology: Acute Lymphoblastic Leukemia. Version 1.2017) recommends collection of a bone marrow sample at diagnosis in order to facilitate subsequent MRD testing. Such material is not always available in a tertiary care environment when primary diagnoses are made at outside institutions and patients subsequently referred for treatment. Second, immunosequencing of IGH and TRG cannot be used for every patient with B-ALL because of an absence of rearranged immunoglobulin or T-cell receptor loci in the most developmentally immature form of B-ALL. The frequency of this occurrence is ∼5% based on this study. In such patients, other methods of disease monitoring are required. Monitoring is particularly important for this group, because it is confirmed in this study that these patients have a worse outcome than those whose leukemic cells have clonal IGH rearrangements. Finally, turn-around time for delivery of results by immunosequencing is longer than for FC, but there is nothing in the fundamental chemistry and analysis that requires that the immunosequencing turn-around time be longer than 4 to 5 days. This time frame should be within the range needed for clinical management of patients. Thus, for patients with informative rearrangements, immunosequencing has the potential for improved analytic specificity and sensitivity in MRD detection.
This retrospective study was focused on a single time point, EOI, in the overall course of combination chemotherapy of patients with B-ALL. Although the EOI measurement is clearly important in terms of prognostication and risk stratification, it is possible that MRD assessment at later time points, such as at the end of consolidation, or if incorporated in serial monitoring of the patient, could add value for clinical management.35,39 This is likely to be particularly true for patients in the high-risk cohort whose treatment typically includes additional intensive therapy that extends well beyond the studied day 29 time point. Unfortunately, we do not have banked samples from later time points to test this hypothesis. Given the enhanced sensitivity of HTS, and the very broad quantitative dynamic range, it may be that this technology will be particularly useful in the evaluation of novel therapies for patients with ALL because it potentially permits a better means of quantitating response of ALL to therapy and will allow a stricter definition of complete response.
In summary, we show that HTS of immune receptor genes is an improved analytic platform for measurement of posttreatment MRD in pediatric B-ALL. At the EOI, we show that its performance is comparable to FC for identification of poor-risk patients, and that it identifies a subset of patients who have poorer outcome despite being negative for MRD by FC. We also demonstrate that an MRD threshold of 0.01% is reasonable for clinical identification of poor-risk patients subjected to current chemotherapeutic protocols. In addition, we show that a subset of SR patients who are negative for MRD by HTS at EOI have an outstanding outcome and can be identified by HTS early after therapy. Finally, we demonstrate that HTS can readily identify a subset of patients with leukemic blasts that lack a detectable rearrangement at diagnosis with worse prognosis, consistent with prior literature. This subpopulation may be similar to that previously described as representing an “early thymocyte precursor” form of T-ALL, which also lacked demonstrable immune receptor rearrangements.19 Given that HTS has increased analytic sensitivity and specificity compared with FC and is more objective, requiring less interpretative judgment, HTS is a robust clinical platform that can drive assay standardization for MRD determination.
The online version of this article contains a data supplement.
The publication costs of this article were defrayed in part by page charge payment. Therefore, and solely to indicate this fact, this article is hereby marked “advertisement” in accordance with 18 USC section 1734.
Acknowledgments
The authors acknowledge the many patients, patient families, and physicians who have made this study possible.
This work was funded by the National Institutes of Health (NIH), National Cancer Institute grant USA-R01 CA175353.
Authorship
Contribution: B.W., D. Wu, and H.R. conceived of and led the project and provided funding via NIH RO1 CA175353-01A1; I.K. executed the study and drafted the initial version of manuscript; I.K., B.C., D. Wu, D. Williamson, B.W., and H.R. analyzed data and revised and edited the manuscript; and Y.D., C.G., M.J.B., M.D., K.W.M., E.L., N.W., E.R., W.L.C., S.P.H., and M.L.L. reviewed the manuscript, provided correlative data, and provided access to cohort data.
Conflict-of-interest disclosure: H.R. has employment, equity ownership, patents, and royalties with Adaptive Biotechnologies. I.K., B.C., and D. Williamson have employment and equity ownership with Adaptive Biotechnologies. The remaining authors declare no competing financial interests.
Correspondence: Ilan Kirsch, Adaptive Biotechnologies, 1551 Eastlake Ave E, Suite 200, Seattle, WA 98102; e-mail: lkirsch@adaptivebiotech.com.
REFERENCES
Author notes
B.W. and D. Wu contributed equally to this study.
H.R. and I.K. contributed equally as joint senior authors.

This feature is available to Subscribers Only
Sign In or Create an Account Close Modal