On page 1463 of the 1 September 2006 issue, there are errors in Figure 2C. The western blots for the Bim−/− and Bad−/−Bim−/− cell lysates probed with a β-actin antibody control are reversed, and the location of the 49-kDa molecular mass marker is incorrect. The corrected Figure 2 is shown below.
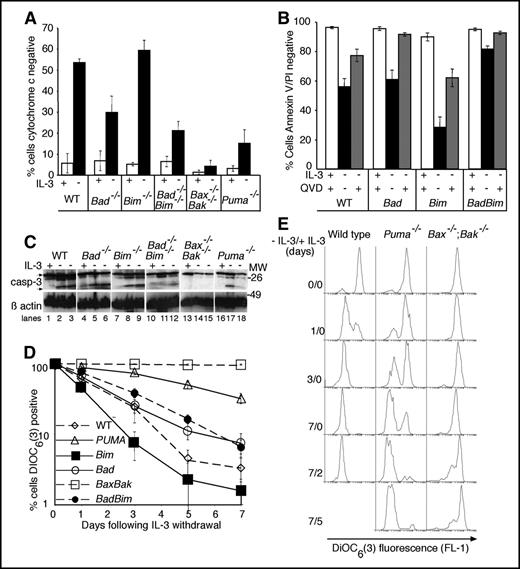
Loss of Bad does not affect mitochondrial release of cytochrome c, caspase processing or loss of mitochondrial membrane potential following IL-3 withdrawal. (A) Cytochrome c release from mitochondria was examined 48 hours following IL-3 withdrawal. Cells were cultured in the presence or absence of IL-3 for 48 hours, then permeabilized, fixed, and stained with antibodies to cytochrome c prior to analysis by flow cytometry to determine the percentage of cells that had lost mitochondrial cytochrome c. Data show the mean ± SEM of 3 independent experiments using 2 independent lines of each genotype. (B) Caspase inhibition diminishes the percentage of cells that are stained by both annexin V and PI following IL-3 withdrawal. Cells were cultured for 24 hours in the presence or absence of IL-3 with or without the broad-spectrum caspase inhibitor Q-VD-Z-OPh (100 µM). Cell viability was determined by annexin V-FITC staining and PI uptake. Columns show the mean ± SEM of 3 independent experiments using 2 independent lines of each genotype. (C) Western blots of lysates from cells cultured for 24 hours with IL-3 (lanes 1, 4, 7, 10, 13, and 16), 24 hours without IL-3 (lanes 2, 5, 8, 11, 14, and 17), and 48 hours without IL-3 (lanes 3, 6, 9, 12, 15, and 18) were probed with an antibody to caspase-3. Arrows show full-length and processed caspase-3, respectively. Probing with an antibody to β-actin was used as a loading control. (D) Changes in mitochondrial membrane potential following IL-3 withdrawal. Cells were cultured without IL-3 for the indicated lengths of time, stained with DIOC6(3), and analyzed by flow cytometry to determine the percentage of cells that had lost their mitochondrial membrane potential. Dead or dying cells have diminished DIOC6(3) fluorescence, which is detected in the FL1 channel. The results show the mean ± SEM of 3 independent experiments, each using 2 independent lines of each genotype. (E) Histograms of DIOC6(3) fluorescence following IL-3 withdrawal and after restoration of IL-3. At each time during factor starvation and following readdition of IL-3 (indicated at the left of each panel), cells were harvested and stained with DIOC6(3). The histograms shown are from a single experiment representative of 3 independent analyses.
Loss of Bad does not affect mitochondrial release of cytochrome c, caspase processing or loss of mitochondrial membrane potential following IL-3 withdrawal. (A) Cytochrome c release from mitochondria was examined 48 hours following IL-3 withdrawal. Cells were cultured in the presence or absence of IL-3 for 48 hours, then permeabilized, fixed, and stained with antibodies to cytochrome c prior to analysis by flow cytometry to determine the percentage of cells that had lost mitochondrial cytochrome c. Data show the mean ± SEM of 3 independent experiments using 2 independent lines of each genotype. (B) Caspase inhibition diminishes the percentage of cells that are stained by both annexin V and PI following IL-3 withdrawal. Cells were cultured for 24 hours in the presence or absence of IL-3 with or without the broad-spectrum caspase inhibitor Q-VD-Z-OPh (100 µM). Cell viability was determined by annexin V-FITC staining and PI uptake. Columns show the mean ± SEM of 3 independent experiments using 2 independent lines of each genotype. (C) Western blots of lysates from cells cultured for 24 hours with IL-3 (lanes 1, 4, 7, 10, 13, and 16), 24 hours without IL-3 (lanes 2, 5, 8, 11, 14, and 17), and 48 hours without IL-3 (lanes 3, 6, 9, 12, 15, and 18) were probed with an antibody to caspase-3. Arrows show full-length and processed caspase-3, respectively. Probing with an antibody to β-actin was used as a loading control. (D) Changes in mitochondrial membrane potential following IL-3 withdrawal. Cells were cultured without IL-3 for the indicated lengths of time, stained with DIOC6(3), and analyzed by flow cytometry to determine the percentage of cells that had lost their mitochondrial membrane potential. Dead or dying cells have diminished DIOC6(3) fluorescence, which is detected in the FL1 channel. The results show the mean ± SEM of 3 independent experiments, each using 2 independent lines of each genotype. (E) Histograms of DIOC6(3) fluorescence following IL-3 withdrawal and after restoration of IL-3. At each time during factor starvation and following readdition of IL-3 (indicated at the left of each panel), cells were harvested and stained with DIOC6(3). The histograms shown are from a single experiment representative of 3 independent analyses.


This feature is available to Subscribers Only
Sign In or Create an Account Close Modal