Key Points
A significant proportion of MM is dominated by neutral evolutionary dynamics.
Neutral MM tumors are characterized by shorter survival, consistent with reduced sensitivity to drugs targeting the MM microenvironment.
Recent studies suggest that the evolutionary history of a cancer is important in forecasting clinical outlook. To gain insight into the clonal dynamics of multiple myeloma (MM) and its possible influence on patient outcomes, we analyzed whole exome sequencing tumor data for 333 patients from Myeloma XI, a UK phase 3 trial and 434 patients from the CoMMpass study, all of which had received immunomodulatory drug (IMiD) therapy. By analyzing mutant allele frequency distributions in tumors, we found that 17% to 20% of MM is under neutral evolutionary dynamics. These tumors are associated with poorer patient survival in nonintensively treated patients, which is consistent with the reduced therapeutic efficacy of microenvironment-modulating IMiDs. Our findings provide evidence that knowledge of the evolutionary history of MM has relevance for predicting patient outcomes and personalizing therapy.
Introduction
Advances in the treatment of multiple myeloma (MM) in the form of proteasome inhibitors and immunomodulatory drugs (IMiDs) have significantly improved patient outcomes, however, MM remains a remitting-relapsing disease in most patients.1
Although rearrangements at the immunoglobulin H (IgH) loci and hyperdiploidy are key initiating events in MM oncogenesis, it is likely by inference from the study of other cancers that the evolutionary history of MM is important in determining patient outcome.2,3 This is because prognosis in cancer is strongly associated with the development of resistant subclones.4 Recent studies of solid cancers have challenged the classical Darwinian model of cancer evolution based on changing subclonal dominance.5,-7 Observations have suggested that after malignant transformation, subclones with distinct mutational profiles can coexist for long periods of time.8,9 Such a model of neutral tumor evolution is consistent with the handful of recurrent driver alterations identified to date, indicating that they all occurred in the primordial cancer cell and that subsequent clonal outgrowths are relatively rare.
The mutant allele frequency distribution has been shown to predict the expected pattern of subclonal mutations within a tumor under neutral evolutionary dynamics from a single baseline sample.10 To gain insight into the clonal evolution of MM and its impact on phenotype, we analyzed whole exome sequencing (WES) tumor data from 2 independent series of MM patients.11,12 We report that a proportion of MM tumors are under neutral evolutionary dynamics and that these tumors are associated with worse survival in patients receiving IMiD therapy.
Study design
We analyzed WES tumor data from 333 patients from Myeloma XI (www.clinicaltrials.gov identifier NCT01554852, CRUK/09/014), an open-label, randomized controlled phase 3 trial comparing thalidomide with lenalidomide at induction and lenalidomide maintenance with no maintenance in both transplant-eligible and transplant-noneligible patients (supplemental Methods; supplemental Figure 1, available on the Blood Web site).11,12 Experiments were approved by the National Health Service Health Research Authority, London-Surrey Borders Research Ethics Committee (REC 08/H0806/98). Copy number changes in tumors were based on multiplex ligation dependent probe amplification data, and quantitative reverse transcription polymerase chain reaction was used to assign translocation status.13,14 In addition, we analyzed WES tumor data from 434 patients from the Multiple Myeloma Research Foundation’s CoMMpass study who received IMiD therapy (www.clinicaltrials.gov identifier NCT01454297; dbGaP accession phs000748.v5.p4; IA9 data tranche; supplemental Methods). Translocations status and copy number abnormalities from CoMMpass data were called from whole genome, exome, and RNA sequencing (fluorescence in situ hybridization [FISH]-sequencing). Hyperdiploid cases with no detected translocation by FISH-sequencing, but classified by conventional FISH were considered missing. This study was conducted in accordance with the Declaration of Helsinki.
Modeling tumor evolution
The distribution of mutant allele frequencies in each MM tumor was used to detect neutral evolution as previously described10 (supplemental Methods). Briefly, mutations were only included if the read depth was ≥10 and the number of mutant alleles was ≥3; ≥12 mutations matching these criteria had to be present in a sample to be included.10 Preliminary analysis showed that mosaic copy number changes (eg, hyperdiploidy) could give rise to a false subclone status, and all cases were corrected for copy number.13,-15 By excluding public mutations present at mutational frequencies ≥0.3, the influence of undetermined normal CD138 cell contamination was controlled. Mutations at frequencies ≤0.12 were also excluded because they reached the limit of reliable detectability in bulk sequencing data.10 For each tumor sample, the cumulative number of mutations, M(f), was tested for linearity with the inverse of the frequency (1/f) as predicted by M(f) = µ/β(1/f – 1/fmax) for neutral tumor evolution. A tumor sample was considered to have evolved neutrally if R2 ≥ 0.98, as previously advocated.10
Results and discussion
Evidence of neutral evolution was shown in 20% of tumors (65 of 333 patients) from the Myeloma XI trial (Figure 1; supplemental Figures 2 and 3). Evidence for neutral evolution was not influenced by sequencing depth, exome coverage, or number of mutations (supplemental Table 1). There was no significant association between neutral clonal evolution in tumors by age at diagnosis, sex, or International Staging System stage. In the CoMMpass study, 17% of tumors (74 of 434 patients) from patients treated with IMiDs showed evidence of neutral evolution.
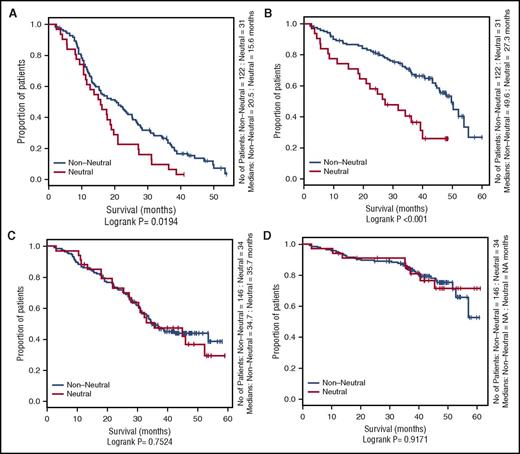
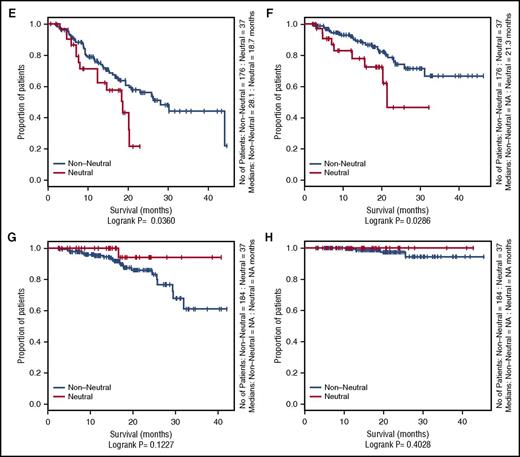
Influence of neutral evolutionary dynamics on OS and PFS in the Myeloma XI and CoMMpass studies. Kaplan-Meier curves comparing neutral cases (R2 ≥ 0.98) vs nonneutral cases. (A) Progression-free survival (PFS) of Myeloma XI cases in the nonintensive treatment arm. (B) Overall survival (OS) of Myeloma XI cases in the nonintensive treatment arm. (C) PFS of Myeloma XI cases in the intensive treatment arm. (D) OS of Myeloma XI cases in the intensive treatment arm. (E) PFS of nonautologous transplant CoMMpass cases receiving an IMiD. (F) OS of nonautologous transplant CoMMpass cases receiving an IMiD. (G) PFS of autologous transplant CoMMpass cases receiving an IMiD. (H) OS of autologous transplant CoMMpass cases receiving an IMiD. The red line depicts the survival curve for tumors with neutral evolutionary dynamics, and the black line depicts the survival curve for tumors with nonneutral evolutionary dynamics. Horizontal ticks on the survival curves show censored cases.
Influence of neutral evolutionary dynamics on OS and PFS in the Myeloma XI and CoMMpass studies. Kaplan-Meier curves comparing neutral cases (R2 ≥ 0.98) vs nonneutral cases. (A) Progression-free survival (PFS) of Myeloma XI cases in the nonintensive treatment arm. (B) Overall survival (OS) of Myeloma XI cases in the nonintensive treatment arm. (C) PFS of Myeloma XI cases in the intensive treatment arm. (D) OS of Myeloma XI cases in the intensive treatment arm. (E) PFS of nonautologous transplant CoMMpass cases receiving an IMiD. (F) OS of nonautologous transplant CoMMpass cases receiving an IMiD. (G) PFS of autologous transplant CoMMpass cases receiving an IMiD. (H) OS of autologous transplant CoMMpass cases receiving an IMiD. The red line depicts the survival curve for tumors with neutral evolutionary dynamics, and the black line depicts the survival curve for tumors with nonneutral evolutionary dynamics. Horizontal ticks on the survival curves show censored cases.
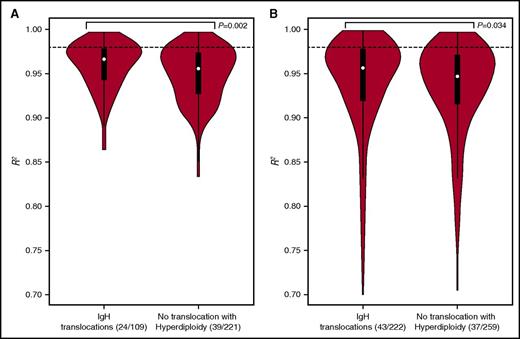
In both the Myeloma XI and CoMMpass series, tumors with IgH translocations were more likely to show evidence of neutral evolution than hyperdiploidic tumors; the median R2 values for Myeloma XI and CoMMpass tumors were 0.963 vs 0.956 (P = .002) and 0.957 vs 0.947 (P = .034), respectively (Figure 2; supplemental Figures 4 and 5).
Association of neutral evolutionary dynamic with IgH translocations in Myeloma XI and CoMMpass studies. Violin plot of the neutral evolutionary dynamics measured by R2 (A) Myeloma XI and (B) CoMMpass. The distribution shows kernel density estimation, where a broader shape represents a higher probability of a value. The thick black bar represents the interquartile range. The thin line represents the 95% confidence interval. The dotted line corresponds to the R2 = 0.98 threshold for discriminating neutral from nonneutral tumors. Statistical differences between experimental groups were evaluated by Wilcoxon rank-sum test. P < .05 was considered statistically significant.
Association of neutral evolutionary dynamic with IgH translocations in Myeloma XI and CoMMpass studies. Violin plot of the neutral evolutionary dynamics measured by R2 (A) Myeloma XI and (B) CoMMpass. The distribution shows kernel density estimation, where a broader shape represents a higher probability of a value. The thick black bar represents the interquartile range. The thin line represents the 95% confidence interval. The dotted line corresponds to the R2 = 0.98 threshold for discriminating neutral from nonneutral tumors. Statistical differences between experimental groups were evaluated by Wilcoxon rank-sum test. P < .05 was considered statistically significant.
In both series of patients that received nonintensive therapy (ie, no high-dose alkylating consolidation), neutral tumor evolution was associated with worse PFS and OS. In the Myeloma XI trial, the median PFS was 15.6 compared with 20.5 months (log-rank P = .019), and median OS was 27.3 compared with 49.6 months (P < .001) for neutral and nonneutral tumors, respectively. In the CoMMpass study, median PFS was 18.7 compared with 28.1 months (P = .036), and median OS was 21.3 and not reached (P = .029), respectively. In contrast, no difference was shown for patients in receipt of intensive alkylating therapy based on high-dose melphalan and autologous transplantation.
To address the possibility of potential collinearity between tumor evolution status and established genetic risk factors in nonintensively treated patients that may have confounded outcome, we performed a multivariable survival analysis (supplemental Table 2). Neutral evolution was shown to be prognostically independent of International Staging System, adverse IgH translocations, and gain(1q) and TP53 deletion.
The observation that tumors with IgH translocations have a higher degree of evolutionary neutrality than hyperdiploid tumors may reflect the fact that early mutational events brought about by IgH translocations provide increased tumor fitness compared with hyperdiploidy. Importantly, IgH translocations are present in all subclones, thus potentially mediating relative tumor independence from external factors, such as microenvironment growth factors, that might contribute to subclonal selection in a weaker oncogenic context.16
Tumor microenvironment factors are well established to influence MM cell survival and proliferation.17 Therapy with IMiDs modulates the tumor microenvironment, but in the context of neutral evolution and the presence of early clonal strong oncogenic driver events, this mechanism of therapy may be less efficacious. This contrasts with intensive alkylator therapy, which targets the tumor cell directly and nonspecifically through DNA adduct formation. This “debulking” effect may reset the subclonal structure, potentially reducing the impact of a neutral or nonneutral evolutional tumor history (supplemental Figure 6), which may explain the similar survival in both groups of intensively treated patients.
In summary, we demonstrate that a significant proportion of MM is under neutral evolutionary selection. Importantly, such tumors tend to confer poorer patient survival in the context of microenvironment-modulating therapies. Our findings therefore provide further evidence that knowledge about the evolutionary dynamics of MM has the potential to inform treatment decisions.
The online version of this article contains a data supplement.
The publication costs of this article were defrayed in part by page charge payment. Therefore, and solely to indicate this fact, this article is hereby marked “advertisement” in accordance with 18 USC section 1734.
Acknowledgments
The authors thank all the patients and staff at centers throughout the United Kingdom whose participation made this study possible. The support of the Clinical Trials Research Unit at The University of Leeds was essential to the successful running of the study, and we thank all the staff, including Helen Howard, Corinne Collett, Anna Waterhouse, Jacqueline Ouzman, and Alex Szubert. The authors thank the NCRI Haematology Clinical Studies Group. Results using the CoMMpass data sets were generated as part of the Multiple Myeloma Research Foundation Personalized Medicine Initiatives (https://research.themmrf.org and www.themmrf.org). The authors also thank all patients, data curators, and organizations that participated in the CoMMpass study.
This work was supported by Myeloma UK as well as Cancer Research UK CTAAC sample collection grants (C2470/A12136 and C2470/A17761) and a Cancer Research UK Biomarkers and Imaging Discovery and Development grant (C2470/A14261). Additional funding was provided by Bloodwise. This work was also supported by the National Institutes of Health Biomedical Research Centre at the Royal Marsden Hospital.
Authorship
Contribution: D.C.J., R.S.H., and M.F.K. participated in the conception and design of the study; D.C.J., B.A.W., J.R.J., C.P., C.W., G.J., D.C., W.M.G., R.O., M.D., G.C., F.E.D., G.J.M., and M.F.K. participated in the acquisition of data; D.C.J., O.L., J.M., D.C., R.S.H., and M.F.K. participated in the analysis of data; and D.C.J., R.S.H., and M.F.K. wrote and reviewed or revised the manuscript.
Conflict-of-interest disclosure: G.J. has received consultancy fees, honoraria, travel support, research funding, and speakers bureau from Celgene and Takeda and consultancy fees, honoraria, and speakers bureau from Janssen, MSD, Roche, and Amgen. M.D. owns equity and is a board member of Abingdon Health. G.C. has received consultancy fees, honoraria, research funding, and speakers bureau from Celgene, Janssen, Takeda, and Amgen; consultancy fees, honoraria, and speakers bureau from Sanofi; and consultancy fees and honoraria from Bristol Myers Squibb and Glycomimetics. F.E.D. received consultancy fees and honoraria from Celgene, Takeda, and Janssen. C.P. received consultancy fees and travel support from Celgene and consultancy fees from Takeda Oncology. J.R.J. received honoraria and research funding from Celgene. G.J.M. received consultancy fees and honoraria from Takeda and Janssen; consultancy fees, research funding, and honoraria from Celgene; and research funding from Janssen. M.F.K. has received consultancy fees, research funding, and honoraria from Celgene; consultancy fees and honoraria from Amgen and Janssen; consultancy fees and travel support from Takeda and BMS; and consultancy fees from Chugai. The remaining authors declare no competing financial interests.
Correspondence: Martin F. Kaiser, Division of Molecular Pathology, Institute of Cancer Research, 15 Cotswold Rd, Sutton SM2 5NG, United Kingdom; e-mail: martin.kaiser@icr.ac.uk.


This feature is available to Subscribers Only
Sign In or Create an Account Close Modal