Abstract
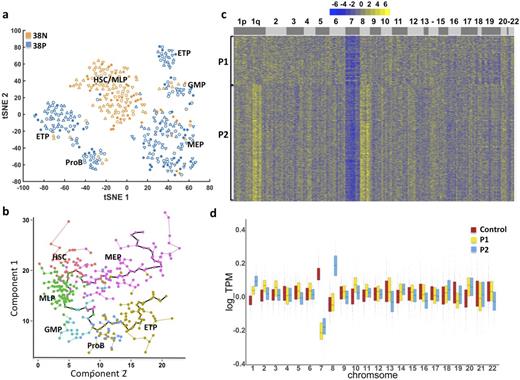
Monosomy 7 is a frequent cytogenetic abnormality in hematopoietic malignancies and a general indicator of poor prognosis. Due to lack of distinct cell surface markers between monosomy 7 cells and normal cells, it is not feasible to physically separate aneuploid from diploid cells. We performed single-cell RNA-seq (scRNA-seq), which allows the entire transcriptome of large numbers of single cells to be assayed in an unbiased way, to investigate hematopoietic differentiation of normal and aneuploid human hematopoietic cells. Bone marrow samples were collected from four patients (P1-P4) with myelodysplastic syndrome, and four healthy volunteers. Conventional cytogenetics showed -7/7q- in bone marrow cells from P1, P3 and P4, and dup(1)(q21q32) in cells from P2; retrospectively, P2 was found positive for monosomy 7 as well as trisomy 8 by fluorescence in situ hybridization. Fresh CD34+CD38- and CD34+CD38+cells were sorted by flow cytometry and then subjected to Fluidigm C1 Single-Cell Auto Prep System for scRNA-seq. After excluding cells with low transcriptome coverage, 326 cells from P1 and P2 (analysis is in progress for P3 and P4), and 391 cells from healthy subjects were analyzed by comparison of transcriptomes from 17,071 genes. Nonlinear dimension reduction and visualization were achieved using t-distributed Stochastic Neighbor Embedding (tSNE). Cells from healthy controls clustered into seven subgroups based on their gene expression pattern, and each group could be associated with a previously reported hematopoietic cell type by known marker genes (Laurenti E, Nat Immunol, 2013). These cell types included hematopoietic stem cell (HSC), multilymphoid progenitor (MLP), granulocyte-monocyte progenitor (GMP), Pro-B cell (ProB), earliest thymic progenitor (ETP), and megakaryocytic-erythroid progenitor (MEP) (Fig 1a). Individual cells from healthy controls were ordered by Monocle software based on their expression profile similarity to uncover a differentiation hierarchy. A two-branch trajectory of development from HSC was revealed, with one branch progressing towards erythroid cell and the other to lymphoid/myeloid cells (Fig 1b). This pattern differs from the classic hematopoietic model, but is consistent with reports claiming existence of early-lymphoid-biased progenitors that retain myeloid but not erythroid potential (Doulatov S, Nat Immunol, 2010), and of dominance of multipotent and unipotent progenitors over scarce oligopotent progenitors in the adult marrow hematopoietic hierarchy (Notta F, Science, 2016). We compared single cells from patients and healthy controls for regional and chromosomal copy number differences in gene expression. We identified subclonal populations of cells from patients that showed decreased expression of chromosome 7 genes (60% in P1, and 55% in P2; Fig 1c and 1d), and increased expression of chromosome 8 (77% in P2) and chromosome 1 long arm genes (P2), at FDR=0.05 estimated with cells from health donors. Gene Ontology enrichment analysis using topGO indicated that cells with low global expression of chromosome 7 genes had dysregulated expression of immune related genes, including B cell receptor signaling pathway, T cell activation and differentiation, antigen receptor-mediated signaling pathway, as well as signal transduction and Fc-γ Receptor signaling pathway. ScRNA-seq analysis reveals a simple pattern of normal human hematopoietic development and the molecular signature of aneuploid cells from patients with developing "clonal evolution". This powerful method should improve characterization of functional changes in human cells with chromosome abnormalities.
a. Single-cell gene expression patterns assigned single cells from healthy controls to seven clusters. 38N: CD34+CD38- population; 38P: CD34+CD38+ population. Different shapes represent cells from different subjects. b. Pseudo-time ordering of cells using Monocle reveals a two-branch stepwise development from stem cells to erythroid or lymphoid/myeloid cells. c. Heatmap of the copy-number variation (CNV) signal normalized against healthy controls shows CNV changes by chromosome (columns) for patients' individual cells (rows). d. Genome-wide gene expression binned per chromosome in single cells from P1, P2 and healthy controls. Chromosomal mapping reads values were median centered.
a. Single-cell gene expression patterns assigned single cells from healthy controls to seven clusters. 38N: CD34+CD38- population; 38P: CD34+CD38+ population. Different shapes represent cells from different subjects. b. Pseudo-time ordering of cells using Monocle reveals a two-branch stepwise development from stem cells to erythroid or lymphoid/myeloid cells. c. Heatmap of the copy-number variation (CNV) signal normalized against healthy controls shows CNV changes by chromosome (columns) for patients' individual cells (rows). d. Genome-wide gene expression binned per chromosome in single cells from P1, P2 and healthy controls. Chromosomal mapping reads values were median centered.
Desierto:GSK/Novartis: Research Funding. Townsley:GSK/Novartis: Research Funding. Young:Novartis: Research Funding.
Author notes
Asterisk with author names denotes non-ASH members.


This feature is available to Subscribers Only
Sign In or Create an Account Close Modal