Abstract
The hallmark for Chroniclymphocytic leukemia (CLL) is a highly variable clinical course. An international prognostic index (CLL-IPI) is a promising tool to improve the precision of prognostic counseling and to identify patients who deserve closed monitoring. The CLL-IPI is a risk-weighted model comprising the risk factors age, stage, del(17p)/TP53 mutation, IGHV mutation status, and β2-microglobulin (β2-M)(LancetOncol 2016).
The aims of the study were 1) to determine the IGHV status as well as the IGHV repertoire 2) to assess/validate the applicability of the CLL-IPI in general practice.
We included all patients diagnosed of CLL according to the National Cancer Institute Working Group guidelines in our institution between 1986 and 2014 who had at least a 24 months follow-up. Amplification and sequence analysis of IGH rearrangements were performed on either DNA or cDNAusing the BIOMED-2 protocol. Sequence data were analyzed using the IMGT database and tools. Clinical and biological data were extracted from medical records and included age, stage, CD38 and ZAP-70 expression, serum LDH, β2-M, cytogenetics and lines of treatment. Overall survival (OS) was calculated from diagnosis to last follow-up or death, time to first treatment (TFT) from diagnosis to first treatment administration or last follow-up.
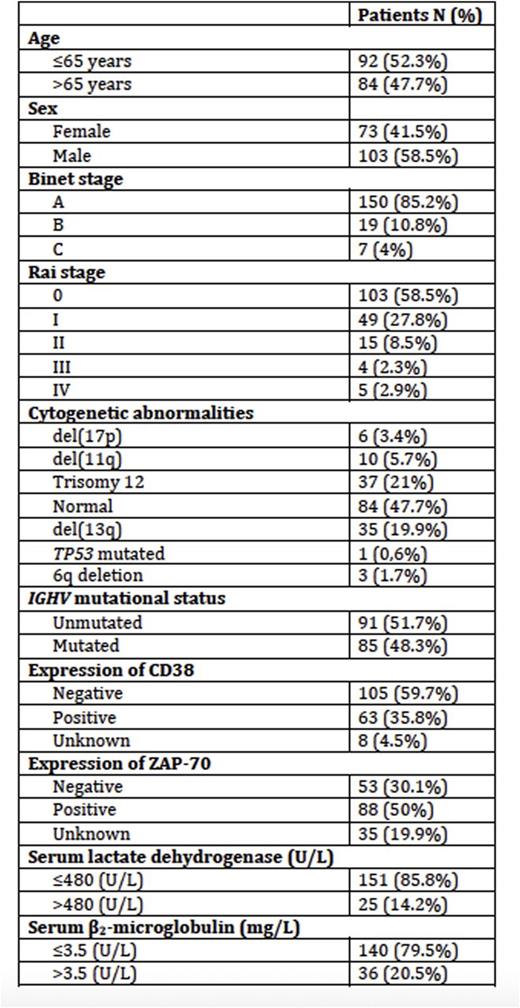
209 CLL patients were originally included but complete data to calculate the CLL-IPI was only available in 176 pts. Median age of the series was 65 years (range, 33 to 92), and a slight male predominance 102 (58.5%). The main clinical characteristics are detailed in Table 1. Median follow-up of patients was 71.5 months (range, 24-315).
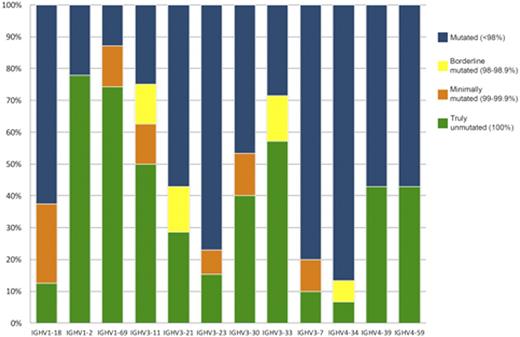
We identified 105/209 patients (50%) with unmutated IGHV. Somatic mutations among IGHV gene subgroups display a hierarchy of mutations (IGHV3>IGHV1>IGHV4). Among the functional IGHV genes, the most frequently encountered were IGHV1-69 (31; 14.6%). It was the most recurrently used in the unmutated group.
The most represented IGHV gene within the mutated subset was IGHV4-34, which was used in 15 cases (7.1%). We have observed 39 IGHV genes. The most frequents are showed in Figure1.
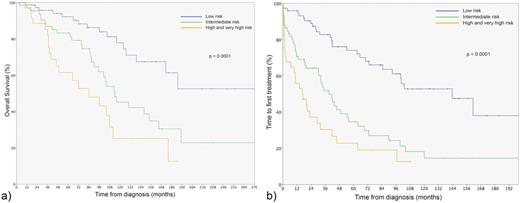
As previously described, patients with unmutated status showed a higher expression of CD38 and ZAP-70, unfavorable cytogenetics and a higher proportion of treated patients. The CLL-IPI index identified four groups of patients: low risk (0-1 points) n=74 (42%), intermediate (2-3) 67 (38.1%), high (H) (4-6) 29 (16.5%) and very high (VH) 6 (3.4 %). The 5-year OS and 5-year TFT of the CLL-IPI risk groups differed significantly (p< 0.0001, log-rank test) between the low (OS 92.2%, TFT 74.1%), intermediate (OS 83.2%, TFT 34.6%) and high-very high groups (OS 61.5%, TFT 22.8%). We only identified 6 patients (3.4%) with a VH, with no difference in terms of OS and TFT between the VH and high (H) risk groups, probably due to the small number of patients. When we considered the H and VH altogether, the CLL-IPI identified three groups with significantly different TFT and OS (Figure 2)
In summary, in our cohort the frequencies of the IGHV genes used in BCR rearrangements were similar to those described in the Mediterranean area and confirm a geographical-dependent leukaemic repertoire.
We confirm that the CLL-IPI is a useful tool for real-life practice as it identifies three risk groups with significantly different time to first treatment and overall survival curves. In our experience, the CLL-IPI applied to the whole CLL population at diagnosis discriminates a smaller proportion of patients in the high (16.4%) and very high groups (3.4 %) compared to the original training cohort based on treated patients included in clinical trials. Our results are closely similar to the MAYO cohort that included patients consecutively diagnosed and observed.
Patient characteristics at diagnosis included in CLL-IPI analysis (n=176)
Distribution of rearrangements of the 12 most frequent IGHV genes according to mutational status.
Distribution of rearrangements of the 12 most frequent IGHV genes according to mutational status.
a) Overall survival b) Time to first chronic lymphocytic leukaemia treatment according to the CLL-IPI risk groups
a) Overall survival b) Time to first chronic lymphocytic leukaemia treatment according to the CLL-IPI risk groups
No relevant conflicts of interest to declare.
Author notes
Asterisk with author names denotes non-ASH members.


This feature is available to Subscribers Only
Sign In or Create an Account Close Modal