Key Points
Gas6 promotes cancer-induced thrombosis by regulating the expression of Ptges from the endothelium.
Gas6-dependent PGE2 secretion from the endothelium leads to platelet activation and venous thrombosis.
Abstract
Venous thromboembolism is a common complication of cancer. Based on recent evidence that (1) growth arrest-specific 6 (Gas6) regulates the expression of tissue factor during venous thrombosis, and (2) cancer promotes a procoagulant milieu, we hypothesize that Gas6 may be involved in cancer-induced coagulopathy. Venous thrombi were induced in both wild-type (WT) and Gas6-deficient (−/−) mice with cancer. WT mice with cancer developed larger thrombi than their healthy counterparts; these larger thrombi induced by cancer were not seen in Gas6−/− mice. Whole genome microarray analysis of differential gene expression in WT and Gas6−/− endothelial cells exposed to M27 murine lung carcinoma cells reveal that Gas6 increases prostaglandin E synthase (Ptges) expression in endothelial cells. This was confirmed using real-time polymerase chain reaction and immunofluorescence staining. Culture of WT endothelial cells with M27 increases the secretion of prostaglandin E2 (PGE2), the enzymatic product of Ptges, in WT but not in Gas6−/− endothelial cells. In WT endothelial cells, Ptges expression was regulated through extracellular signal-regulated kinase 1/2 phosphorylation (ERK1/2). In vitro, PGE2 activates platelets after binding to its receptor, EP3. In vivo, EP3 receptor antagonism reversed the effect of cancer-induced thrombosis in WT mice. These results show that Gas6, through upregulation of PGE2, contributes to cancer-induced venous thrombosis.
Introduction
Venous thromboembolism is a major cause of morbidity and mortality related to cancer and its treatments. The onset of malignancy predisposes patients to an increased risk of developing venous thrombosis compared with age and sex-matched, control subjects.1 Venous thromboembolism pathophysiology is explained, in part, by a combination of 3 factors; stasis, vascular injury, and hypercoagulability,2 as described by Rudolf Virchow. Cancer patients are frequently hospitalized and subjected to prolonged bed rest, hence stasis from immobility. Chemotherapy, surgery, and metastasis of the malignant cells can damage the vessel wall leading to vascular injury. Cancers themselves can shift the hemostatic balance toward a procoagulant environment by upregulating factors such as tissue factor (TF), plasminogen activator inhibitor 1, and cyclooxygenase-2,3,4 by altering microvesicle secretion and endothelial cell-leukocyte interactions.5
Growth arrest-specific 6 (Gas6) is a secreted protein, a member of the vitamin K-dependent family of proteins, and contains several γ-carboxylated glutamic acid residues at the amino terminus.6 Gas6 binds to the receptor tyrosine kinases Axl, Mer, and Tyro3,7 with the highest affinity for Axl.8 Gas6 is found in several tissue types, such as the kidney,9 the central nervous system,10 the endothelium, and human plasma.11 Gas6 is involved in cell proliferation, adhesion, survival,12 and angiogenesis.13
Gas6 is homologous to protein S, a protein in the blood coagulation cascade. Unlike protein S, Gas6 has no direct role in thrombin generation and fibrin formation; rather, it has an indirect role in the pathophysiology of venous and/or arterial thrombosis. Gas6-deficient (−/−) mice are protected from lethal arterial and venous thrombosis, due to a defect in platelet aggregation and secretion.14 We recently demonstrated that Gas6 regulates TF expression from the endothelium,15,16 which participates in venous thrombus development. Given that cancer promotes a procoagulant milieu, we hypothesize that Gas6 may have an important role in cancer-induced coagulopathy. In this study, we demonstrate that Gas6 promotes cancer-induced venous thrombosis through the upregulation of prostaglandin E synthase (Ptges) and prostaglandin E2 (PGE2) production.
Methods
Cancer models
All procedures were approved by the Institutional Animal Care Committee of McGill University. C57BL/6N wild-type (WT) and Gas6−/− male mice between 8- to 12-weeks of age, obtained by in-house breeding, were used in all experiments.15 Mice were injected with 300 000 M27, murine lung carcinoma cells, via tail vein injection.17 After 14 to 21 days following the injection, cancer stage was assessed in animals using physical features such as breathing state and mobility. Gas6 is known to impair cancer progression.18 Thus, cancer stage was assessed by lung weight in mice that have lost 10% to 15% of total body weight (see supplemental Table 2, available on the Blood Web site). To obtain similar lung weight between WT and Gas6−/− mice, Gas6−/− have been sacrificed between 3 and 7 days later than the WT mice.
Alternatively, WT and Gas6−/− mice were IV injected with 1 × 10⁶ Eμ-myc B-cell lymphoma cell line. Cancer stage was assessed by measuring the inguinal lymph node volume using high frequency ultrasound (HFUS) in the same mouse before the injection of Eμ-myc B-cell (day 0) and 6 days after the injection (day 6).
Venous thrombosis was induced in the inferior vena cava (IVC) of WT and Gas6−/− mice with or without cancer using 0.37 M (10%) FeCl3.15,19 The FeCl3 model was associated with the presence of platelets within thrombi both in WT and Gas6−/− mice as shown by von Willebrand factor (VWF) staining (supplemental Figure 1). Thrombus size was monitored in IVC using HFUS, as previously described.19 Briefly, using the software of the Vevo 770 micro imaging system (VisualSonics), thrombus cross-sectional area was determined by delineating the area of the clot to obtain a measurement in mm2. Measurements were taken between 30 and 45 minutes when a steady state was reached. In a separate group of mice, thrombi were dissected out directly from the IVC, blotted dry, and weighed.
When indicated, mice were injected intraperitoneally with a specific EP3 antagonist (100 µM, L-798106; Tocris) or IV with recombinant Gas6 (rGas6) (100 ng/mL; R&D) 1 hour prior to induction of venous thrombosis.
Hematoxylin and eosin (H&E) and immunofluorescent staining
The vein wall with thrombi were removed, fixed in 4% paraformaldehyde, and embedded vertically in optimal cutting temperature compound (Tissue-Tek, Sakura). Serial 10-μm frozen sections were cut using a cryostat and transferred onto gelatin-coated slides. Slides were then stained with H&E. Images were acquired at room temperature with a Leica DM 2000 fluorescent microscope (×5 and ×40 magnifications) and the Infinity Capture software (Concord, ON, Canada). Quantifications of histologic surface area were done using ImageJ version 1.44p (National Institutes of Health [NIH], Bethesda, MD).
Endothelial cell culture
Endothelial cells were extracted from the lungs of healthy WT and Gas6−/− mice as previously described.15 We established a culture system where WT or Gas6−/− endothelial cells were cultured together with M27 cancer cells, separated by a 0.4 μm transwell filter (Falcon). WT and Gas6−/− endothelial cells were grown in 24-well plate cells on 12-mm cover slips for immunofluorescence or on 6-well plates for protein and RNA extraction. Cell culture inserts with M27 cells were inserted and cultured with the endothelial cells for 48 hours. When indicated, endothelial cells were treated with 5 µM of PD98059, 100 µM EP3 blocker, or 3 ng/mL PGE2.
Immunofluorescence
After 48 hours incubation with the M27 cancer cells, endothelial cells were fixed with 4% paraformaldehyde for 10 minutes, permeabilized in 0.5% Triton X-100 for 10 minutes, blocked with 10% bovine serum albumin for 30 minutes, and incubated with a goat anti-mouse Ptges antibody (Santa Cruz Biotechnology) for 1 hour. Cells were then incubated with an anti-goat Alexa Fluor 488 antibody for 1 hour. Slides were mounted using mounting media containing 4,6 diamidino-2-phenylindole (Vector Laboratories). Images were acquired at room temperature with a Leica DM 2000 fluorescent microscope (×40 magnification) and the Infinity Capture software (Concord, ON, Canada). Quantification of histologic surface area was done using ImageJ version 1.44p (NIH).
RNA isolation and microarray analysis
Following the manufacturer’s instructions (Geneaid; FroggaBio), total RNA was extracted from endothelial cells after culture with or without M27 for 48 hours. Illumina oligonucleotide chip (MouseWG-6 version 2.0; >45 000 probes representing >30 000 genes) microarray assays (Illumina, San Diego, CA) were performed at the Genome Quebec Innovation Center (Montreal, QC, Canada). Normalization and processing of the results were performed using FlexArray version 1.6 software (Genome Quebec Innovation Center) implementing “negative control” background correction, “VST” variance stabilizing transformation, and “Robust Spline” normalization, followed by statistical analysis based on the Cyber-T estimation of gene-specific variances according to D. Rocke and with a false discovery rate correction based on the method by Benjamini Hochberg minimum. Twofold differences in expression and false discovery rate <0.05 were the thresholds used in this study.
Real-time quantitative polymerase chain reaction (qPCR)
Gene expression was evaluated in WT and Gas6−/− endothelial cells exposed or not to M27 cancer cells, by real-time qPCR. One μg of total RNA, extracted following the manufacturer’s instructions (Geneaid), was reverse-transcribed (Quanta). Real-time qPCR was carried out on a 7500 Fast Real-Time PCR System (Applied Biosystems). The SYBR Green Intercalate was used for amplification detection with the Fast SYBR Green Master Mix (Quanta). Primers were used at 600 nmol/L and designed using the Primer Express Software (Applied Biosystems). Fold change were calculated using the △Ct method and results expressed as fold change ± standard deviation of 6 independent experiments. The primer sequences are summarized in supplemental Table 1.
Enzyme-linked immunosorbent assay
PGE2 concentration in culture supernatants of WT and Gas6−/− endothelial cells either untreated or cultured with M27 cells were collected and analyzed by enzyme-linked immunosorbent assay (R&D) following the manufacturer’s instructions.
Platelet activation
Platelets were prepared from whole blood of WT mice. Blood was collected by cardiac puncture in syringes primed with citrate from a donor mouse. Platelet-rich plasma was prepared as previously described.15 For phalloidin staining, 12-mm cover slips were coated with 100 μg/mL fibrinogen. Platelets were added to each well and incubated for 15 minutes at 37°C. Platelets were then incubated with or without 1 U/mL thrombin, 1.5 ng/mL, or 3 ng/mL of PGE2. Non-adherent platelets were removed, and adherent cells were fixed in 1% paraformaldehyde for 15 minutes at room temperature. Platelets were permeabilized in 0.1% Triton X-100 for 10 minutes and incubated in rhodamine-phalloidin (1:200; Molecular Probes) for 30 minutes. Cover slips were then mounted with mounting media (Vector Laboratories, Inc.). Platelet spreading was analyzed at room temperature with a Leica DM 2000 fluorescent microscope (×60 magnification) and the Infinity Capture software (Concord, ON, Canada). Quantification of platelet size was done using ImageJ version 1.44p (NIH). Platelet activation was also evaluated by flow cytometry with fluorescein isothiocyanate-conjugated anti–P-selectin antibody (BD Biosciences) and analyzed using a FACScan instrument and CellQuest software.
Western blot analysis
For western blot analysis, endothelial cells and platelets were homogenized in lysis buffer containing 1% nonidet P-40, 0.5% deoxycholic acid, 0.1% sodium dodecyl sulfate, 1% triton, and anti-proteases inhibitor cocktail. A total of 25 μg of protein were loaded on a 10% polyacrylamide gel, subjected to electrophoresis, and transferred to a nitrocellulose membrane. Membranes were incubated overnight with rabbit anti-phospho–extracellular signal-regulated kinase (ERK)1/2, rabbit anti-ERK1/2, rabbit anti-phospho–Akt (Ser473) antibody, rabbit anti-Akt (Cell Signaling Technology), goat anti-β3 integrin (Santa Cruz Biotechnology), and rabbit anti-phospho β3 integrin antibodies (BioSource International).
Statistical analysis
Data are presented as mean ± standard deviation from multiple independent experiments. Within-group differences were assessed by one-way analysis of variance followed by a post hoc Student-Newman-Keuls test. A value of P < .05 was considered statistically significant.
Results
Cancer-induced venous thrombosis is mediated by Gas6
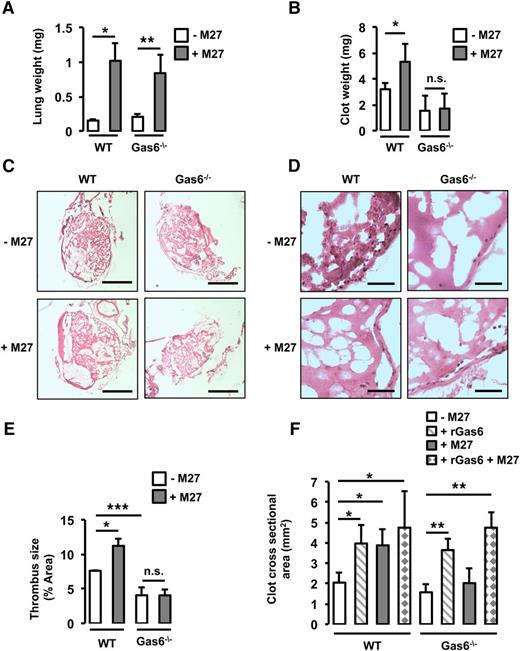
To assess the role of Gas6 in cancer-induced thrombosis, WT and Gas6−/− mice were injected with M27 murine lung cancer cells prior to thrombosis induction. Mice were weighed before injection with the cancer cells, and the body weight and physical appearance were monitored every day postinjection. End-stage cancer was defined as a weight loss of 10% to 15% of the initial total body weight (supplemental Table 2). As mentioned in “Methods,” end-stage cancer was reached 14 days after the injection of M27 cancer cells in WT mice and after 17 to 21 days in Gas6−/− mice. To ascertain that WT and Gas6−/− mice were at a similar stage of cancer, lung weight was measured when euthanized. Injection of M27 cancer cells increased lung weight equivalently after 14 days in WT mice and after 17 to 21 days in Gas6−/− mice (Figure 1A).
Gas6 deficiency protects mice against lung cancer-induced venous thrombosis. (A) WT and Gas6−/− mice were injected with M27 cancer cells. After 14 days for the WT mice and 17 to 21 days for the Gas6−/− mice, lung weight was measured to ascertain similar tumor burden. Lung weight was increased equivalently in WT and Gas6−/− mice. WT mice injected with M27 cancer cells developed significantly larger thrombi compared with WT mice injected with phosphate-buffered saline. Gas6−/− mice did not develop larger thrombi as seen by (B) clot weight, (C) H&E staining of thrombus sections (bars, 100 μm), and (D) higher magnification of H&E staining (bar, 10 μm). (E) Quantifications of the H&E staining expressed as thrombus size. (F) Cross-sectional area measured by ultrasonography confirmed that lung cancer increased venous thrombosis in WT but not Gas6−/− mice. Injection of rGas6 restored the WT phenotype in Gas6−/− mice. *P < .05 comparing WT vs WT + M27, WT vs WT + rGas6, and WT vs WT + rGas6 + M27; **P < .05 comparing Gas6−/− vs Gas6−/− + rGas6, Gas6−/− vs Gas6−/− + M27, and Gas6−/− vs Gas6−/− + rGas6 + M27; ***P < .05 comparing WT vs Gas6−/−. n.s., not significant.
Gas6 deficiency protects mice against lung cancer-induced venous thrombosis. (A) WT and Gas6−/− mice were injected with M27 cancer cells. After 14 days for the WT mice and 17 to 21 days for the Gas6−/− mice, lung weight was measured to ascertain similar tumor burden. Lung weight was increased equivalently in WT and Gas6−/− mice. WT mice injected with M27 cancer cells developed significantly larger thrombi compared with WT mice injected with phosphate-buffered saline. Gas6−/− mice did not develop larger thrombi as seen by (B) clot weight, (C) H&E staining of thrombus sections (bars, 100 μm), and (D) higher magnification of H&E staining (bar, 10 μm). (E) Quantifications of the H&E staining expressed as thrombus size. (F) Cross-sectional area measured by ultrasonography confirmed that lung cancer increased venous thrombosis in WT but not Gas6−/− mice. Injection of rGas6 restored the WT phenotype in Gas6−/− mice. *P < .05 comparing WT vs WT + M27, WT vs WT + rGas6, and WT vs WT + rGas6 + M27; **P < .05 comparing Gas6−/− vs Gas6−/− + rGas6, Gas6−/− vs Gas6−/− + M27, and Gas6−/− vs Gas6−/− + rGas6 + M27; ***P < .05 comparing WT vs Gas6−/−. n.s., not significant.
Thrombosis was induced in the IVC using FeCl3 in WT and Gas6−/− mice with or without cancer. First, thrombus weight was increased in WT mice injected with M27 cancer cells compared with WT control (Figure 1B). Then, after H&E staining, thrombus surface area was measured. Thrombus surface area was increased by cancer in WT mice (Figure 1C-E). Interestingly, unlike WT mice, Gas6−/− mice with cancer did not develop larger thrombi compared with Gas6−/− control mice (Figure 1B-E), suggesting that Gas6 is involved in cancer-associated thrombosis. Finally, thrombus formation in the IVC was monitored for 30 minutes using HFUS as previously described.19 In WT but not in Gas6−/− mice, the presence of M27 cancer cells increased thrombus cross-sectional area (Figure 1F). To confirm the direct role of Gas6, WT and Gas6−/− mice were injected with rGas6 prior to thrombus induction. rGas6 increased thrombus cross-sectional area in WT. Interestingly, injection of rGas6 in Gas6−/− mice restored thrombus size to a level comparable to that of WT mice (Figure 1F).
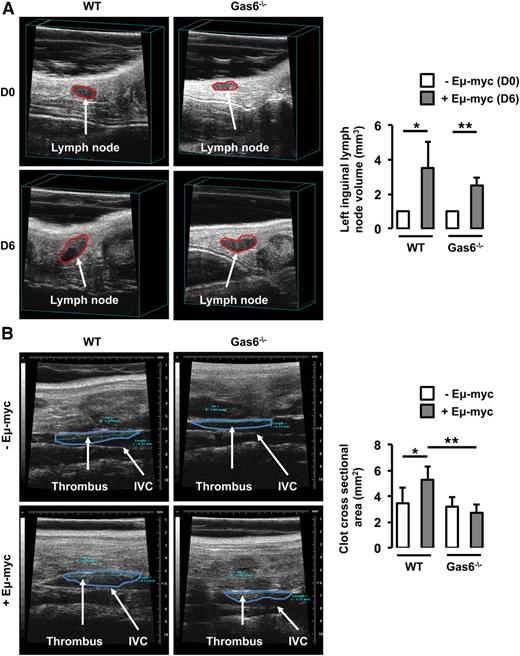
In parallel, WT and Gas6−/− mice were injected with Eμ-myc B-lymphoma cells. Thrombosis was induced using the FeCl3 model in the IVC 6 days after the injection of Eμ-myc B-lymphoma cells when lymph node volume was significantly increased in both WT and Gas6−/− mice (Figure 2A). In WT mice, lymphoma was associated with an increased thrombus cross-sectional area in the IVC compared with control animals. However, lymphoma had no effect on thrombus cross-sectional area in Gas6−/− mice (Figure 2B).
Gas6 deficiency also protects mice against B-cell lymphoma. (A) Lymph node volume was measured in the same mouse prior to (D0) and after (D6) the injection of Eμ-myc B-cell lymphoma. Lymphoma significantly increased lymph node size in WT and Gas6−/− mice after 6 days. (B) Eμ-myc B-cell lymphoma significantly increased thrombus cross-sectional area in the IVC of WT mice but not in the IVC of Gas6−/− mice. *P < .05 comparing WT vs WT + Eμ-myc; **P < .05 comparing WT + Eμ-myc vs Gas6−/− + Eμ-myc, and Gas6−/− vs Gas6−/− + Eμ-myc. D0, day 0; D6, day 6.
Gas6 deficiency also protects mice against B-cell lymphoma. (A) Lymph node volume was measured in the same mouse prior to (D0) and after (D6) the injection of Eμ-myc B-cell lymphoma. Lymphoma significantly increased lymph node size in WT and Gas6−/− mice after 6 days. (B) Eμ-myc B-cell lymphoma significantly increased thrombus cross-sectional area in the IVC of WT mice but not in the IVC of Gas6−/− mice. *P < .05 comparing WT vs WT + Eμ-myc; **P < .05 comparing WT + Eμ-myc vs Gas6−/− + Eμ-myc, and Gas6−/− vs Gas6−/− + Eμ-myc. D0, day 0; D6, day 6.
Microarray analysis identifies PGE synthase as a gene of interest
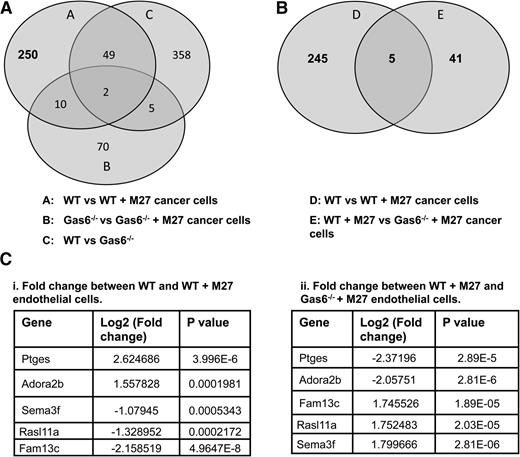
To identify novel genes that are differentially regulated by Gas6 during cancer-induced hypercoagulability, we assessed gene expression in WT and Gas6−/− endothelial cells exposed or not to M27 cancer cells. RNA from WT and Gas6−/− endothelial cells was used for whole genome microarray analysis. We first generated a list of genes that were either up- or downregulated in WT endothelial cells upon exposure to cancer cells (311 genes) (Figure 3A, circle A). Twelve (10 + 2) of those genes, irrelevant for hemostasis, were also differentially expressed in Gas6−/− endothelial cells upon M27 cancer exposure and were thus removed (among the 87 genes) (Figure 3A, circle B). Forty-nine genes were also removed because their expression was independent of M27 cancer exposure or the genotype of the endothelial cells (among the 414 genes) (Figure 3A, circle C). This generated a list of 250 genes expressed in WT endothelial cells when exposed to M27 cancer cells. A list of genes that were differentially regulated in WT and Gas6−/− endothelial cells exposed to M27 cancer cells was also generated (46 genes) (Figure 3B, circle E). These genes were of particular interest as they were Gas6 dependent. These 46 genes were compared with the 250 genes generated above (Figure 3B, circle D). As a result, we obtained 5 genes in common that were: (1) significantly different in WT endothelial cells upon cancer exposure, and (2) were Gas6 dependent (Figure 3B). Of these 5 genes, Ptges gene expression was the most significantly upregulated by M27 cancer cells in WT endothelial cells (Figure 3Ci), while not being significantly induced in Gas6−/− endothelial cells (Figure 3Cii).
Gene expression in WT and Gas6−/− endothelial cells exposed to M27 cancer cells. (A) 311 genes (circle A) were either up- or downregulated in WT endothelial cells upon exposure to M27 cancer cells. Twelve of those genes were not Gas6 dependent because they were differentially expressed in response to cancer cells in WT and Gas6−/− endothelial cells (circles A and B). Forty-nine genes were unrelated to cancer because they were differentially expressed in the absence of M27 cancer cells (circle C). That left 250 genes differentially expressed in WT endothelial cells cultured with M27 cancer cells that were Gas6 dependent. (B) 5 of those 250 genes (circle D) were common to 46 genes (circle E) differentially expressed when M27 cancer cells were cultured with WT vs Gas6−/− endothelial cells. (C) Identity of the 5 genes of interest with relevant fold changes and P values. Ptges was most significantly (i) upregulated in WT endothelial cells exposed to M27 cancer cells and most significantly (ii) downregulated in Gas6−/− endothelial cells cultured with M27 cancer cells.
Gene expression in WT and Gas6−/− endothelial cells exposed to M27 cancer cells. (A) 311 genes (circle A) were either up- or downregulated in WT endothelial cells upon exposure to M27 cancer cells. Twelve of those genes were not Gas6 dependent because they were differentially expressed in response to cancer cells in WT and Gas6−/− endothelial cells (circles A and B). Forty-nine genes were unrelated to cancer because they were differentially expressed in the absence of M27 cancer cells (circle C). That left 250 genes differentially expressed in WT endothelial cells cultured with M27 cancer cells that were Gas6 dependent. (B) 5 of those 250 genes (circle D) were common to 46 genes (circle E) differentially expressed when M27 cancer cells were cultured with WT vs Gas6−/− endothelial cells. (C) Identity of the 5 genes of interest with relevant fold changes and P values. Ptges was most significantly (i) upregulated in WT endothelial cells exposed to M27 cancer cells and most significantly (ii) downregulated in Gas6−/− endothelial cells cultured with M27 cancer cells.
To confirm the outcome of gene expression shown by the microarray analysis, expression of semaphorin 3F, serpin peptidase inhibitor, clade G, member 1, inhibitor of DNA binding 1, thrombospondin-2, and matrix metallopeptidase 3 was evaluated by real-time qPCR. Data from the real-time qPCR confirm the microarray data (supplemental Figure 2). Supplemental Table 3 shows fold changes by microarray analysis and real-time qPCR in WT and Gas6−/− cells after exposure to M27 cells.
Cancer-induced Ptges expression in endothelial cells requires Gas6
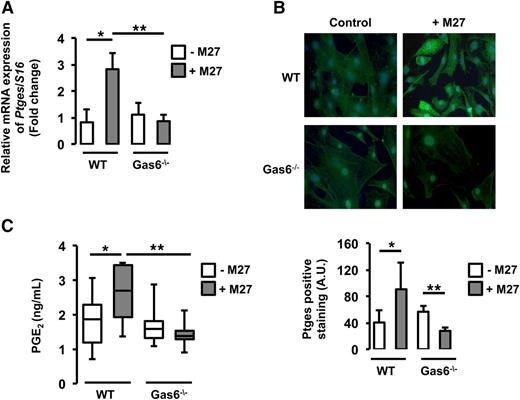
Consistent with the microarray data, real-time qPCR demonstrated that Ptges messenger RNA (mRNA) was increased in WT endothelial cells cultured with M27 cancer cells compared with untreated WT endothelial cells. However, in Gas6−/− endothelial cells, incubation with M27 cancer cells did not change Ptges gene expression (Figure 4A).
Ptges was induced only in WT endothelial cells exposed to M27 cancer cells.Ptges gene (A) and protein (B) expression was increased in WT but not Gas6−/− endothelial cells after culture with M27 cancer cells. (C) PGE2, the enzymatic product of Ptges, was induced only in media of WT endothelial cells exposed to M27 cancer cells. *P < .05 comparing WT vs WT + M27; **P < .05 comparing WT + M27 vs Gas6−/− + M27 and Gas6−/− vs Gas6−/− + M27. A.U., arbitrary units.
Ptges was induced only in WT endothelial cells exposed to M27 cancer cells.Ptges gene (A) and protein (B) expression was increased in WT but not Gas6−/− endothelial cells after culture with M27 cancer cells. (C) PGE2, the enzymatic product of Ptges, was induced only in media of WT endothelial cells exposed to M27 cancer cells. *P < .05 comparing WT vs WT + M27; **P < .05 comparing WT + M27 vs Gas6−/− + M27 and Gas6−/− vs Gas6−/− + M27. A.U., arbitrary units.
To further validate our results, we assessed Ptges protein expression in WT and Gas6−/− endothelial cells cultured with or without M27 cancer cells. Upon exposure to M27 cancer cells, fluorescent staining for Ptges was increased in WT endothelial cells but not in Gas6−/− endothelial cells (Figure 4B). Because Ptges converts PGH2 to PGE2, we determined if increased Ptges expression was associated with increased PGE2 production by endothelial cells. Accordingly, PGE2 levels were measured in the supernatant of WT and Gas6−/− endothelial cells exposed to M27 cancer cells. M27 cancer cells increased PGE2 levels in WT but not Gas6−/− endothelial cells (Figure 4C).
Cancer-induced Ptges expression is mediated through the ERK1/2 pathway
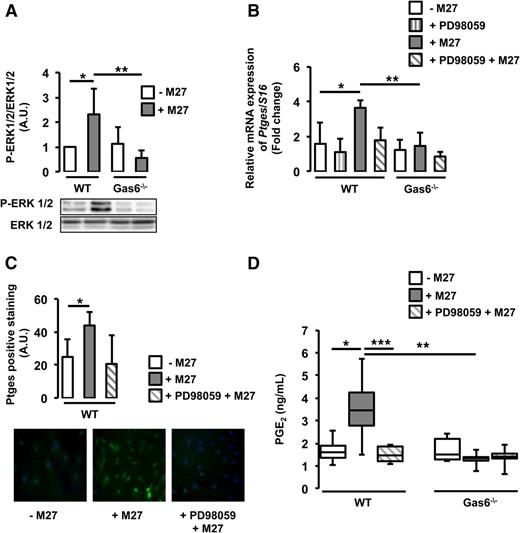
Ptges gene expression is mediated by the ERK1/2 signaling pathway.20 Gas6 has also been shown to mediate some of its effects through the same pathway.16 We hypothesize that cancer-induced Ptges expression in endothelial cells may be mediated through ERK1/2 activation. We demonstrated that ERK1/2 is phosphorylated in WT, but not Gas6−/−, endothelial cells cultured with M27 cancer cells (Figure 5A). Pretreatment of WT endothelial cells with a specific ERK1/2 inhibitor, PD98059, reduced ERK1/2 phosphorylation (supplemental Figure 3) and subsequent Ptges mRNA expression (Figure 5B). PD98059 tended to inhibit Ptges protein expression, although not significantly (Figure 5C). ERK1/2 inhibition also decreased PGE2 secretion (Figure 5D).
Cancer induces Ptges in endothelial cells via ERK phosphorylation. (A) ERK1/2 was phosphorylated only in WT endothelial cells exposed to M27 cancer cells. (B) Inhibition of ERK1/2 with PD98059 decreased cancer-induced Ptges mRNA expression in WT endothelial cells. (C) PD98059 tended to inhibit Ptges protein expression in WT endothelial cells. (D) PGE2 levels were reduced in the media of WT cultured with M27 cancer cells in the presence of PD98059. *P < .05 comparing WT vs WT + M27; **P < .05 comparing WT + M27 vs Gas6−/− + M27; ***P < .05 comparing WT + M27 and WT + PD98059 + M27.
Cancer induces Ptges in endothelial cells via ERK phosphorylation. (A) ERK1/2 was phosphorylated only in WT endothelial cells exposed to M27 cancer cells. (B) Inhibition of ERK1/2 with PD98059 decreased cancer-induced Ptges mRNA expression in WT endothelial cells. (C) PD98059 tended to inhibit Ptges protein expression in WT endothelial cells. (D) PGE2 levels were reduced in the media of WT cultured with M27 cancer cells in the presence of PD98059. *P < .05 comparing WT vs WT + M27; **P < .05 comparing WT + M27 vs Gas6−/− + M27; ***P < .05 comparing WT + M27 and WT + PD98059 + M27.
Cancer-induced PGE2 secretion from endothelial cells induces platelet activation
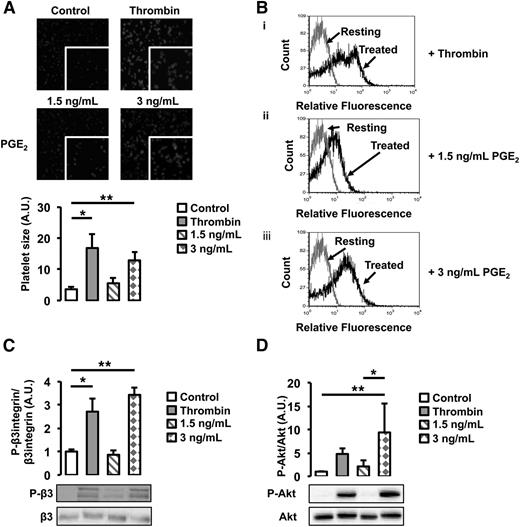
To investigate the functional role of cancer-induced PGE2 secretion from WT endothelial cells, we assessed its effect on platelet activation. WT platelets were treated with 2 different doses of PGE2, a low dose (1.5 ng/mL) equivalent to the concentration of PGE2 found in the supernatant of untreated WT and Gas6−/− endothelial cells, and a high dose (3 ng/mL), corresponding to the concentration found in the supernatant of WT endothelial cells exposed to M27 cancer cells. As a positive control, platelets were treated with thrombin, a known agonist. When treated with 3 ng/mL of PGE2, platelet size, an indicator of platelet spreading, increased 3 times compared with untreated platelets (Figure 6A). In response to 1.5 ng/mL of PGE2, platelet spreading was not significantly different compared with untreated platelets. In response to 3 ng/mL of PGE2, a higher percentage of platelets also expressed P-selectin, a known platelet activation marker (Figure 6B); this was not observed in platelets treated with 1.5 ng/mL of PGE2. Both the β3 integrin and Akt were phosphorylated when platelets were treated with 3 ng/mL of PGE2 but not 1.5 ng/mL (Figure 6C-D). These results show that platelets are activated in response to 3 ng/mL PGE2 but not 1.5 ng/mL, suggesting that, in response to cancer, PGE2 participates in platelet activation.
PGE2 activates WT platelets. (A) Platelet spreading was increased by the addition of thrombin and 3 ng/mL of PGE2. Treatment with 1.5 ng/mL of PGE2 had no effect. (B) P-selectin expression, assessed by flow cytometry, was increased by thrombin and 3 ng/mL of PGE2. Gray line denotes the expression of P-selectin in resting platelets; black lines denote the expression of P-selectin with (i) thrombin, (ii) 1.5 ng/mL of PGE2, or (iii) 3 ng/mL of PGE2 treatment. (C) β3 integrin phosphorylation was increased after treatment with thrombin or 3 ng/mL of PGE2 but not 1.5 ng/mL of PGE2. (D) Akt phosphorylation was increased after treatment with thrombin or 3 ng/mL of PGE2 but not 1.5 ng/mL of PGE2. *P < .05 or **P < .05 comparing treatment group with control.
PGE2 activates WT platelets. (A) Platelet spreading was increased by the addition of thrombin and 3 ng/mL of PGE2. Treatment with 1.5 ng/mL of PGE2 had no effect. (B) P-selectin expression, assessed by flow cytometry, was increased by thrombin and 3 ng/mL of PGE2. Gray line denotes the expression of P-selectin in resting platelets; black lines denote the expression of P-selectin with (i) thrombin, (ii) 1.5 ng/mL of PGE2, or (iii) 3 ng/mL of PGE2 treatment. (C) β3 integrin phosphorylation was increased after treatment with thrombin or 3 ng/mL of PGE2 but not 1.5 ng/mL of PGE2. (D) Akt phosphorylation was increased after treatment with thrombin or 3 ng/mL of PGE2 but not 1.5 ng/mL of PGE2. *P < .05 or **P < .05 comparing treatment group with control.
EP3 receptor antagonism inhibits cancer-induced venous thrombosis
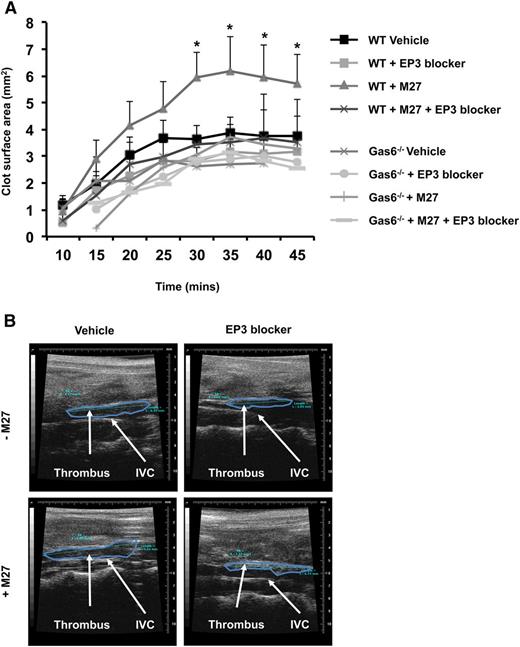
PGE2 activates platelets through the EP3 receptor.21 Therefore, we hypothesize that blocking the EP3 receptor would impair Gas6-mediated cancer-induced thrombosis. WT and Gas6−/− mice were injected with or without M27 cancer cells. One hour prior to thrombus induction, mice were injected with 100 µM of L798-106, a specific EP3 receptor antagonist or vehicle control. Injection of EP3 antagonist had no effect on thrombus size in healthy WT and Gas6−/− mice (Figure 7A-B). Interestingly, blocking the EP3 receptor reduced thrombus size in WT mice with cancer (Figure 7A-B). These results show that cancer-induced venous thrombosis in WT mice is partly due to the activation of EP3 receptors on platelets. Gas6 deficiency may inhibit the expression of Ptges in endothelial cells in response to cancer, reducing PGE2 synthesis, and thereby protecting mice against cancer-induced venous thrombosis.
Blocking EP3 receptors reduced cancer-induced venous thrombosis in WT mice. (A) Administering EP3 blocker to WT mice with cancer prior to induction of venous thrombosis, protects these mice from cancer-induced venous thrombosis as demonstrable by ultrasonography. (B) Representative pictures of venous thrombi in the 4 experimental groups obtained by HFUS. *P < .05 WT + M27 vs WT + M27 + EP3 blocker.
Blocking EP3 receptors reduced cancer-induced venous thrombosis in WT mice. (A) Administering EP3 blocker to WT mice with cancer prior to induction of venous thrombosis, protects these mice from cancer-induced venous thrombosis as demonstrable by ultrasonography. (B) Representative pictures of venous thrombi in the 4 experimental groups obtained by HFUS. *P < .05 WT + M27 vs WT + M27 + EP3 blocker.
Discussion
Many studies have suggested that malignancies thrive in and promote a procoagulant milieu.5 However, the underlying mechanisms have not been well established. It is possible that malignant cells can activate, directly or indirectly, the coagulation cascade. For example, malignant cells express TF on their cell surface, and this could directly activate coagulation.22 Tumor cells also shed TF-containing microvesicles that participate in promoting thrombin generation and thrombosis. Other factors such as cysteine proteases, which directly activate factor X, are also expressed by tumor cells23 and can lead to coagulation activation. Cancer cells may also trigger coagulation indirectly by activating other cells such as endothelial cells, leukocytes, and/or platelets. Cytokines produced by tumor cells may decrease the anti-thrombogenic properties of the endothelium by inducing the internalization of thrombomodulin,24 a potent anticoagulant protein, and by increasing procoagulant cell surface TF expression.25 For example, malignant melanoma cells generate thrombin by increasing TF expression and induce VWF secretion from the endothelium.26 Increased TF expression and VWF secretion can, in turn, lead to a hypercoagulable state. Malignant cells also interact with surrounding monocytes and macrophages causing them to release inflammatory cytokines such as tumor necrosis factor (TNF)-α, interleukin (IL)-1β, and IL-6, which can promote a prothrombotic phenotype. Tumors can also induce TF expression and the release of TF-bearing microvesicles from monocytes and macrophages.27 It was recently demonstrated that TF-bearing microvesicles derived from pancreatic cancer cells induce deep vein thrombosis (DVT) in mice.28 Therefore, the interaction of malignant cells with surrounding cells and the coagulation system is complex and multifactorial.
Gas6 has been linked to inflammation and thrombosis. Gas6 facilitates the interaction between the endothelium, platelets, and leukocytes, thus promoting inflammation.29 During inflammation, the endothelium from Gas6−/− mice has been shown to be unresponsive to inflammatory stimuli such as TNF-α.29 Gas6 has also been shown to have procoagulant properties. Gas6 deficiency protects against arterial and venous thrombosis by reducing platelet aggregation.14 Recently, we demonstrated that endothelial-derived Gas6 contributes to venous thrombosis development through TF expression in the vascular wall.15,16 Hence, we demonstrated that healthy Gas6−/− mice developed smaller thrombi when challenged with FeCl3 compared with healthy WT mice.14,15
The current study shows, for the first time, that Gas6 is required for cancer-induced DVT in 2 different models of cancer, namely lung cancer and B-cell lymphoma. We found that Gas6 plays a key role in cancer-induced thrombosis because injection of rGas6 to Gas6−/− mice restores the WT phenotype regarding thrombus development. We demonstrated in vitro that M27 lung cancer cells induce the expression of Ptges and the subsequent secretion of PGE2 from WT but not Gas6−/− endothelial cells, which leads to platelet activation. Our microarray data showed that Ptges was not only the most significantly regulated gene between healthy WT mice and WT mice with cancer, but also between WT and Gas6−/− mice exposed to cancer. One can expect that TF may have been an obvious target because it has been involved in cancer-associated coagulopathy and DVT. However, the role of TF was not addressed in the present study because it was not significantly regulated in our cancer-associated thrombosis model.
The biosynthetic pathway of PGE2 involves the conversion of PGH2 to PGE2, mainly by Ptges.30 Ptges is an inducible synthase released in response to inflammatory stimuli, such as IL-1β, TNF-α, and lipopolysaccharide.31 As mentioned earlier, endothelial cells lacking Gas6 are not readily activated by inflammatory stimuli.29 As such, Gas6−/− endothelial cells express lower levels of pro-inflammatory markers such as intercellular adhesion molecule-1 and vascular cell adhesion molecule-1 in response to TNF-α.29 We demonstrate that Ptges is induced in WT but not in Gas6−/− endothelial cells exposed to M27 cancer cells, and leads to an increased secretion of PGE2. Malignancies promote a proinflammatory response by secreting cytokines and chemokines.32-34 One can speculate that proinflammatory stimuli, such as IL-1β and TNF-α, or microvesicles released from M27 cancer cells, may be responsible for the increased Ptges and PGE2 expression. However, we did not address which factor released by the M27 cancer leads to Ptges expression in WT endothelial cells. In addition, we found that, ERK1/2 was activated in WT endothelial cells after culture with M27 cancer cells. Inhibiting ERK1/2 phosphorylation, by PD98059, reduced Ptges expression and decreased secretion of PGE2. Although it was not investigated in the present study, we previously showed that ERK1/2 was induced by Gas6 through Axl in endothelial cells.16 Thus, we would hypothesize that Axl may be involved in the mechanisms described in the present study. These observations support the notion that the induction of Ptges may be a direct outcome of malignancy potentially through inflammatory mediators or microvesicles produced by the M27 cancer cells. These results also suggest that M27 cancer cells may induce the production of Gas6 by WT endothelial cells, as we previously demonstrated with thrombin.15 Thus, it is possible that an autocrine loop triggers the activation of ERK1/2 through Gas6 upregulation by M27 cancer cells.
PGE2 is a well known lipid mediator that plays a central role in mediating inflammation, pain, and fever.35 Inflammation induces secretion of PGE2 from the vascular wall, which opposes the effect of nitrogen oxide and prostacyclin to shift the local hemostatic balance toward a prothrombotic state.36 PGE2 is produced in response to endothelial injury caused by FeCl3 leading to arterial thrombosis. Increased PGE2 levels facilitate platelet activation and thrombosis.36 Hence, platelet recruitment and activation was found to play an important role both in an injury model of venous thrombosis such as FeCl3, and in a flow restriction model that closely resemble human DVT.37-39
PGE2 acts through 4 different G-protein–coupled receptors: EP1, EP2, EP3, and EP4.40 All receptors are expressed on the murine platelets, however, EP3 levels are predominant.41 Mice lacking the EP3 receptor have a decreased susceptibility to thromboembolism induced by the injection of arachidonic acid or collagen and epinephrine.21 In our study, we found that WT endothelial cells exposed to M27 cancer cells produce more PGE2, which could account for an increased susceptibility to venous thrombosis, similar to arteriolar thrombosis. Blocking the EP3 receptor decreased cancer-induced venous thrombosis in WT mice.
In conclusion, the above findings provide pathophysiologic insight into cancer-associated venous thrombosis and may help identify novel targets to specifically treat this complication.
The microarray data reported in this article have been deposited in the ArrayExpress database (accession number E-MTAB-3305).
The online version of the article contains a data supplement.
The publication costs of this article were defrayed in part by page charge payment. Therefore, and solely to indicate this fact, this article is hereby marked “advertisement” in accordance with 18 USC section 1734.
Acknowledgments
This study was supported by a grant from the Heart and Stroke Foundation of Canada.
Authorship
Contribution: M.N.A. designed experiments, performed research, analyzed data, and wrote the manuscript; C.A.L. designed the research and analyzed data, performed research, and wrote the manuscript; F.-R.B. performed research; and M.D.B. conceived and financed the study, and wrote the manuscript.
Conflict-of-interest disclosure: The authors declare no competing financial interests.
Correspondence: Mark D. Blostein, Lady Davis Institute for Medical Research, McGill University, 3999 Côte-Ste-Catherine Rd, Room F-130, Montreal, QC, Canada H3T 1E2; e-mail: mark.blostein@mcgill.ca.

This feature is available to Subscribers Only
Sign In or Create an Account Close Modal